
Detection of Gene-gene Interactions: Methodological Comparison on
Real-World Data and Insights on Synergy between Methods
Hugo Boisaube rt and Christine Sinoquet
LS2N, UMR CNRS 6004, University of Nantes, France
Keywords:
Gene-gene Interaction, Machine Learning, Markov Blanket, High-dimensional Data, Comparative Analysis.
Abstract:
In this paper, we report three contributions in the field of gene-gene interaction (epistasis) detection. Our first
contribution is the comparative analysis of five approaches designed to tackle epistasis detection, on real-world
datasets. The aim is to help fill the lack of feedback on the behaviors of published methods in real-life epistasis
detection. We focus on four state-of-the-art approaches encompassing random forests, Bayesian i nference,
optimization techniques and Markov blanket learning. B esides, a recently developed approach, SMMB-ACO
(Stochastic Multiple Markov Blankets with Ant Colony Opti mi zati on) is included in the comparison. Thus, our
second contribution addresses assessing the behavior of SMMB-ACO on real-world data, while SMMB-ACO
was mainly evaluated so far through small-scale simulations. We used a published case control dataset related
to Crohn’s disease. Focusing on pairwise interactions, we report a great heterogeneity across the methods
in running times, memory occupancies, numbers of interactions output, distributions of p-values and odds
ratios characterizing the interactions. Then, our third contribution is a proof-of-concept study in t he context of
genetic association interaction studies, to foster alternatives to analyses driven by prior biological knowledge.
The principle is to cross the results of several machine learning methods whose intrinsic mechanisms greatly
differ, to provide a priorized list of interactions to be validated experimentally. Focusing on the interactions
identified in common by two methods at least, we obtained a priorized list of 56 interactions, fr om which we
could infer one interaction network of size 7, four networks of size 4 and six of size 3.
1 INTRODUCTION
Over the pa st twenty years, automated high-
throughput gen otyping technologie s have allowed a
shift from candidate-ge ne analyses to g enome-wide
association studies (GWASs). The pr imary objective
of GWASs is to detect associations (i.e., statistical de-
pendences) between genetic variants and a phenotype
of interest, in a population under study. Aiming to
better understand the biolog y of diseases, GWASs are
expected to foster prevention and improve drug treat-
ment, to usher the era of personalized medicine. In
the latter, prevention and drug treatment are designed
depending on the genetic p rofile of the patient.
Typically, in GWASs, between a few thousand
to ten thousand subjects are ge notyped, which pro-
vides the measure of DNA variation at characterized
loci called genetic ma rkers, spread over the genome.
Single nucleotide polymorphisms (SNPs) are widely-
used genetic markers. Depending on the microarray
used, the number of SNPs ranges from a few hundred
thousands to a few millions. From now on, we will
consider SNP-based association studies.
New biological insights were g le aned by explo-
ring GWAS hits for diseases such as inflammatory bo-
wel disease, type 2 diabetes, cardiovascular diseases,
bipolar disorder, as well as some cancers, to cite a few.
However, most of the inherited risk remains to be ex-
plained for most phenotypes investigated so far, a situ-
ation named missing heritability. Therefore, comple-
mentary lines of investigation have started to explore
alternative heritable components of complex phenoty-
pes, encompassing rare variants, structural variants,
epigenetics, and genetic interactions. This paper fo-
cuses on computational approaches designed to iden-
tify genetic interactions, also named epistatic interac-
tions. From a statistical point of view, epistasis defi-
nes the deviation from the model in which the cumu-
lative effects of multiple SNPs linearly determine the
pheno type. A persuasive piece of evidence supports
the ro le of genetic interactions to explain where pa rt
of the missing heritability hides: biomo lecular inter-
actions are ubiquitous in gene regulation and bioche-
mical and metabolic systems (Furlong, 2013; Gilber t-
Diamond and Moore, 2011). Biological evidence of
epistasis has been put forward in several publicati-
30
Boisaubert, H. and Sinoquet, C.
Detection of Gene-gene Interactions: Methodological Comparison on Real-World Data and Insights on Synergy between Methods.
DOI: 10.5220/0007374400300042
In Proceedings of the 12th International Joint Conference on Biomedical Engineering Systems and Technologies (BIOSTEC 2019), pages 30-42
ISBN: 978-989-758-353-7
Copyright
c
2019 by SCITEPRESS – Science and Technology Publications, Lda. All rights reserved

ons (Gao et a l., 2010; Nicodemus et al., 2013; Gi-
bert et al., 2017 ). The gap between the plausible high
number of ep istatic interactions existing in genomes
and the limited numbe r of results published may be
explained by the computational challenge posed by
epistasis detection. Moreover, loss-of-function muta-
tions that occur de novo or persist within popula tions
at low frequencies are known to significantly a lter epi-
static interactions (Mu llis et al., 2018).
In the r emainder of this article, a c ombination of
SNPs that interact to determine a phenotype is called
an interaction. A k-way interaction is a combina tion
of k interacting SNPs. A 2-way interaction will a lso
be called a gene -gene interaction (with SNPs either in
exons or introns).
A key motivation for the large-scale compa rative
study reported in this paper lies in the following ob-
servation: we miss feedback about the respective be-
haviors of methods designed to implement GWASs
on real-world data. This observation extends to Ge-
netic Association Interaction Studies (GAISs), and a
fortiori to genome-wide AIS (GWAISs). This paper
contributes to fill this lack. Another strong m otiva-
tion for our work was to analyze how SMMB-ACO
(Sinoquet and Niel, 2018), a method proposed most
recently, comp ares with other approaches, on real
GWAIS data. The remainder o f the paper is organized
as follows. Section 2 presents a succinct overwiew of
the rece nt state-of-the-art. Section 3 provides the mo-
tivations for our study. Section 4 depicts the five me-
thods involved in our study, in a bro ad-brush way for
the four reference meth ods chosen, and in more de-
tails for the recently developed SMMB-ACO. Section
5 focuses on the experimental protocol, the real-world
datasets analyzed, the implementation and p a rameter
adjustement of the five methods. The experimental
results, discussion and feedback gained are presented
in the last section.
2 RELATED WORK
Performing a G AIS is challenging. In th e category
of statistical approaches, multivariable multiplica-
tive linear regression (MMLR) offers a fr a mework to
model the relationship between a continuous variable
of interest (outcome) y and multiple interacting pre-
dictors x
1
, x
2
, ..., x
q
(continuous or categorical), such
as in y ∼β
0
+ β
1
x
1
+ β
2
x
2
+ β
12
x
1
x
2
, with q = 2. In
MMLR, interaction terms allow to escape from the
pure linear scheme (y ∼ β
0
+ β
1
x
1
+ β
2
x
2
). One
step further, linear generalized regression (LGR)
provides a way to model an outcome that is not li-
nearly determined by predictors: for th is purpose, a
link function f is used to transform the outcome y,
to match the real distribution of y. Besides, simi-
larly as for MMLR, interaction coefficients may be
specified for LGR. For example, the LGR model to
adjust in the case of two interacting predictors wri-
tes: f (y) ∼ β
0
+ β
1
x
1
+ β
2
x
2
+ β
12
x
1
x
2
. Obviously,
MMLR and LGR cannot be used to analyze data on
a genome scale, because of the combina torial issue
posed by the enumeration of combinations of q pre-
dictors, with 2 ≤ q ≤ r, and upper bound r ar bitra-
rily set by the user. Moreover, ide ntifying an appro-
priate link function f in LG R may not b e trivial. To
note, logistic regression (LR) is a specific case of
LGR where the link function is known, and allows
to model a binary outcome. Typically, in case con-
trol association studies, with p representing the pro-
bability to be affected by the pathology of interest,
a LR m odel with two inte racting predictors writes:
logit(p) = ln(
p
1−p
) = β
0
+ β
1
x
1
+ β
2
x
2
+ β
12
x
1
x
2
.
We will further specif y to which aim and how LR is
used in the c omparative study repo rted h e re. Appro-
aches in the line of multifactor-dimensionality re-
duction (MDR) are also compelled to test all combi-
nations of q SNPs, and also fail to handle GWAS data
unless GPU calculation is used (Gola et al., 2016).
The high dimensionality of GWAS data ad vocates
the de sig n of (supervised) machine learning and data
mining approaches to tackle the p roblem of epistasis
detection. A direct way to reduce the search space is
to decrease the da ta dimensionality. Relief-based ap-
proaches (RBAs), random forests a nd penalized re-
gression are three major feature selection techniques
used in epistasis detection.
Algorithms in the line of Relief first compute (ge-
netical) similarities between individuals; a nearest
neighbor-based technique then allows to assess im-
portance s for SNPs with regard to the phenotype of
interest (see (Urbanowicz et al., 2018) for a recent
review). Not to speak of the bias induced by the
pre-selection of SNPs marginally associated with the
pheno type, the computation of pairwise similarities is
prohibitively expensive.
A random forest (RF) is a set of decision tr e es
grown from bootstrap samples of observations. At
each node, a ra ndom subset of K predictors is used
to determine the optimal split. The optimal split is the
one that decreases the most node impurity for a clas-
sification tree (respe ctively the sum of squared errors
for a regression tree) af te r the split. RFs applied to
GWAS data produce a ranking of the markers, by de-
creasing importance measu res (Schwarz et al., 20 10;
Yoshida a nd Koike, 2011). Until the 2010s, RF lear-
ning was computationally and memory inefficient in
high-dimensional settings. The fast implemen ta tion
Detection of Gene-gene Interactions: Methodological Comparison on Real-World Data and Insights on Synergy between Methods
31

of ra ndom forests for high-dimension al data provided
via ranger is one of the software programs included in
our comparative study.
RBAs and RFs both allow to rank an d select top
scoring SNPs. In the epistasis detection context, a
proced ure is require d downstream RBAs and RFs, to
generate gene-gene interactions. This procedure may
consist in statistical tests such as regression, or may
be a specific ap proach dedicated to epistasis detection
(e.g., (Lin et al., 2012)).
In contra st, p enalized regression (PR) such as re-
gularized feature selection through Lasso, Ridge or
Elastic Net regression can be used to directly outpu t
gene-g e ne interactions (Ayers and Co rdell, 2010). A
promin ent downfall of these methods is the prohibi-
tive runnin g time. The meth od reported in (Chang
et al., 2018) copes with high data dimensionality
through a two-stage procedure: 2-way interactions
are first d etected within genes using Randomized
Lasso and penalized Logistic Regression (RLLR);
then, considering the list of SNPs obtained from the
latter 2-way interactions, any combination of such
two SNPs is tested using again RLLR, to identify
cross-gene epistasis. The biological motivation for
this kind of dimensionality reductio n is questionable
since the 2-way interactions within the genes are not
kept.
In the pan e l of standard su pervised mac hine lear-
ning and data m ining techniques, support vector
machines (SVMs) an d artificial neural networks
(ANNs) can b e used directly for epistasis detection.
To this aim, SVMs separate interacting and non-
interacting combinations of SNPs using a hyper plane
in multi-dimensional space (e.g., (Shen et al., 2012)).
ANNs allow to model non-linear feature interac tions
through network connections. The recent revolution
in training feedfo rward networks with many hidden
layers through advanced stocha stic gradient descent
open a path for deep neural networks (DNNs). Ho-
wever, the DNN used in (Uppu et al., 2016) was le-
arned from small datasets (no more than 1,600 indi-
viduals, a few tens of SNPs). In the still more recent
work rep orted in (Fergus e t al., 2018), logistic regres-
sion was employed to pre-select around 5,000 SNPs
to fit a deep learning model (1,500 sub je cts). Baye-
sian neural networks (BNNs) merge an ANN with a
probabilistic model. Notably, this allows the quantifi-
cation of variable influence with incertainty measures.
In (Beam et al., 2014), BNNS were used to detect epi-
static interactions on a relatively limited scale (around
a hundred individuals described by 60,000 SNPs).
Bayesian networks (BNs) allow to model de-
pendences be twe en variables in an uncertain con-
text. Therefore BNs offer an appealing framework for
gene-g e ne intera ction dete c tion, to discover the best
scoring graph structure connecting SNPs to the varia-
ble of interest. The b ranch and bound heuristic used
in (Han and Chen, 2011) allowed to p rocess a relati-
vely limited dataset, a published AMD (Age Macular
Degenerated) dataset, which describes around 150 in-
dividuals for about 110,000 SNPs. In (Jiang et al. ,
2010), a greedy search performing a forward phase
(edge addition) followed by a backward ph a se (e dge
removal) is applied. However, for tractability reasons,
the process starts including one pair of interacting
SNPs exerting a marginal effect on the phen otype,
thus addressing a specific case of epistasis called em-
bedded epistasis. In the BN framework, feature sub-
set selection stated as Markov bla nket learning is
another line of investigation. In a BN built over the
variables of a dataset V , the Markov Blanket (MB)
of a target variable T , MB(T ), is defined as a mini-
mal set of variables that renders any variable outside
MB(T ) probabistically independent of T , conditional
on MB(T ). Typically, a MB of the phenotype is a set
of interacting SNPs able to d etermine the phenotype.
Thus, instead of learning a whole BN as abovementi-
oned, algorithms were designed to learn the Markov
blanket of a given ph e notype of interest. However,
in high-dimensional settings, the complexity of MB
learning remains challenging. FEPI- MB (Fast epista-
tic interactions detection using Markov blanket) (Han
et al., 2011) and DASSO-MB (Detection of ASSOci-
ations using Mar kov Blanket) (Han et al., 2010) were
able to process the AMD dataset previously me ntio-
ned.
Bayesian inference is employed by the popu-
lar BEAM algorithm (Bayesian Epistasis Association
Mapping) (Zhang and Liu, 2007). BEAM partitions
SNPs into three groups: SNPs with a marginal effect
on the phenotype, SNPs that jointly contribute to the
pheno type, and background SNPs. A Markov chain
Monte Carlo (MCMC) process exploits Bayes theory
to partition the SNPs into these three groups. Data-
sets with half a million of SNPs could be processed
by BEAM, at the c ost of high running times (up to a
week and even more).
Other approaches, derived from the optimization
field, have been proposed to search the space of com-
binations of SNPs. The method reported in (Aflakpa-
rast et al., 2014) combines Bayesian scoring with an
evolutionary-based heuristic approach; it allowed to
process around 1,400 sub je ts and 300,000 SNPs. Ant
colony optimiza tion (ACO) was exploited by several
proposals. AntEpiSeeker, a w idely cited reference,
relies on the straightforward adapta tion of classical
ACO to epistasis detection (Wang et al., 2010), and is
tractable on the genome scale. The objective to max-
BIOINFORMATICS 2019 - 10th International Conference on Bioinformatics Models, Methods and Algorithms
32

imize in AntEpiSeeker is the χ
2
statistics o f the test
of d ependen ce between a group of SNPs and the phe-
notype. The method d escribed in (Sun et al., 201 7)
seeks to optimize an objective combining the mutual
informa tion measure with a BN-based score, and was
able to process the AMD dataset abovecited. Multi-
objective ACO optimization was also prop osed, in
which the Akaike informatio n criterion (AIC) score
and a BN-derived score must be optimized (Jing and
Shen, 2015). The computational burden limited the
analysis to sepa rate chromosome datasets.
3 MOTIVATIONS FOR THE
STUDY
In light of the literatur e published on the subject, we
can draw a number of remarks about the evaluation
and comparison of methods developed to cope with
epistasis detection. First, to evaluate the performance
of a method, multiple datasets (for instance 100) must
be generated under some c ontrolled (i. e., simulated)
condition. To generate statistics for this condition,
a performance measure (e.g., power, F-measure, f or
example) must be computed for each dataset. As this
performance measure is a fun ction of true positives,
false positives and false negatives, its computation re-
quires that multiple executions (for instance, 100) of
the same stochastic method be achieved for each si-
mulated data set. Thus, for tractability re asons, simu-
lations on the genome scale are only accessible to cen-
tres with outstanding intensive computing and storage
resources (e.g., (Chatelain et al., 2018)), and the over-
whelming ma jority of stu dies still compare me thods
on simulated datasets describing 100 SNPs (and a few
thousand observations). It fo llows that the methods
are compared, and subsequent conclusions drawn, in
conditions tha t in no way reflect the real-world situa-
tion of GWAS analyses.
Second, for the same tractability re asons, publi-
cations analyze the method they propo se o n a single
GWAS dataset but never perform comparisons with
other meth ods on G WAS datasets. On the one hand,
comparing several me thods requires auth ors to ad-
just parameters for methods they did not develop and
do not always know well. For tho se approaches that
rely on supervised machine learning, parameter ad-
justment means running 10 time s the meth od (in a
10-fold cross-validation scheme) under each instanti-
ation (from a grid of instantiations) of the set of para-
meters. The computational burden is therefore prohi-
bitive. On the other hand, the same parameter ad jus-
tment issue arises fo r optimization-based approach e s.
Besides, the latter methods generally output several
solutions and this number of such solutions may vary
across the grid of instantiations. Thus, it is not straig-
htforward to assign a score to su ch outputs, which im-
pedes the ability to rank instantiations.
Third, in publications focused on a novel method,
running times are but exceptionally reported for exe-
cutions on simulated datasets, as well as for execu-
tions on real GWAS datasets. Moreover, when a pu-
blication compares a novel method with other me-
thods, the comparison of running times across me-
thods is practically always missing.
Fourth, so far, no extensive AIS analysis was de-
signed to provide interactions jointly ide ntified by se-
veral approaches, with the aim of gener ating a short
list for further biological validation.
The works reported in this paper were designed
with th e previous four points in mind. Fina lly, another
strong motivation for our work was to analyz e how
SMMB-ACO (Sinoquet a nd Niel, 2018), a method
proposed most recently, compares with state-of-the-
art approaches, on real data.
4 THE FIVE APPROACHES
COMPARED
The four state-of-the-art appr oaches selected fall into
various categories: rando m forest, Bayesian infe-
rence, ant colony optimization, Markov blanket lear-
ning. The newly developed SMMB-ACO method
combines Markov blanket learning with ant colony
optimization.
So far, any novel method proposed was gene-
rally compared to Random Jungle (Schwarz e t al.,
2010). We there fore selected ranger, the successor
of Random Jungle, which is a fast implementation
of random forests to handle high-dimensiona l data
(Wright and Ziegler, 2017).
Also a reference for epistasis detection, BEAM3
(Zhang, 2012), the successor of BEAM (Zhang and
Liu, 2007), was incorporated in our study. Simi-
larly as BEAM, BEAM3 employs a MCMC search
technique to probabilistically assign SNPs to three
groups (backgro und, marginal dependence with the
pheno type, involvment in an interaction). Moreo-
ver, the MCMC simulation allows to assign a sta-
tistical significance to each SNP, thus avoiding cos-
tly permutation-based tests. A major difference with
BEAM is that BEAM3 detects flexible interac tion
structures using disea se grap hs. Besides, BEAM3 dy-
namically accounts for the unknown linkage disequi-
librium (LD ) among SNPs. LD is defined as the net-
work of dependences that exists among gene tic data,
as the result of evolutionary events. The aim is to fil-
Detection of Gene-gene Interactions: Methodological Comparison on Real-World Data and Insights on Synergy between Methods
33

ter ou t the secondary associations due to LD: secon -
dary associations will not be admitted in the disease
graph when better candidates are already present. On
the one hand, the comp lexity of the disease graph is
reduced. On the other han d, it is expected that the pri-
mary disease associations are reported with improved
resolution. BEAM3 was able to process around 4,700
subjects described by about 400,000 SNPs.
AntEpiSeeker (Wang et al., 2010), a r e ference in
epistatis detection , is the third meth od considered in
our study. In each iteration of AntEpiSeeker, ants
each select a SNP set o f user-defined size from the
initial dataset, according to a probability distribution
P, and calculate a χ
2
statistics to assess the depen-
dence strength with the phenotype. Feedback on the
learning process is memorized through the so-called
pheromone levels, based on the χ
2
statistics. The
SNP sets with the highest χ
2
statistics ar e recorded.
The probability distribution P is updated based on
the pheromone levels following the standard ACO
scheme. At the end of the iter ations, a user-specified
number of best SNP sets is ava ilable, together with a
list L of top SNPs ranked by decr easing pheromone
levels. Finally, in a post-processing p hase, each best
set S is examined: if the size of the interac tions to be
uncovered is q, the subsets of S of size q whose SNPs
are all in L are kept as solutions. To note, the false po-
sitive issue is addressed as fo llows: if two interactions
overlap, the one with the smaller p-value is kept.
FEPI-MB ( Han et al., 2011) and DA SSO- MB
(Han et al., 2010) are two determin istic algorithms
that tackle epistasis detection thro ugh feature subset
selection based on Markov blanket lear ning. The key
ingredients in these two algorithms are the forward
and backward ph a ses. In a forward step, a SNP is ad-
ded to the growing MB provided it is the candidate
SNP most dependent with the phenotype, conditiona l
on the MB, and tha t this dependence is statistically
significant. Co nversely, a b ackward phase successi-
vely examines a ll SNPs belonging to the current MB;
each such SNP is r emoved fro m the MB based on (sta-
tistically significant) conditional independence. We
chose DASSO-MB, whose backward p hase is more
elaborate than in FEPI-MB: FEPI-MB removes a SNP
if it is shown significantly independent conditional on
the current MB; in contrast, DASSO-MB discards a
SNP as soon as it shown independent with the phe-
notype, conditional of a subset of the current MB. In-
deed, such a subset cou ld be the MB to be discovered.
Finally, at the crossroads of machine learning and
optimization, the fifth metho d retained in our study
is SMM B-ACO (Stochastic Multiple Markov Blan-
kets with Ant Colony Optimization) (Sinoqu et and
Niel, 2018). SMMB-ACO is an hybrid approach
that combines Markov blanket construction with sto-
chastic and ensemble features. To address the issue
of scalability in high-dime nsional settings, SMMB-
ACO re lies on a heuristic desig ned to search prom i-
sing areas of the search space.
In each iteration of SMMB-ACO, several ants
each learn a subo ptimal Markov blanket fro m a subset
of SNPs sampled from the in itial set. The MB lear-
ning performed by each ant r uns a forward phase in-
tertwined with b ackward phases. In this respect, MB
learning in SMMB-ACO is similar to that in DASSO-
MB. However, a genuine difference in the SMMB-
ACO and DASSO-MB forward steps is the following:
SMMB-ACO stochastically adds a group of SNPs as-
sociated with the phenotype, whereas DASSO-MB
incorporates the SNP most associated with the phe-
notype. The two MB learning algorithms are de scri-
bed and co mmented in Figures 1 (a) and (b). The sto-
chastic featu re of SMMB-ACO relies on SNP sam-
pling, following a probability distribution P updated
based on pheromone levels. It is possible to spe-
cify a specific operatin g mod e for SMMB-ACO, to
cope with high-dimensional data: a two-pa ss process
is then triggered. Figu res 1 ( c) and (d) ou tline this
process.
5 EXPERIMENTAL SETTING
We first present the experimental protocol. Then, the
real-world datasets used are briefly described. Third,
we focu s on implementation aspects. This section
ends with co nsiderations about the parameter adjus-
tment of the approac hes compared.
5.1 Experimental Protocol
We consider SNPs coded on 0, 1 and 2 to respecti-
vely denote major homoz ygous, heterozygous and
minor homozyg ous, where the allele with minor fre-
quency is the disease susceptibility a llele. We call in-
teraction of interest (IoI) any 2-way interaction for
which logistic regression (y ∼ β
0
+ β
1
x
1
+ β
2
x
2
+
β
12
x
1
x
2
) provides a significant p-value for the inte-
raction coefficient β
12
, given some specific signifi-
cance th reshold. As highlighted previously, the RF-
based ap proach ranger can only tackle feature se-
lection. Downstream ranger’s execution, we thus
generated C
2
20
2-way interaction s fr om the selection
of 20 SNPs with the highest importance measures.
Then we selected the IoIs at significance threshold
5 ×10
−4
. To put all approaches on the same foot-
ing for the compar ison, we filtered out the outputs of
BEAM3, AntEpiSeeker and DASSO-MB a nd adap-
BIOINFORMATICS 2019 - 10th International Conference on Bioinformatics Models, Methods and Algorithms
34
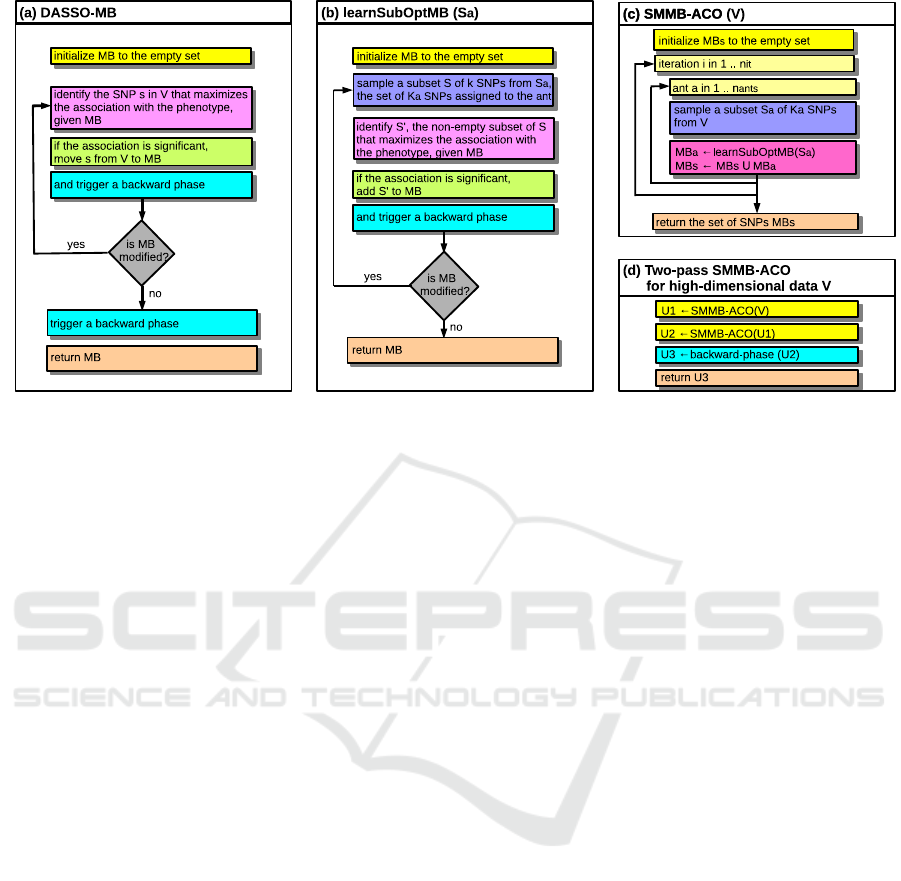
Figure 1: Sketches of the DASSO-MB and SMMB-ACO algorithms. (a) DASSO-MB. (b) SMMB-ACO stochastic procedure
to learn a suboptimal Markov blanket. (c) and (d) Two-pass SMMB-ACO algorithm adapted to high-dimensional data. MB:
Markov blanket. V is the initial set of SN Ps. (a) Incorporating SNPs one at a time as in DASSO-MB hampers the epistasis
detection process: since the independence test achieved at first iteration is conditioned on the empty Markov blanket (MB),
a SNP marginally dependent with the phenotype is incorporated from the outset, which biases the whole MB learning. (b)
Instead, SMMB-ACO addresses this issue by including groups of SNPs. To this aim, each forward step starts with the
sampling of a set S of k SNPs, from the subset S
a
of size K
a
that is assigned to the ant that is driving the learning of the
suboptimal MB. For each non-empty subset S
′
of S, a score is computed, that assesses the association strength between S
′
and the phenotype, conditional on the growing Markov blanket MB. The subset S
′
with the highest association score is
incorporated into MB i f the association is statistically significant. (c) A f ter all iterations are completed, the set of SNPs
obtained as the union of all suboptimal MBs is returned. This set of SNPs is the set U
1
returned by the first pass of SMMB-
ACO (see (d)). (d) A second pass of SMMB-ACO is performed with U
1
as the input. This time, the resulting set U
2
is
submitted to a backward phase, to yield U
3
, a set of SNP s. To include SMMB-AC O in our experimental protocol, we
suppressed the post-processing phase of the native algorithm (Sinoquet and Niel, 2018), which outputs as an interaction any
suboptimal MB generated in (b) provided it is contained in the set U
3
obtained in (d). In our protocol, for reasons detailed in
subsections 5.1 and 5.4 (last paragraph), the post-processing phase of SMMB-ACO consisted in the generation of interactions
of interest (IoIs), as defined in subsection 5.1, from set U
3
.
ted the post-processing in SMMB-ACO to keep only
IoIs at significance threshold 5 ×10
−2
. The thorough
justification for the use of two significance thresholds
will be provided in subsection 5.4.
In this comparative analysis, DASSO-MB is the
only deterministic appro ach. Each other (stochastic)
method was run 10 times on each dataset.
To no te , generating all 2-way interactions from a
set of t SNPs and assessing their dependence with the
pheno type through logistic regression may be compu-
tationally expensive (e.g., 30 h ours if t = 20 SNPs).
This result shows the n e cessity to u se ad vanced m e-
thods for datasets scaling in tens of thousands of
SNPs, as is the case in this study.
5.2 Real-World Datasets
We used the genome-wide data related to Crohn’s
disease (CD) provided by the Wellcome Trust
Case Control Consortium (WTCCC, https://www.
wtccc.org.uk/). Major pathways involved in Crohn’s
disease have emerged from standard single -SNP
GWASs (Graham and Xavier, 2013). This back-
ground motivated our ch oice to analyze the WTCCC
dataset related to Crohn’s disease. Using the cohort
of cases affected by CD and two cohorts o f unaffected
(controls) provide d by the WTCCC, we generated 23
datasets r elated to the 23 hu man chromosomes. We
applied the quality control procedure specified by the
WTCCC to ea ch dataset. In particular, this procedu re
dismisses SNPs having more than 1% of missing data
and subjects having more than 5% of missing data ,
and checks for the so-called Hardy-Weinberg equi-
librium at 5.7 ×10
−7
threshold. After quality cont-
rol, the size of the population of cases and contro ls is
4, 686 (1,748 affected; 2,938 unaffected). The statis-
tics about the numbe r of SNPs per dataset are as fol-
lows: the average is 20, 236; the minimum and maxi-
mum are 5, 707 and 38, 730, respectively. Finally, we
imputed data using a k-nearest neighbor proced ure, in
which the missing variant of subject s is assigned the
variant most frequent in the nearest neighbors of s.
Detection of Gene-gene Interactions: Methodological Comparison on Real-World Data and Insights on Synergy between Methods
35

Table 1: Implementations for the five software programs used in the comparative study.
ranger http://dx.doi.org/10.18637/jss.v077.i01
BEAM3 http://www.mybiosoftware.com/beam-3-disease-association-mapping.html
AntEpiSeeker http://nce.ads.uga.edu/ romdhane/AntEpiSeeker/index.html
DASSO-MB not distributed by its authors, reimplemented
SMMB-ACO https://ls2n.fr/listelogicielsequipe/DUKe/130/SMMB-ACO
5.3 Implementation of the Comparative
Study
Except for DASSO-MB, all approaches are available
on the Internet (Table 1) ; they are coded in C++. We
recoded DASSO-MB in C++. The extensiveness of
our compara tive study required intensive computing
resources from the Tier 2 CCIPL data centre (Inten-
sive Comp uting Centre of the Pays de la Loire Re-
gion) (Intel 2630v4, 2 ×10 co res 2,2 Ghz, 20×6 GB).
We exploited the OpenMP intrinsical parallelization
of the C++ implementation s of ranger, BEAM3 and
SMMB-ACO. We also exploited data-driven paralle-
lization to run each stochastic method 1 0 times on
each dataset. Because of the heterogeneity of the run-
ning times across the methods and of memory shor-
tage events, we had to balance the workload distri-
bution be twe en (i) sequentially processing 23 chro-
mosome datasets for one method on one node (pro-
cess
23Chrs 1) and repeating this job 9 times (on ot-
her nodes), and (ii) processing a single chromosome
dataset 10 times for one method on one node (pro-
cess
1Chr 10) and repeating this job for the remai-
ning chromosomes (on other nodes). In the case of the
parallelized software progra ms ranger, BEAM3 and
SMMB-ACO, the 20 cores of a given node were em-
ployed in parallel. We managed th e workload using
the three following modalities: short, me dium and
long, for expected ca lc ulation dur a tions respectively
below 1, 5 and 30 days. When a timeout occur red
in a node, depending on the degree of com pletion of
the job, we either switched to a modality with higher
time limit (proce ss
23Chrs 1) or to a chromosome by
chromosome management (process 1 Ch r 10). In to-
tal, we per formed 1,035 ch romosom e-wide analyses.
5.4 Parameter Adjustment
Most machine learning me thods re quire the tuning of
a number of parameters. Table 6 in Appendix recapi-
tulates the main parameters of the software programs
used in our study.
The software program ranger was specifically d e -
signed by its authors to handle high-dimensional data.
Throu gh a complementary study (results not shown),
we tried various values of m try between
√
n and n, the
total number of SNPs. On the d atasets concerned, the
optimal value is shown to be
5
8
n.
To set th e value of the product number of iterati-
ons × number of ants in AntEpiSeeker while attemp-
ting to diminish the large number of interactions out-
put by this method, we conducted a preliminary study.
In this preliminary study, the number of iter ations was
kept to AntEpiSeeker default value (450). We varied
the number of ants between 500 and 5,0 00 (step 500).
We observed that using 1,000 ants, we could control
the total number of interactions reported to less than
15,000. while still guaranteeing a coverage of 10 for
each SNP in the largest chromoso me-wide dataset.
We set the numbers of iterations of the burn-in and
stationary phases of BEAM3, following the r e com-
mendation of its author.
DASSO-MB’s unique parameter is a type I error
threshold, a nd its adjustm e nt is straightforward.
For a fair comparison, in theory, one would set the
product n
it
×n
ants
(number of ACO iterations × num-
ber o f ants) in SMMB-ACO to the value chosen for
AntEpiSeeker. However, two points must be taken
into account. First, AntEpiSeeker software program
is not parallelized, whereas SMMB-ACO is: during
each of the n
it
SMMB-ACO iterations, n
ants
Markov
blankets are learned in parallel. Second, the comple-
xities of an iteration in AntEpiSeeker and of an ite-
ration in SMMB-ACO are not comparable: in Ant-
EpiSeeker, each ant draws a set of SNPs and com-
putes the c orresponding χ
2
statistic; in SMMB-ACO,
each ant grows a Markov blanket via a forward phase
intertwined with full bac kward phases. We adju s-
ted SMMB-ACO parameters n
it
, n
ants
and K
a
(num-
ber of SNPs drawn by ea c h ant), in order to gua-
rantee in theory that each SNP of the initial dataset
would be drawn a sufficient numb e r of times in the
scope of a single run. With the parameter setting
(n
it
, n
ants
, K
a
) = (360, 20, 160), we expect a coverage
of 30 for the largest datasets, in a single run. We recall
that 10 runs are perform ed for each stoc hastic method.
A type I error threshold is used for the indepen-
dence tests in AntEpiSeeker, and for the conditio-
nal independence tests in DASSO-MB and SMMB-
ACO. The common value choosen was 5 ×10
−4
. It
is common to the thr eshold fixed for the logistic re -
gression used downstream ranger execution. A less
stringent threshold of 5 ×10
−2
was used for the lo-
gistic regressions performed in the filtering stages do-
wnstream BEAM3 , AntEpiSeeker and DASSO-MB
executions as well as in the post-pro c essing stage in
BIOINFORMATICS 2019 - 10th International Conference on Bioinformatics Models, Methods and Algorithms
36
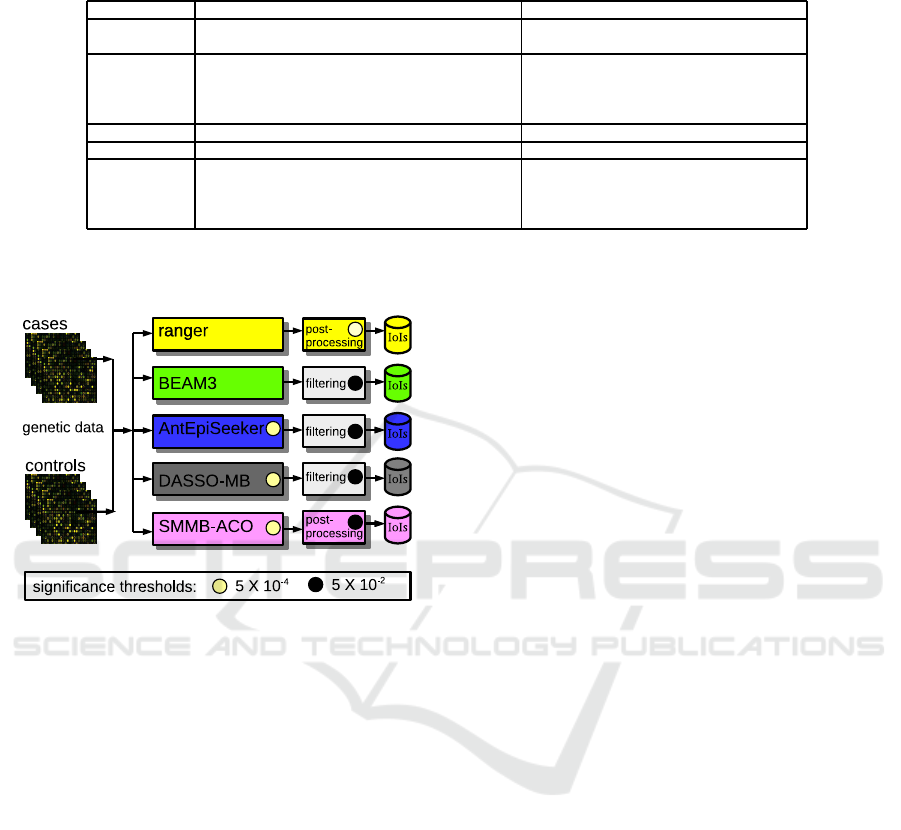
Table 2: Orders of magnitude of the running times and memory occupancies for the five software programs used. Otherwise
stated, the average running time indicated is computed from t he 23 chromosome datasets (ten executions for each dataset).
Method Average running time Memory occupancy
ranger
feature selection: 14 ± 7 mn 2 ± 0.6 GB
post-processing: 60 ± 20 mn
BEAM3
extremely volatile across the chromosome datasets 79 ± 46 GB
Chr7 to C hr23: 54 ± 66 s
Chr6: 22.4 ± 1.5 h
Chr1 to C hr5: above 8 days
AntEpiSeeker 16 ± 3 mn 0.5 ± 0.2 GB
DASSO-MB 82 ± 22 s 1.5 ± 0.7 GB
SMMB-ACO
extremely volatile across the chromosome datasets 43 ± 17 GB, extremely volatile even across
30 ± 17 mn (average on shortest executions) the 10 executions on a given chromosome
otherwise, up to 3 days, with large variations dataset; many execution abortions due
to memory limitation (120 G B)
SMMB-ACO. A recapitulation is provided in Figure
2.
Figure 2: Flow diagram for the comparative analysis.
6 RESULTS AND DISCUSSION
We first com pare running times and memory occu-
pancies across the five approaches. Then we compare
the numbers of intera ctions of inte rest (IoIs) identi-
fied by the five methods and analyze the distributions
of p-values and odds ratios obtain ed. Third, we focus
on the IoIs jointly identified by several methods. This
section ends with a discussion.
6.1 Running Times and Memory
Occupancies
There are salient features to draw from Table 2.
DASSO-MB is the software program both much
faster and far less greedy in memory than its com-
petitors. AntEpiSeeker is remarka ble in that it
shows a low run ning tim e across all chromosomes.
The quickness of ranger is further impeded by the
exhaustive test of 2-way interactions performed do-
wnstream. The behaviors of BEAM3 and SMMB-
ACO are both extremely volatile across the d atasets,
for various reasons. In SMMB-ACO, the stochastic
feature translates in th e g reat heterogeneity of me-
mory occupancy, possibly up to memory shortage,
even for short chromosomes. In around the third of
the datasets, it was nec essary to launch additional runs
(up to 5), to obtain the 10 runs required by our pro-
tocol. Nevertheless, the processing of all chromoso-
mes remains feasible within 5 days, on 10 nodes. In
contrast, we experienced timeouts with BEAM3, for
the 5 largest chromosomes. In these cases, we were
compelled to specify large timeouts (30 days), with
the consequence of longer waiting times, to guarantee
that executions demanding more tha n 8 days cou ld
be completed. Despite these prohibitive running ti-
mes, BEAM3, the program most greedy in memory
on average for the datasets considered, never ran out
of memory.
6.2 Interactions of Interest Identified
Numbers of Interactions of Interest. Table 3 high-
lights contrasts between th e methods. First, with only
18 in te ractions, it was nearly expected that DASSO-
MB would not de te c t I oIs. In the remainder of this ar-
ticle, we will not mention DASSO-MB anymore. Se-
cond, a salient feature is the great heterogeneity in the
numbers of IoIs dete cted by the fou r other methods.
These numbers scale in a ten thousands, a thousand,
a hundr e d an d a few tens for AntE piSeeker, SMMB-
ACO, BEAM3 and ranger respe ctively.
Figure 3 focuses on the distribution of IoIs across
the chromosomes. A first conclusion is that a sharp
contrast exists between AntEpiSee ker and SMMB-
ACO, whose IoIs are abundantly present in nearly all
chromosomes, and BEAM3 and ranger, whose IoIs
are confined to 10 and 5 chromosomes respectively.
Besides, th e number of IoIs in BEAM 3, aroun d four
times higher than in range r, is c ircumbscribed to a
number of chromosomes th at is two times less than
for ranger.
Detection of Gene-gene Interactions: Methodological Comparison on Real-World Data and Insights on Synergy between Methods
37
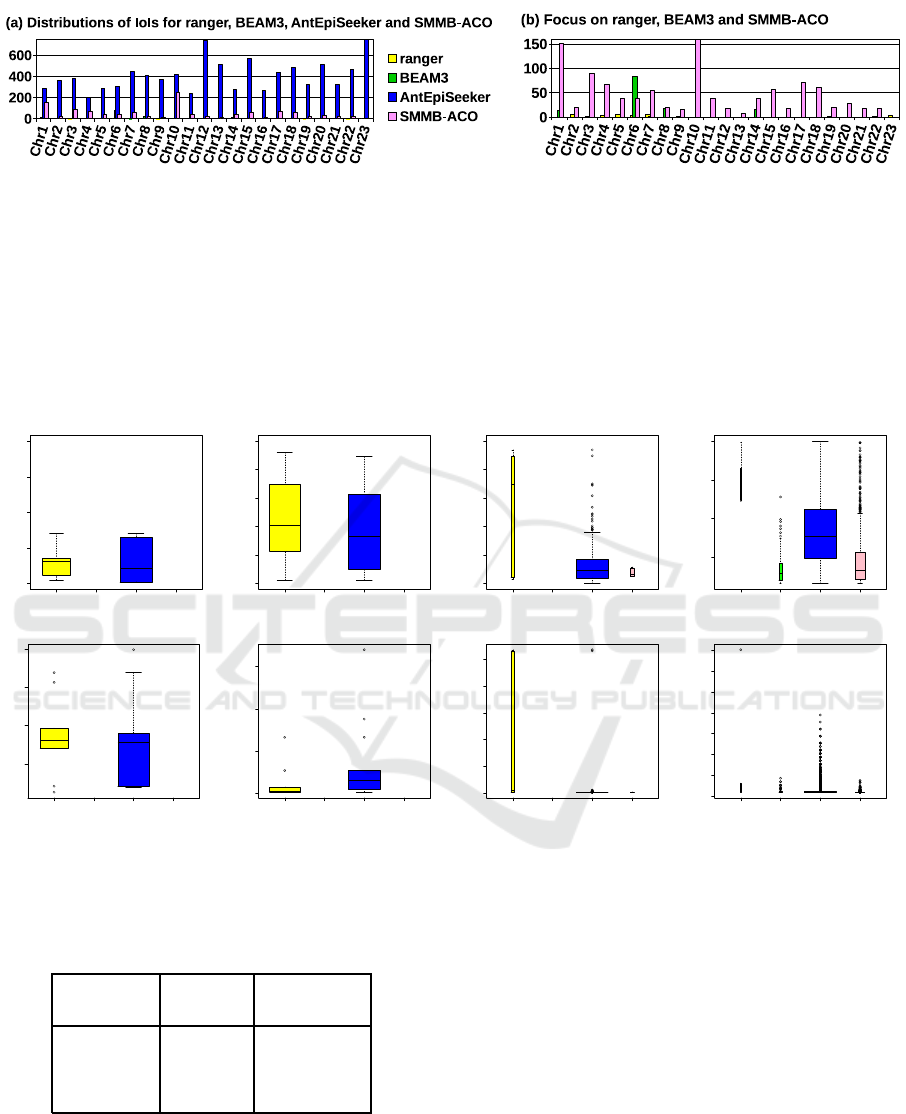
Figure 3: Comparison of the distributions of interactions of interest detected wit h ranger, BEAM3, AntEpiSeeker and SMMB-
ACO. AntEpiSeeker detected 13,062 IoIs which are spread over the 23 chromosomes ( small est number of IoIs for a chromo-
some: 202; median number: 380). Moreover, IoIs are overly abundant in chromosome X, whose presence is not known to bias
Crohn’s disease onset (4,427 IoIs representing 34.9% of AntEpiSeeker’s IoIs; the corresponding bar is truncated in subfigure
(a)). These observations comfort the hypothesis of a high rate of false positives. SMMB-ACO identified 1,142 IoIs distributed
across all chromosomes except chromosome X (smallest number of IoIs for a chromosome: 8; median number 38; largest
number: 251; the corresponding bar (Chr10) is truncated in subfigure (b)). In constrast, the 131 IoIs detected by BEAM3
are located within 5 chromosomes only, whereas the 34 IoIs identified by ranger are distributed across 10 chromosomes. As
regards BEAM3, Chr1, Chr6, Chr7, Chr8 and Chr14 respectively harbour 13, 83, 2, 18 and 15 IoIs. The IoIs detected by
ranger are located on Chr2 to Chr7, Chr9, Chr19, Chr22 and Chr23 (minimum number of IoIs for these 10 chromosomes: 1;
maximum number: 6).
R B A S
20
40
60
80
100
(a1) −log(p−val) >= 20
R B A S
10
12
14
16
18
20
(b1) 10 <= −log(p−val) < 20
R B A S
5
6
7
8
9
10
(c1) 5 <= −log(p−val) < 10
R B A S
2
3
4
5
(d1) 1.5 <= −log(p−val) < 5
R B A S
10
20
30
40
(a2) odds ratio
R B A S
0
50
100
150
(b2) odds ratio
R B A S
0
50
100
150
200
250
(c2) odds ratio
R B A S
0
10
20
30
40
50
60
70
(d2) odds ratio
Figure 4: Distributions of p-values and odds ratios for the interactions of interest detected with ranger, BEAM3, AntEpiSeeker
and SMMB-ACO. IoIs: interactions of interest. R: ranger. B: BEAM3. A: AntEpiSeeker. S: SMMB-ACO. Each subfigure
(x2) shows the distr ibution of odds ratios for the IoIs whose p-values fall into subfigure (x1). −log
10
(5 ×10
−2
) = 1.5.
Table 3: Comparison of the numbers of interactions de-
tected with the five approaches.
Number of Number of
interactions interactions of
identified interest (IoIs)
ranger 34 (34) (100%)
BEAM3 1,082 131 (12.1%)
AntEpiSeeker 14,670 13,062 (89.0%)
DASSO-MB 18 0
SMMB-ACO 6,346 1,142 (18.0%)
Distributions of P-values and Odds Ratios. The
subfigures 4 (a1) to (d1) and Table 4 allow to compare
the distributions of p-values observed for the IoIs. We
consider four intervals for the p-values. Again, a great
heteroge neity is observed across the methods. A first
remark is that AntEpiSeeker and ranger are the only
two methods to show p -values within the two first in-
tervals (i.e., below 10
−10
) (even down to 10
−50
for
some outliers in both methods). A second observation
is that ranger and AnEpiSeeker’s p-values spread over
whole third interval ]10
−10
, 10
−5
], whereas SMMB-
ACO’s lowest p-values ra nge in [10
−5.5
, 10
−5
]. In
contrast, BEAM3 is the only method whose 131 p-
values are all contained in the fou rth interval (a nd
are even confined to [10
−3.5
, 5 × 10
−2
]). Besides,
another discrepancy is evidenced: we have seen that
ranger and AntE piSeeker’s Io Is are distributed in all
four intervals; however, a sharp con trast exists bet-
ween these methods. Two thirds of the 34 ranger p-
BIOINFORMATICS 2019 - 10th International Conference on Bioinformatics Models, Methods and Algorithms
38
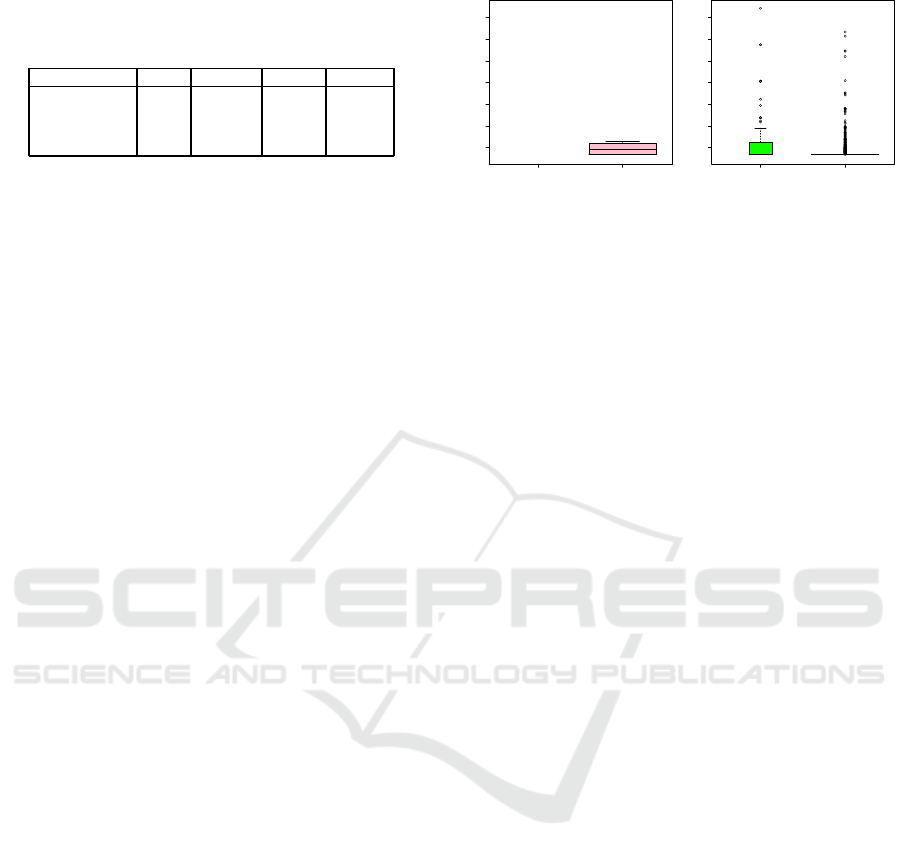
Table 4: Distributions of p-values for the interactions of
interest detected with ranger, BEAM3, AntEpiSeeker and
SMMB-ACO. Four significance intervals are shown for
−log
10
(p-value). −log
10
(5 ×10
−2
) = 1.5.
≥ 20 [ 10, 20[ [5, 10[ [1.5, 5[
ranger 10 12 6 6
BEAM3 0 0 0 131
AntEpiSeeker 13 13 458 12,578
SMMB-ACO 0 0 6 1,136
values are concentrated in the two first intervals, whe-
reas an overwhelming majority of the 13,062 AntEpi-
Seeker p-values are distributed in the third and fo urth
intervals, with a balance of 3.6% / 94.4% between
these intervals, respectively. In addition, it is now
clear that the statistical th reshold of 5 ×10
−4
in the
post-processing downstream ran ger is not a functio-
nal equivalent for the same statistical threshold used
by AntEpiSeeker, DASSO-MB and SMMB-ACO du-
ring their learning processes.
In parallel, subfigures 4 (a2) to ( d2) show the
distributions of odds ratios for the interaction coef-
ficients. In standard GWASs, SNPs with f requen-
cies between 1% and 5% exert effects of moderate
size, with odds ratios below 1.5, most often in range
[1.1,1.3], and up to 2.1 (Stadler et al., 2010). A few
publications document odds ratios for GWIASs. For
example, odds ratios in range [1.3,1.4] are reported in
(Li et al., 2018). Nevertheless, much higher odds r a-
tios may be reported, such as values betwee n 2 and 7,
and even up to around 12 in (Grange et al., 2015). If
we consider odds ra tios above 20 as outliers, ra nger
and AntEpiSeeker are the two only methods that pro-
vide such outliers. The higher number of outliers ob-
served for AntEpiSeeker can be explained by a much
higher nu mber of IoIs. In contr ast, the odds ratios
observed for BEAM3 and SMMB-ACO are all below
9 ( see Figure 5). Consistently with (Grange e t al.,
2015), we observe that outliers for odds ratios do not
necessarily coincide with outliers for p-values.
Interactions of Interest Jointly Identified by at Le-
ast Two Approaches. Beyond the methodological
compariso n on a real dataset, we wish to examine
whether IoIs were jointly outp ut by at least two appro-
aches. The fact that two methods whose core mecha-
nisms greatly differ identify common IoIs suggests
that the corresponding short list of IoIs could be tested
in priority by the biologists (Ritchie and Van Steen,
2018). None of the 131 IoIs id entified by BEAM3
is detected by another method. On the contrar y, 32
of the 34 IoIs dete cted by ranger were also detected
by AntEpiSeeker. AntEpiSeeker and SMMB-ACO
detected 16 common IoIs. SMMB-ACO and ranger
have only 3 IoIs in common. One IoI was jointly
BEAM3 SMMB−ACO
2
3
4
5
6
7
8
(c2) odds ratio
BEAM3 SMMB−ACO
2
3
4
5
6
7
8
(d2) odds ratio
Figure 5: Focus on subfigures 4 (c2) and (d2) showing the
distributions of odds ratios for BEAM3 and SMMB-ACO.
identified by AntEpiSeeker, ranger and SMMB-ACO.
Given the numbe r of interactions output by AntEpi-
Seeker, an overlap was expected between AntEpi-
Seeker and some other method. On the other hand,
our study indicates that the mechanisms behind Ant-
EpiSeeker and SMMB-ACO, which both use ACO,
explore different sets of solutions.
Biological Insights. Th e 56 IoIs jointly selected by
two or three methods are re la te d to 25 known ge-
nes. From these 56 I oIs, we could infer 11 inte-
raction networks: six of size 3 in Chr2, Chr5, Chr6,
Chr7 and Chr 19; four of size 4 in Chr3, Chr14, Chr16
and Chr17; and one of size 7 within Chr10. Besides
a number of standard single-SNP GWASs, the few
AISs devoted to CD focus on genes or pathways al-
ready known to contribute to the disease onset. It is
not a surprise that our stu dy highlig hts six genes al-
ready known to impact CD onset: NOD on Chr16,
CCNY and NKX2-3 on Chr10, LGALS9 and STAT3
on Chr17 , and SBNO2 on Chr19 (McGovern et al.,
2015; Khor et al., 2011). It was also expected that our
protocol designed for AIS investigation without prior
biological knowledge would detect novel interaction
candidates, which it does.
The network of size 7 is presented in Table 5. It
is related to 5 kn own genes. It is beyond the scope of
this study focused on methodolo gical and computati-
onal aspects, to bring deep e r biological insights on the
potential mechanisms involved in the networks a nd
IoIs.
6.3 Discussion
The presence of p-value and odds ra tio outliers is not
an issue in AntEpiSeeker, in regard to the large num-
ber of AntEpiSeeker IoIs. However, this presence in
the few ten IoIs output by ranger comforts the ne-
cessity to lower th e significance threshold used for
ranger down to the threshold used in filtering and
post-processing, for the other methods (in our case
Detection of Gene-gene Interactions: Methodological Comparison on Real-World Data and Insights on Synergy between Methods
39

Table 5: Network of 7 SNPs identified in chromosome
10. iv: intron variant; nctv: nc transcript variant; uv: up-
stream variant. LINC01475 (long intergenic non-protein
coding RNA 1475), related to nodes D, E and F in the in-
teraction network, is expressed in 7 tissues including colon,
small intestine, duodenum and appendix. NKX2-3, the ot-
her gene related to node F, is a member of the NKX family
of homeodomain-containing transcription factors; the lat-
ter are involved in many aspects of cell type specification
and maintenance of differentiated tissue f unctions. Node
A is related to CREM which encodes a transcription fac-
tor that binds to the cAMP responsive element found in
many cellular promoters. Alternative promoter and transla-
tion initiation site usage enables CREM to exert spatial and
temporal specificity in cAMP-mediated signal transduction.
This gene is broadly expressed (36 tissues including colon,
small intestine and appendix). Node B is related to CCNY.
As all cyclins, CCNY controls cell division cycles, regu-
lates cyclin-dependent kinases; it is ubiquitous (27 tissues).
Node G, CPXM2, a protein of the carboxypeptidase X, M14
family member 2, is broadly expressed in 21 ti ssues.
SNP location related gene function
identifier (bp)
A rs2505639 35185493 CREM iv
B
rs16935948 35260820 CCNY iv
rs3936503 35260329 CCNY iv
C
rs10761659 62685804 — —
rs10995271 62678726 — —
D
rs10883365 99528007 LINC01475 nctv
rs10883367 99528233 LINC01475 iv
E
rs1548964 99529896 LINC01475 iv
rs1548962 99529978 LINC01475 iv
rs6584283 99530544 LINC01475 iv
F
rs10883371 99532698 LINC01475 uv 2kb
NKX2-3
G
rs7067790 123917521 CPXM2 iv
rs17680424 123917559 CPXM2 iv
IoI p-val ue IoI p-val ue
AE 0.00358 CD 0.04767
BD 0.00112 CF 0.04386
BE 0.00115 CG 0.00624
CE 0.04267
5 ×10
−2
). We would expect a larger number o f IoIs
for ranger, and thus a lower proportion of IoIs with
extreme odds ratios or p-values.
On the CD dataset, DASSO-MB is of no help. The
verbose An tEpiSeeker pr ovided a wealth of results in
both a wide spectr um of p-values and of odds ratios.
SMMB-ACO neither provided outliers f or p-values or
odds ratios, but generated pla usible od ds r atios ( up to
9) and showed lowest p-values in the order of 10
−5.5
.
The widely c ited software BEAM3 could not pinpoint
IoIs with p-values lower than 10
−3.5
. In this respect,
SMMB-ACO seems more prom ising than the renow-
ned BEAM3, on the CD da ta set.
On the CD dataset, 56 IoIs were detected by two
methods at least. A first experimental confirmation
is that SMMB-ACO and AntEpiSeeker, which both
use ACO, are nevertheless intrinsically different since
their overlap is only 16. Seco nd, the IoI overlaps bet-
ween ranger and AntEp iSeeker, and between ranger
and SMMB-ACO, tend to feature ranger as a revela-
tory tool of duplicate IoIs. This remark advocates the
relaxation of the significance threshold used for ran-
ger in this feasibility study, to emphasize the potential
revelatory role of ranger.
7 CONCLUSION AND FUTURE
WORK
In the GWAS field, small-scale simulations reveal no-
thing about the effectiven ess of methods on large da-
tasets. In particular, the ratio between the number of
SNPs and number of subjects observed is not compa-
rable between simulated and real datasets.
This p aper focuses on four state-of-the-art ap-
proach e s designed to detect e pistasis, together with
the recent propo sal SMMB-ACO. Our work departs
from the standard fram ework as it repor ts the exten-
sive comparative analysis of these five approaches on
large-scale real data. We described an experimental
protocol conceived to output c omparable sets of (2-
way) interactions across the approaches. We conside-
red 23 chromosome-wide ca se control datasets related
to Crohn’s disease. We achieved 1,035 genetic ana-
lyses and ob served a great heterogeneity across me-
thods in all aspects: run ning tim e s and memory re-
quirements, numbers of interactions of interest (IoIs)
output, p-value and o dds ratio ranges.
This work served as a feasibility study to furt-
her extend the c omparative analysis to six other real-
world datasets. At this scale (10,441 chro mosome-
wide analyses on 161 datasets), we will be able to
confirm or infirm the trends observed for the CD d a-
taset. A still more comprehensive study would a lso
extend the analysis to various genetic models.
Beyond the enlighte ning methodological comp a-
rison on real datasets, the present work allowed to
cross the IoIs of several machine learning methods
whose intrinsic mechanisms greatly differ. Priorizing
the interactions jointly identified by at least two such
methods is a defensib le option to obta in a short list,
when it is not affordable to test experimentally all the
interactions generated. Indeed, the 56 IoIs obtained
from the CD dataset allowed to infer six, four and one
BIOINFORMATICS 2019 - 10th International Conference on Bioinformatics Models, Methods and Algorithms
40

networks of respec tive sizes 3, 4 and 7, and six of the
genes invo lved in these networks are already kn own
to contribute to the disease onset. Applying the revi-
sed protocol to six other genome-wide d atasets will
allow us to confirm whether ranger can be considered
as a revelatory tool of duplicate IoIs.
REFERENCES
Aflakparast, M., Salimi, H., Gerami, A., Dub´e, M.-P., Vis-
weswaran, S., et al. (2014). Cuckoo search epistasis:
a new method for exploring significant genetic inter-
actions. Heredity, 112:666–764.
Ayers, K. and Cordell, H. (2010). SNP selection in genome-
wide and candidate gene studies via penalized logistic
regression. G enetic Epidemiology, 34(8):879–891.
Beam, A. , Motsinger-Reif, A., and Doyle, J. (2014). Baye-
sian neural networks for detecting epistasis i n genetic
association studies. BMC Bioinformatics, 15(1):368.
Chang, Y.-C., Wu, J.-T., Hong, M.-Y., Tung, Y.-A., Hsieh,
P.-H., et al. (2018). GenEpi: gene-based epista-
sis discovery using machine learning. bioRXiv, doi:
https://doi.org/10.1101/421719.
Chatelain, C., Durand, G., Thuillier, V., and Aug´e, F.
(2018). Perf ormance of epistasis detection methods
in semi-simulated GWA S. BMC bioinformatics,
19(1):231.
Fergus, P., Montanez, C., Abdulaimma, B., Lisboa, P., and
Chalmers, C. (2018). Utilising deep learning and ge-
nome wide association studies for epistatic-driven pre-
term birth classification in African-American women.
arXiv preprint, arXiv:1801.02977.
Furlong, L. (2013). Human diseases through the lens of
network biology. Trends in Genetics, 29:150–159.
Gao, H., Granka, J., and Feldman, M. (2010). On
the classification of epistatic interactions. Genetics,
184(3):827–837.
Gibert, J.-M., Blanco, J., Dolezal, M., Nolte, V., Peronnet,
F., and S chl¨otterer, C. (2017). Strong epistatic and
additive effects of linked candidate SNPs for D r oso-
phila pigmentation have implications for analysis of
genome-wide association studies results. G enome Bi-
ology, 18:126.
Gilbert-Diamond, D. and Moore, J. (2011). Analysis of
gene-gene interactions. Current Protocols in Human
Genetics, 0 1: Unit1.14.
Gola, D., Mahachie John, J., van Steen, K., and K¨onig,
I. (2016). A roadmap to multifactor dimensiona-
lity reduction methods. Briefings in Bioinformatics,
17(2):293–308.
Graham, D. and Xavier, R. (2013). From genetics of in-
flammatory bowel disease towards mechanistic insig-
hts. Trends in I mm unology, 34:371–378.
Grange, L., Bureau, J.-F., Nikolayeva, I., Paul, R., Van
Steen, K., et al. (2015). Filter-free exhaustive odds
ratio-based genome-wide interaction approach pin-
points evidence for interaction in the HLA region in
psoriasis. BMC Genetics, 16:11.
Han, B. and Chen, X.-W. (2011). bNEAT: a Bayesian
network method for detecting epistatic interactions in
genome-wide association studies. BMC Genomics,
12(Suppl.2):S9.
Han, B., Chen, X.-W., and Talebizadeh, Z . (2011). FEPI-
MB: identifying SNPs-disease association using a
Markov blanket-based approach. BMC Bioinforma-
tics, 12(Suppl.12):S3.
Han, B., Park, M., and Chen, X.-W. (2010). A Markov
blanket-based method for detecting causal SNPs in
GWAS. BMC Bioinformatics, 11(Suppl.3):S5.
Jiang, X., Neapolitan, R., Barmada, M., Visweswaran, S.,
and Cooper, G. (2010). A fast algorithm for lear-
ning epistatic genomic relationships. In Proceedings
of the Annual American Medical Informatics Associa-
tion Symposium (AMIA2010), pages 341–345.
Jing, P. and Shen, H. (2015). MACOED : a multi-objective
ant colony optimization algorithm for SNP epistasis
detection in genome-wide association studies. Bioin-
formatics, 31(5):634–641.
Khor, B., Gardet, A., and R amnik, J. (2011). Genetics and
pathogenesis of inflammatory bowel disease. Nature,
474(7351):307–317.
Li, Y., Xiao, X., Han, Y., Gorlova, O., Qian, D., et al.
(2018). Genome-wide interaction study of smoking
behavior and non-small cell lung cancer risk in Cau-
casian population. Carcinogenesis, 39(3):336–346.
Lin, H., Chen, Y., Tsai, Y., Qu, X., Tseng, T., and Park,
J. (2012). TRM: a powerful two-stage machine l ear-
ning approach for identifying SNP-SNP interactions.
Annals of Human Genetics, 76(1):53–62.
McGovern, D., Kugathasan, S., and Cho, J. (2015). Ge-
netics of inflammatory bowel diseases. Gastroentero-
logy, 149(5):1163–1176.
Mullis, M., Matsui, T., Schell, R., Foree, R., and Ehren-
reich, I. (2018). The complex underpinnings of ge-
netic background effects. Nature communications,
9(1):3548.
Nicodemus, K., Law, A., Radulescu, E., Luna, A., Ko-
lachana, B., et al. ( 2013). Biological validation of
increased schizophrenia risk with NRG1, ERBB4,
and AKT1 epistasis via functional neuroimaging in
healthy controls. Archives of General P sychiatry,
67(10):991–1001.
Ritchie, M. and Van Steen, K. (2018). The search for gene-
gene interactions in genome-wide association studies:
challenges in abundance of methods, practical con-
siderations, and biological interpretation. Annals of
Translational Medicine, 6(8):157.
Schwarz, D., K¨onig, I., and Ziegler, A. (2010). On safari
to random jungle: a fast implementation of random
forests for high-dimensional data. Bioinformatics,
26(14):1752–1758.
Shen, Y., Liu, Z., and Ott, J. (2012). Support vector ma-
chines with L1 penalty for detecting genegene inter-
actions. International Journal of Data Mining and Bi-
oinformatics, 6:463–470.
Sinoquet, C. and Niel, C. (2018). Enhancement of a
stochastic Markov blanket framework with ant co-
lony optimization, to uncover epistasis in genetic as-
Detection of Gene-gene Interactions: Methodological Comparison on Real-World Data and Insights on Synergy between Methods
41

sociation studies. In Proceedings of the 26th Eu-
ropean Symposium on A rtificial Neural Networks,
Computational Intelligence and Machine Learning
(ESANN2018), pages 673–678.
Stadler, Z., Thom, P. , Robson, M., Weitzel, J., Kauff, N.,
et al. (2010). Genome-wide association studies of can-
cer. Journal of Clinical Oncology, 28(27):4255–4267.
Sun, Y., Shang, J., Liu, J.- X ., Li, S., and Zheng, C .-H.
(2017). epiACO - a method for identifying epistasis
based on ant colony optimization algorithm. BioData
Mining, 10:23.
Uppu, S., Krishna, A., and Gopalan, R. ( 2016). Towards
deep learning in genome-wide association interaction
studies. In Proceedings of the 20th Pacific Asia Confe-
rence on Information Systems (PACIS2016), page 20.
Urbanow icz, R. , Meeker, M., LaCava, W., Olson, R., and
Moore, J. (2018). Relief-based feature selection: in-
troduction and review. Journal of Biomedical Infor-
matics, 85:189–203.
Wang, Y., L iu, X., Robbins, K., and Rekaya, R. (2010). Ant-
EpiSeeker: detecting epistatic interactions for case-
control studies using a two-stage ant colony optimi-
zation algorithm. BMC Research Notes, 3:117.
Wright, M. and Ziegler, A. (2017). ranger: a fast implemen-
tation of random forests for high dimensional data in
C++ and R. Journal of Statistical Software, 77(1):1–
17.
Yoshida, M. and Koike, A. (2011). S NPInterForest: a new
method for detecting epistatic interactions. BMC Bi-
oinformatics, 12:469.
Zhang, Y. (2012). A novel Bayesian graphical model for
genome-wide multi-SNP association mapping. Gene-
tic Epidemiology, 36(1):36–47.
Zhang, Y. and Liu, J. (2007). Bayesian inference of epistatic
interactions in case-control studies. Nature Genetics,
39:1167–1173.
APPENDIX
Table 6: Parameter adjustment for the five methods.
Software Parameter description Value
ranger
num.trees 500
number of trees
mtry 5/8 n
number of variables to possibly split at
in each node, with n, the total number
of variables
impmeasure Gini
type of importance measure index
BEAM3
itburn 50
number of iterations in burn-in phase
itstat 50
number of iterations in stationary phase
iAntCount 1000
number of ants
iItCountLarge 150
number of iterations for the large
haplotypes
iItCountSmall 300
number of iterations for the small
haplotypes
Ant- iEpiModel 2
-EpiSeeker number of SNPs in an epistatic
interaction
pvalue 5 ×10
−4
p-value threshold
(after Bonferroni correction)
alpha 1
weight given to pheromone deposited
by ants
phe 100
initial pheromone rate for each variable
rou 0.05
evaporation rate in ant colony
optimization
DASSO-MB
alpha 5 ×10
−4
global type I error threshold
n
it
360
number of ACO iterations
n
ants
20
number of ants
K
a
160
size of the subset of variables
sampled by each ant
k 3
size of a combination of variables
sampled amongst the K above
variables (k < K)
SMMB-ACO α
α
α
′
5 ×10
−4
global type I error threshold
τ
τ
τ
0
0
0
100
constant to initiate pheromone rates
ρ
ρ
ρ and 0.05
λ
λ
λ 0.1
two constants used to update
pheromone rates
η
η
η 1
vector of weights, to account for prior
knowledge on the variables
α
α
α and 1
β
β
β 1
two constants used to adjust the
relative importance between
pheromone rate and prior
knowledge on the variables
BIOINFORMATICS 2019 - 10th International Conference on Bioinformatics Models, Methods and Algorithms
42
