
Visualization Methods for Educational Timetabling Problems:
A Systematic Review of Literature
Wanderley de Souza Alencar, Hugo Alexandre Dantas do Nascimento,
Fabrizzio Alphonsus A. de M. Nunes Soares and Humberto J. Longo
Instituto de Inform
´
atica, Universidade Federal de Goi
´
as, Alameda Palmeiras, Campus Samambaia, Goi
ˆ
ania-GO, Brazil
Keywords:
Timetabling, Visualization, Educational, Systematic Review of the Literature, Scheduling, Interactive,
NP-hard problem.
Abstract:
This paper investigates, through a Systematic Review of the Literature (SRL), the application of advanced
Information Visualization (IV) methods to the Educational Timetabling Problem (Ed-TTP). The aim is to
show how IV can facilitate the human perception of the several elements embedded in a school or university
timetable scheduling. We also investigates how interactive IVs have been proposed to help creating/improving
timetabling solutions, particularly when time conflict is a major challenging to be solved. In this SRL we
considered publications from the last twenty years (1998–2018) indexed by seven solid scientific databases.
The review clearly identified that there is a small amount of studies devoted to the intersection between IV and
Ed-TTP in that period. Ideas for future research in this intersection field are discussed.
1 INTRODUCTION
In educational institutions (schools, colleges, univer-
sities, etc.), regardless of the level at which they act,
one of the most recurrent and important problems
is the preparation of class-teacher schedules. The
scientific literature dedicated to this problem gene-
rally calls it Educational Timetabling Problem (Ed-
TTP), being a subcategory of the so-called Scheduling
Optimization Problems, as exemplified by Fernandes
et al. (2016) and Saviniec et al. (2018).
Solving an instance of an Ed-TTP is, typically, to
find a way to associate a set of events to a set of avai-
lable timeslots, and, in some cases, also to define the
locations where these events will occur. An event is
often called a class or a didactic session, and brings
together a group of teachers and students who will
carry it out using a room (a typical classroom, a la-
boratory, a theater, a studio, etc.). In real scenarios,
another common fact is the need for an eligible solu-
tion that satisfies hard and soft constraints relating ex-
pected events and all the necessary resources, such as
teachers or lectures, auxiliary equipment (blackboard,
data projector, computer, etc.), specific rooms (labo-
ratory, theater, a studio, etc.) and technical support
teams. The hard constraints are of compulsory atten-
dance, while soft constraint are optional, but conve-
nient in favor of improving the quality of the obtained
solution.
As a result of more than six decades of research,
the scientific community devoted to timetabling de-
monstrates that most of its variations belong to the
class of N P -Hard problems, as shown by Werra et al.
(2002) and Elloumi et al. (2014), among others. There
are currently a large number of computational met-
hods available for its satisfactory resolution, dealing
with different problem specifications and sizes of in-
stances. Many of these methods are synthesized in
(Schaerf, 1999; Lewis, 2008; Pillay, 2014; Babaei
et al., 2015; Oude Vrielink et al., 2017).
In general, the identified solution for an instance
of a timetabling problem is visually presented in the
form of a 2D table or a set of them, showing the days
of the week and the times of the scheduled activi-
ties and even the place where each activity will occur.
User interaction with the table can be supported in or-
der to provide extra textual information or to allow
manipulation of the time scheduling. Such a configu-
ration, very common in many timetabling systems, is
referred here as a traditional 2D-table format/system.
Understanding all types of information using a ta-
ble representation may be a challenging task. The
Information Visualization (IV) area highlights that
some other visual techniques can emphasize proper-
ties of an abstract object, thus allowing a better under-
standing of it and raising cognition, as argue Gershon
Alencar, W., Dantas do Nascimento, H., Soares, F. and Longo, H.
Visualization Methods for Educational Timetabling Problems: A Systematic Review of Literature.
DOI: 10.5220/0007375802750281
In Proceedings of the 14th International Joint Conference on Computer Vision, Imaging and Computer Graphics Theory and Applications (VISIGRAPP 2019), pages 275-281
ISBN: 978-989-758-354-4
Copyright
c
2019 by SCITEPRESS – Science and Technology Publications, Lda. All rights reserved
275

and Eick (1997) and Card et al. (1999).
In this context, the current paper presents the
“state of art” of IV methods applied to Ed-TTPs by an
analysis of the scientific publications registered in the
last twenty years (1998–2018) in seven solid scientific
databases. In addition, we present some possibilities
for future work that researchers, dedicating themsel-
ves to the intersection of the areas of timetabling and
information visualization, may pursue.
The remainder of this work is organized as fol-
lows: Section 2 describes the methodology adopted
for the literature review; Section 3 explains the steps
conducted in the review and their quantitative results;
Section 4 presents the contributions of the main pa-
pers found in the SRL, with focus to the proposed
IV techniques and their forms of interaction; and
Section 5 draws our conclusions about the relations-
hip between IV and Ed-TTP.
2 RESEARCH METHODOLOGY
For the study, we performed a Systematic Review of
the Literature (SRL), since it is a process that provi-
des well-defined, solidly backed bases for the iden-
tification, evaluation, synthesis and interpretation of
the relevant evidences to a particular research ques-
tion. Following the SRL guideline defined in (Kit-
chenham and Charters, 2007), three main stages were
taken: (I) defining a review protocol; (II) conducting
the review of the studies; and (III) reporting the re-
view.
The first stage involved, in turn, the definition of:
(I.1) research questions; (I.2) keywords, synonyms
and search strategy; (I.3) inclusion and exclusion cri-
teria for the selection of studies; and (I.4) a checklist
for study quality assessment.
Each of these elements is detailed next. To carry
out the SRL in a collaborative way between the aut-
hors of current paper, two software platforms were
used: Parsifal (https://parsif.al/) and SESRA
(http://sesra.net/).
2.1 Research Questions
The main objective of the SRL was to answer the fol-
lowing question: “What is the state of the art in the
application of IV methods to the presentation or/and
the manipulation of solutions for Ed-TTP?”.
Some more specific questions that unfolded the
previous one were formulated: (RQ.1) What are the
IV methods currently available for presenting and/or
manipulating solutions for Ed-TTP? (RQ.2) Do the
visualizations help to identify different aspects of a
timetabling solution such as: unassigned classes and
teachers/lectures, the distribution of the classes over
the week, time scheduling conflicts, the matching be-
tween the teachers’ preferences and what was effecti-
vely scheduled for them, etc.? (RQ.3) Has the effecti-
veness of the new visualizations been compared to
the traditional 2D-table format? (RQ.4) If the answer
for Question RQ.3 is “yes”, then what measurements
were adopted for evaluating effectiveness? (RQ.5) Do
the visualizations show a single solution or the “so-
lution space” for the timetabling problem being sol-
ved? (RQ.6) Do the visualizations support human in-
teraction? (RQ.7) If the answer for Question RQ.6
is “yes”, then what types of interaction (for example:
applying data filters, drag-and-dropping elements of
the visualization, selecting areas of interest for focu-
sed optimization, etc.) are supported? (RQ.8) If the
answer for Question RQ.6 is “yes”, which are the aims
of the interactive features designed for the visualiza-
tions (helping understand the timetabling; helping de-
fine the timetabling problem in a more precise way;
or helping find a better solution for the timetabling
problem)?
It is important to emphasize that the above que-
stions RQ.6–RQ.8 are directly related to the use of
interactive techniques, mediated by a visual user in-
terface, as an approach to solve scheduling problems,
in this case, a timetabling problem.
2.2 Keywords, Synonyms and Search
Strategy
The following keywords, usually with a high in-
cidence in the scientific literature dedicated to the
topic, and their associated synonyms, were cho-
sen for driving the SRL: (K.1) timetabling (timeta-
ble, time table, time-table); and (K.2) visualization
(GUI, interface, presentation, view, visual, visualisa-
tion); (K.3) educational (classroom, college, educa-
tion, school, university).
The general logic search string was defined
as [[timetabling] ∧ [visualization ∧ educational]], with
each pair of brackets a disjuntion of synonyms.
This string was adjusted for every electronic da-
tabase in order to meet its search syntax. We se-
arched on seven databases: (1) ACM Digital Li-
brary; (2) DOAJ – Directory of Open Access Jour-
nals; (3) IEEE Digital Library; (4) Science Direct;
(5) Scielo; (6) Scopus; and (7) Springer Link, since
they gather most of the publications on the area of ti-
metabling and IV.
In order to concentrate the search on the most rele-
vant papers (and not potentially in thousands of unre-
lated publications), the search string was applied only
IVAPP 2019 - 10th International Conference on Information Visualization Theory and Applications
276

on the fields paper titles, keywords, and abstracts of
the databases, usually referenced as TAK, except for
the DOAJ and the Springer Link, in which the se-
arch was made throughout the full text of the papers.
For the Scopus database, only the K.1 part of the se-
arch string was applied on TAK, while the remain-
der of it (K.2 and K.3) was verified on the full text.
This broadened the search, but still kept the amount
of results manageable. Another special case was the
ACM Digital Library, where the search was done in
the “The ACM Guide to Computing Literature” col-
lection, since this contains the complete set of articles
in the area of Computing and related fields.
In addition, we restricted the search in all databa-
ses to the period from 1998 to 2018 (until Oct/2018).
Through an extensive search before the realization of
the SRL, in the aforementioned databases and using
the same search string, publications prior to the year
1998 were identified but disregarded, since they no-
tably use traditional 2D-table to present solutions for
the Ed-TTP. Furthermore, when some kind of inte-
ractivity was reported, it was performed by simple
drag-and-drop or copy-and-paste operations and se-
lect/deselect of elements, such as cells and regions.
Consequently, only works published in the the last
twenty years were considered relevant.
2.3 Inclusion/Exclusion Criteria
Inclusion and exclusion criteria were defined for gui-
ding the selection of primary studies relevant to the
SRL. A study was included if it was: (1) available
in full-text; (2) published in a journal or in the an-
nals of a conference; (3) a technical report, including
surveys; or (4) a master dissertation or a doctoral the-
sis. On the other hand, it was excluded if it: (1) was
not written in English; (2) did not present, or dis-
cuss, techniques of the IV area; or (3) did not propose
and/or discuss an IV technique for the Ed-TTP; (4) fo-
cused only on traditional 2D-table visualizations with
ordinary user interactions.
A set of Yes/No quality assessment questions was
also defined based on a refinement of the main rese-
arch questions (RQs). For instance, they asked if the
visualization method in use could be changed in the
graphical interface or if a particular type of interaction
for some specific goal was supported.
3 CONDUCTING THE REVIEW
The proper search strings, with the corrected search
conditions, were applied to the databases. Next, as
a Study Selection step, the bibliographic references
were evaluated according to the inclusion and the ex-
clusion criteria (with the help of the SRL software
platforms). When necessary, the full text of the stu-
dies was consulted.
Table 1 summarizes the number of papers recove-
red when searching in each database, and the amount
of accepted (selected) and reject studies during the
Selection step. In Total, when removing duplicates,
only 10 studies were accepted, with 8 of them being
academic productions of a same research group.
Table 1: Number of Studies (1998–2018) in the SRL.
Database Total Accepted Rejected
ACM DL 346 4 342
DOAJ 11 0 11
IEEE DL 54 5 49
Scielo 1,734 0 1,734
ScienceDir 64 0 64
Scopus 1,362 7 1,355
Springer 2,314 2 2,312
Some limitations faced during the search process and
the strategies adopted in order to overcome them are
worth mentioning. The Scielo database did not al-
low a search with the complete search string. There-
fore, three search activities had to be performed, each
using a distinct pair of the components of the search
string: timetabling (K.1), visualization (K.2) and edu-
cational (K.3). The employed strings were: (K.1 ∧
K.3), that returned six studies; (K.2 ∧ K.3), that re-
sulted in 1,734 studies; and (K.1 ∧ K.2), that returned
only one study. The union of these results had exactly
1,734 papers. After reading and analyzing titles and
abstracts, only twelve papers had to be read comple-
tely and none of them were accepted.
Another particular, and more complex case was
that of Springer Link database. The search in it can
not be limited to Title-Abstract-Keywords (TAK) and
had to be performed throughout the full text. As a
consequence, 16,542 studies were returned: 2,545 pu-
blished in conferences and 13,997 in journals. The
results were then filtered to show only the ones in
the fields of “Computer Science”, “Engineering” and
“Mathematics”, what reduced the search to 2,314 pa-
pers.
Given the limited number of accepted papers, the
quality criteria were not evaluated and, therefore, the
Quality Assessment step was not performed.
Finally, all accepted papers were fully read and
all relevant data for answering the search questions
was extracted. Table 2 synthesizes the major aspects
of identified studies in this SRL. The table columns
contain the following information:
Visualization Methods for Educational Timetabling Problems: A Systematic Review of Literature
277

1. Bibliographic reference of the study;
2. IV method(s) that was applied;
3. Data elements displayed by the IV method;
4. Types of Interaction supported by the IV, conside-
ring five possibilities — [OF] allow to change the
objective function of the underlying optimization
timetabling problem; [Constr.] allow to change
constraints of the optimization problem; [Techn.]
allow to choose and run one of many optimization
methods; [Manual Sol.] a timetabling solution
can be manually changed using the visualization;
and [Sel. Area] allow to select a region for de-
leting, including or changing data in group;
5. Available application that implements the work;
and
6. Optimization technique(s) being used for the reso-
lution of the underlying problem.
It is important to note that one of the difficulties
encountered during the SRL is that some of the stu-
dies do not clearly present information that allows us
to answer certain research questions in a safe way. In
this scenario, some level of interpretation was neces-
sary, but always with the largest effort to provide the
right answer. In the worst case, the evaluation could
not be performed in that context or the response was
inconclusive, which is signaled by a dash (–) in Ta-
ble 2.
Next, we describe the main concepts in some of
the studied selected by the SRL.
4 VISUALIZATION METHODS
FOR Ed-TTP
In one of the first studies published in the investiga-
ted period (Piechowiak and Kolski, 2004), the aut-
hors propose an interactive decision support system
for the analysis of educational timetabling problems
and the elaboration of solutions for them. The sy-
stem has a visualization module that shows an inter-
face customized to the user profile (designers, analy-
zers and consultors) and that employs both 2D-tables
and a time chart (resources × time) for user interacti-
ons. A timetabling solution is built manually, but with
a constraint-based reasoning engine to assist the user
in obtaining a solution to the target problem, inclu-
ding hard and soft constraint violation detection in a
semi-automatic way.
Another paper, by Thomas et al. (2008) focuses on
solving Examination Timetabling Problems (Exam-
TTP), a type of Ed-TTP. The authors propose a visual
framework that operates on three interrelated phases:
pre-processing (visualizing raw data inputted from
the user), processing (solving the optimization pro-
blem and visualizing the generated timetabling solu-
tion) and post-processing (improving the timetabling
solution) of a timetabling solution. A visual model
is used by the authors as an instrument to clarify the
problem complexity – a NP-hard problem – and to
provide an integrated visualization of the phases that
can contribute to its understanding and satisfactory re-
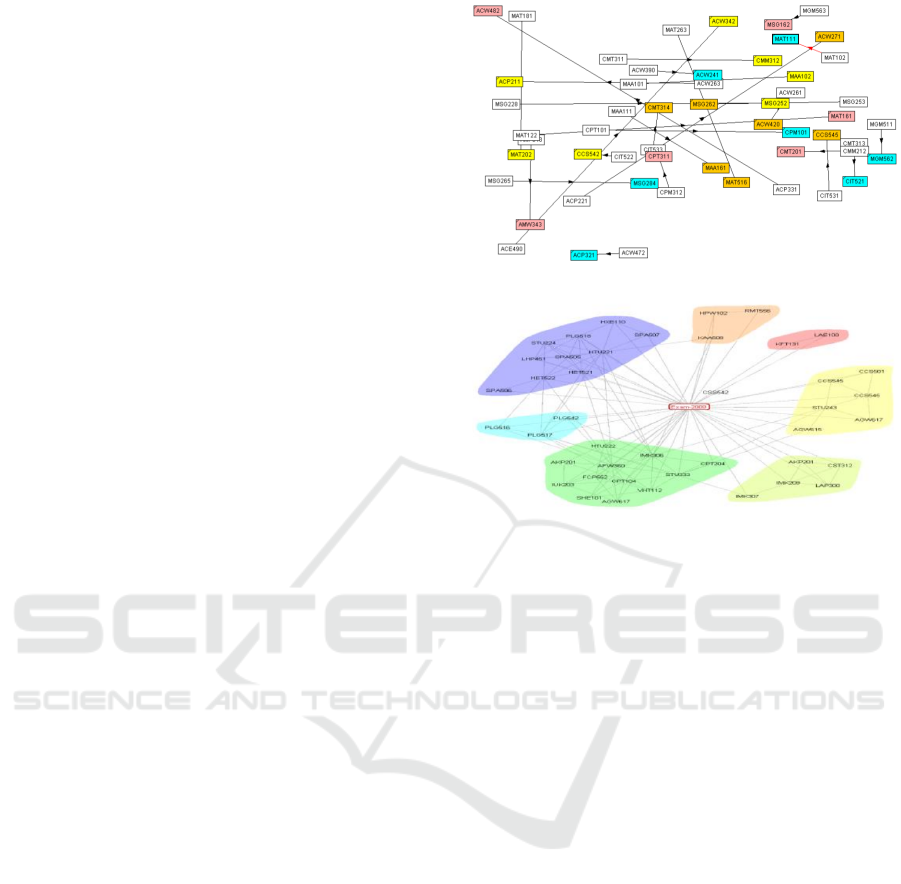
solution. The article details the use of IV techniques
for the pre-processing phase, in which, for example,
directed graph drawings indicate the relationship bet-
ween enrolled candidates (students) with the courses
for a particular semester. In another example, courses
are represented by nodes and constraints are modelled
by edges, as shown in Figure 1a. The node color in-
dicates the period of the day when a course is taught.
Nodes with the same color are being offered concur-
rently in the same academic period.
In an extension of the previous work, and by me-
ans of a pair of strongly related studies (Thomas et al.,
2009b,a), more visualization techniques are proposed
for the pre-processing phase. The new visualizations
include: a tree view (aggregating many types of data),
a directed graph drawing, a histogram combined with
a circular graph layout (courses × enrolled students);
and some standard histograms (rooms × subjects and
rooms × timeslots). It is possible for the user to in-
teract with the visualizations but for the aim of better
understanding the data.
Still researching on Exam-TTP, further studies of
the same group of authors (Thomas et al., 2010b,c)
propose a tool, called VizSolution, for the processing
phase of the visual framework they conceived. An in-
teractive visualization approach is adopted, in which
a user and a machine (a scheduler implemented as a
constraint satisfaction program) operate in a symbio-
tic way for solving a timetabling problem, including
the allocation of classrooms. The tool allows to de-
fine the problem by means of an element called Fil-
ter, which employs graph drawing to represent con-
straints, as shown in Figure 1b. Graph drawings (in
2D and projected 3D) are also used to indicate con-
flicts and/or preferences.
With the goal of helping the user to more ea-
sily identify and to solve time conflicts in teachers
and courses’ schedules, some researchers (Fui et al.,
2010) have proposes a system, named CORECTS,
that models a timetabling solution as a graph. A
modified version of a standard graph drawing algo-
rithm is employed for visually presenting the solution
and to highlight conflicts. Via “simple strokes gestu-
res” made by user on the visualization (using a touch
screen monitor), it is possible to do operations that
IVAPP 2019 - 10th International Conference on Information Visualization Theory and Applications
278
affect the conflicts.
Back to the Exam-TTP (Thomas et al., 2011), pa-
rallel coordinates were used for answering the ques-
tion: “How hard is this problem to solve?”. The aut-
hors conceived the ParExaViz tool, which facilitates
the exploration of raw data of an Exam-TTP instance
and to highlight conflicts.
Addressing the problem of university timetabling,
some other authors (Abdelraouf et al., 2011) intro-
duce a visual graphic communication tool that lets the
users to specify their problem in an abstract manner,
involving human resources (people), events (lectures)
and meta-events (courses). These elements are repre-
sented by nodes in a graph, while edges indicate their
relationships. The edges have different interpretations
according to the type of the elements involved. A vi-
sual interface integrates textual and graphical compo-
nents (many tabs). The timetabling problem is solved
by a module that implements a constraint satisfaction
algorithm.
Finally, a system called ExamViz (Thomas et al.,
2012) is conceived with an integrated problem sol-
ving environment (PSE) to the Exam-TTP. It works as
a computational steering mechanism with automated
steering interactions and/or with a user-driven pro-
cess. Through the user interface, it is possible to per-
form conflict analysis in the timetable and to apply
a reconciliation process based on evolutionary algo-
rithms. The analysis can be done visually using pa-
rallel coordinates as well as 2D-tables and graph dra-
wings.
5 CONCLUSIONS
Based on a SRL, we found that, in the last twenty
years, only few studies have investigated the use of
advanced information visualization methods for hel-
ping understand and/or solve educational timetabling
problems. This contrasts to the majority of scienti-
fic papers in the timetabling area, which main con-
cern is to provide a method capable of solving the
problem close to optimality, with little or no atten-
tion to the visualization aspect. Some examples of
such works are Nouri and Driss (2016), Babaei et al.
(2018) and Lindahl et al. (2018). Nevertheless, in the
latter article (Lindahl et al., 2018), the authors high-
light that the work could be complemented by having
a graphics user interface. Another recent work (Oude
Vrielink et al., 2017) emphasizes that, while the aca-
demia tends to develop intelligent and profound met-
hods to solve timetabling problems, the industry ap-
pears to develop and to design an easy to use inte-
ractive tool that aims at meeting the needs of the edu-
(a)
(b)
Figure 1: Examples of timetable visualizations: (a) repro-
duced from Thomas et al. (2008); (b) VizSolution, reprodu-
ced from Thomas et al. (2010b).
cational institutions.
Some ideas for future work were identified during
this SRL. They include:
1. Developing new visualization approaches for hel-
ping to identify and understand the main factors
responsible for infeasibility in large-scale timeta-
bling problem instances;
2. Proposing new visualizations for supporting in-
teractive optimization of educational timetabling
problems and investigating their effectiveness and
usability;
3. Extending the SRL for including the study of com-
mercial and non-commercial software systems for
Ed-TTP, focusing on the visualizations and on the
interaction features; and
4. Adjusting visualization methods proposed to time-
tabling in other areas, such as for organizing hos-
pitals’ agendas and transportation (bus, train and
airplane) schedules, to the Ed-TTP scenario.
Visualization Methods for Educational Timetabling Problems: A Systematic Review of Literature
279
Table 2: Analysis of the Accepted Publications. Some features are marked as [Y]es, [N]o or [–] for inconclusive.
Study Identification and Characterization Interaction types by IV Technique(s) Application and Solution Techn. Appl.
Reference IV Method Displayed Data Elements Optimiz. Manual Select Applic. Method(s) Used to
Identification Applied by IV Method OF Constr. Techn. Solution Area Solve the Ed-TTP
Piechowiak and Kolski (2004) 2D-table and time chart. timetable, resources x time. N Y N Y N Y Manual with constraint-based rea-
soning.
Thomas et al. (2008) Oriented cluster graph
drawing.
classes and students enrolled. – Y N Y N N Manual or by any automatic sche-
duler.
Thomas et al. (2009b) Directed graph drawing,
histogram, daisy chart,
tree view
pre-processing data (raw input
data).
N N N N Y Y There is no attempt to solve the pro-
blem, just processing/visualizing
raw input data.
Thomas et al. (2009a) 2D-table, oriented clus-
ter graph drawing, histo-
gram and tree represen-
tation
timetable (complete) and pre-
processing data (raw input data).
N Y N N Y Y Constraint Satisfaction Program.
Thomas et al. (2010b) 2D-table, graph drawing
(2D, 3D).
timetable (complete), constraints
and conflicts.
– Y N Y Y Y Constraint Satisfaction Program (in
a constraints network, with back-
tracking) with user collaboration.
Thomas et al. (2010c) 2D-table, graph drawing
(2D, 3D).
timetable (complete), constraints
and conflicts.
– Y N Y Y Y Constraint Satisfaction Program (in
a constraints network) with user
collaboration.
Thomas et al. (2010a) 2D-table, graph drawing,
tree representation
timetable (complete), constraints,
conflicts.
N Y N Y Y Y Visual analysis heuristics and evo-
lutionary algorithms.
Abdelraouf et al. (2011) Undirected graph dra-
wing (representing peop-
les, courses, ...)
timetable with day/time, graphs and
text
N Y N Y N Y Constraint satisfaction problem sol-
ving.
Thomas et al. (2011) Parallel coordinates (for
uni/multi dimensional
variables).
timetable (complete). N N N N Y Y There is no resolution of the pro-
blem, just processing raw data.
Thomas et al. (2012) 2D-table, graph drawing
(2D, 3D), parallel coor-
dinates.
timetable (complete), constraints
and conflicts.
– Y – Y – Y Manual and user-driven problem
solving environment, with clashes
reconciliation (AI Techniques).
IVAPP 2019 - 10th International Conference on Information Visualization Theory and Applications
280

ACKNOWLEDGEMENTS
This work was financially supported by the
Coordenac¸
˜
ao de Aperfeic¸oamento de Pessoal de
N
´
ıvel Superior (CAPES) and the Fundac¸
˜
ao de
Amparo
`
a Pesquisa do Estado de Goi
´
as (FAPEG).
REFERENCES
Abdelraouf, I., Abdennadher, S., and Gervet, C. (2011). A
visual entity-relationship model for constraint-based
university timetabling. CoRR, abs/1109.6.
Babaei, H., Karimpour, J., and Hadidi, A. (2015). A survey
of approaches for university course timetabling pro-
blem. Comp. & Ind. Eng., 86:43–59.
Babaei, H., Karimpour, J., and Hadidi, A. (2018). Gene-
rating an optimal timetabling for multi-departments
common lecturers using hybrid fuzzy and clustering
algorithms. Soft Computing.
Card, S. K., Mackinlay, J., and Shneiderman, B., editors
(1999). Readings in information visualization: using
vision to think. Interactive Technologies. Morgan
Kaufmann, 1 edition.
Elloumi, A., Kamoun, H., Jarboui, B., and Dammak, A.
(2014). The classroom assignment problem: Com-
plexity, size reduction and heuristics. AppL. Soft.
Comp., 14:677–686.
Fernandes, P., Pereira, C. S., and Barbosa, A. (2016). A
decision support approach to automatic timetabling in
higher education institutions. Journ. Sched., 19:335–
348.
Fui, Y. T., Onn, C. W., Yeen, C. W., and Meian, K. H.
(2010). Graph-based conflict rectification using stroke
gesture approach in timetabling system ( corects ). In
Proc. of the Know. Man. Int. Conf. (KMICe2010, pa-
ges 109–114, New York, NY, USA. ACM.
Gershon, N. and Eick, S. G. (1997). Information visualiza-
tion. IEEE Comput. Graph. and Appl., 17(4):29–31.
Kitchenham, B. and Charters, S. (2007). Guidelines for
performing systematic literature reviews in software
engineering (ebse technical report version 2.3, ebse-
2007-01). Technical report, Keele University, Univer-
sity of Durham, Keele, United Kingdom.
Lewis, R. (2008). A survey of metaheuristic-based techni-
ques for University Timetabling problems. OR
Spectrum, 30(1):167–190.
Lindahl, M., Mason, A. J., Stidsen, T., and Sørensen, M.
(2018). A strategic view of university timetabling.
EJOR, 266(1):35 – 45.
Nouri, H. E. and Driss, O. B. (2016). Matp: A multi-agent
model for the university timetabling problem. In Sil-
havy, R., Senkerik, R., Oplatkova, Z. K., and Silhavy,
P. P., editors, Soft. Eng. Persp. and Applic. in Intell.
Systems, pages 11–22, Cham. Springer Inter. Publ.
Oude Vrielink, R. A., Jansen, E. A., Hans, E. W., and Hille-
gersberg, J. v. (2017). Practices in timetabling in hig-
her education institutions: a systematic review. Ann.
of Oper. Res.
Piechowiak, S. and Kolski, C. (2004). Towards a generic
object oriented decision support system for university
timetabling: an interactive approach. Int. Journ. of
Infor. Techn. & Dec. Making, 3(1):179–2008.
Pillay, N. (2014). A survey of school timetabling research.
Ann. of Oper. Res., 218(1):261–293.
Saviniec, L., Santos, M. O., and Costa, A. M. (2018). Paral-
lel local search algorithms for high school timetabling
problems. EJOR, 265(1):81–98.
Schaerf, A. (1999). A Survey of Automated Timetabling.
Artif. Intell. Review, 13(2):87–127.
Thomas, J. J., Khader, A. T., and Belaton, B. (2008). A
visual analytics framework for the examination time-
tabling problem. In 2008 Fifth Int. Conf. on Comp.
Grap. Imaging and Visual., pages 305–310.
Thomas, J. J., Khader, A. T., and Belaton, B. (2009a). Vi-
sualization of preprocess data in the examination ti-
metabling problem. In 2009 WRI World Congress on
Computer Science and Information Engineering, vo-
lume 3, pages 264–268.
Thomas, J. J., Khader, A. T., and Belaton, B. (2009b). Vi-
sualization techniques on the examination timetabling
pre-processing data. In 2009 Sixth International Con-
ference on Computer Graphics, Imaging and Visuali-
zation, pages 454–458.
Thomas, J. J., Khader, A. T., and Belaton, B. (2010a). In-
formation visualization approach on the university ex-
amination timetabling problem. In Huang, M. L.,
Nguyen, Q. V., and Zhang, K., editors, Visual Infor-
mation Communication, pages 255–264, Boston, MA.
Springer US.
Thomas, J. J., Khader, A. T., and Belaton, B. (2011). A
parallel coordinates visualization for the uncapaciated
examination timetabling problem. In Visual Informa-
tics: Sustaining Research and Innovations, pages 87–
98, Berlin, Heidelberg. Springer Berlin Heidelberg.
Thomas, J. J., Khader, A. T., Belaton, B., and Christy, E.
(2010b). Visual interface tools to solve real-world ex-
amination timetabling problem. In 2010 Seventh Int.
Conf. on Comp. Graph., Imaging and Visualization,
pages 167–172.
Thomas, J. J., Khader, A. T., Belaton, B., and Ken, C. C.
(2012). Integrated problem solving steering frame-
work on clash reconciliation strategies for university
examination timetabling problem. In Huang, T., Zeng,
Z., Li, C., and Leung, C. S., editors, Neural Informa-
tion Processing, pages 297–304, Berlin, Heidelberg.
Springer Berlin Heidelberg.
Thomas, J. J., Khader, A. T., Belaton, B., and Leow, A.
(2010c). VIZSolution: an interface tool to solve real-
world examination timetabling problem. Int. J. Adv.
Comp. Techn., 2:80–88.
Werra, D. d., Asratian, A. S., and Durand, S. (2002). Com-
plexity of some special types of timetabling problems.
Journ. of Scheduling, 5:171–183.
Visualization Methods for Educational Timetabling Problems: A Systematic Review of Literature
281
