
BOLD Signal Change during Driving with Addition Task using fMRI
Ji-Hun Jo, Hyung-Sik Kim, Soon-Cheol Chung and Mi-Hyun Choi
Research Institute of Biomedical Engineering, Department of Biomedical Engineering,
School of ICT Convergence, Engineering, College of Science & Technology, Konkuk University,
268 Chungwandae-ro, Chungju-si, South Korea
Keywords: Driving with Addition Task, BOLD Intensity, fMRI.
Abstract: This paper uses a driving wheel and pedal (working as an accelerator, brake) equipped with an MR-
compatible driving simulator at a speed of 80 km/h when driving and when driving while performing
secondary tasks in order to observe differences in neuronal activation (BOLD signal change). The
experiments consisted of three blocks, each block consisting of both a Control phase (1 min.) and a Driving
phase (2 min.). During the Control phase, the drivers were instructed to look at the stop screen and not to
perform driving tasks. During the Driving phase, the drivers either drove or drove while performing addition
tasks at 80 km/h. The intensity of activated voxels increased in the addition task condition compared to the
driving condition in insula.
1 INTRODUCTION
Quantitative observation of cerebral nerve activation
using functional Magnetic Resonance Imaging
(fMRI) is performed using two concurrent
assessments: changes in the area of cerebral nerve
activation (the number of activated voxel) based on
Blood Oxygenation Level Dependent (BOLD) and
changes in the size of cerebral nerve activation (the
intensity of activated voxel). The changes in the area
of cerebral nerve activation is an index assessing a
specific region of the cerebral nerve activity or
variation in the area of cerebral nerve activation,
while the changes in the size of cerebral nerve
activation is an index of the signal intensity of
activated voxels within the same region. Therefore,
either of the two methods can be selectively used for
the studies with different primary purposes.
Many people nowadays frequently perform extra
tasks (i.e. audio and navigation control, smartphone
usage, eating, or carrying on a conversation) while
driving. Recent neuroimaging studies have utilized
fMRI to elucidate the neural activation under driving
with extra task (Just et al., 2008; Uchiyama et al.,
2012; Newman et al., 2007; Graydon et al., 2004).
The subjects – while driving and performing an
extra task simultaneously, in comparison with
driving – exhibited reduced neural activation in the
regions related to the spatial processing, visual
spatial attention, movement planning and execution,
action planning and motor control, but increased
neural activity in the regions related to performing
extra tasks (Just et al., 2008; Newman et al., 2007;
Uchiyama et al., 2012). Nonetheless, these previous
studies have primarily focused on observing the
changes in the area or the region of cerebral
activation. In order to more clearly understand the
effects of performing simultaneous extra tasks on
driving, not only the differences in the neural
network activities but also the difference in the size
of neural activity in the same region should be
assessed via additional studies.
This study aims to observe the differences in the
intensity of activated areas between driving and
driving with a simultaneous additional task.
2 METHODS
In total, 10 adult male subjects in their 20’s (mean
age of 23.0±1.2) with mean driving experience of
2.6±1.8 years and without medical condition or
history were selected for this study. Prior to the
study participation, the subjects were provided with
information regarding the purpose and the content of
the study, and were controlled for other external
factors that can affect either driving or cerebral
nerve activation – including smoking, alcoholic
100
Jo, J., Kim, H., Chung, S. and Choi, M.
BOLD Signal Change during Driving with Addition Task using fMRI.
DOI: 10.5220/0007376501000103
In Proceedings of the 12th International Joint Conference on Biomedical Engineering Systems and Technologies (BIOSTEC 2019), pages 100-103
ISBN: 978-989-758-353-7
Copyright
c
2019 by SCITEPRESS – Science and Technology Publications, Lda. All rights reserved
drinks, and coffee. Practice driving runs were
performed until the subject became familiar with the
environment of driving simulator and could drive
without an accident.
The developed MR-compatible driving simulator
was composed of a driving wheel, an accelerator and
a brake pedal (Figure 1). Driving environment was
created using a software from Lightrock
Entertainment. The subject used both hands to
manipulate the driving wheel and right foot to press
on the accelerator or brake pedal, and was asked to
drive at a constant speed of 80km/h without making
lane changes.
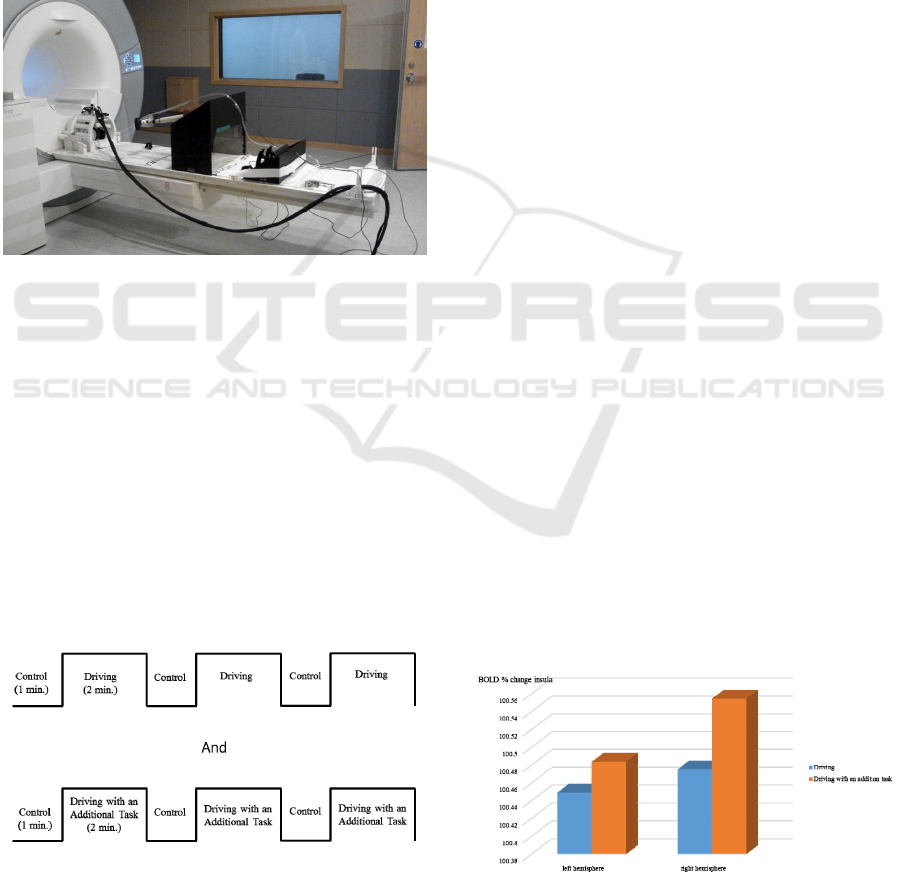
Figure 1: MR-compatible driving system.
The experimental design is composed of three
blocks (Figure 2) – with one block consisting of the
control phase (1 minute) and the driving phase (2
minutes). During the control phase, the subjects
were asked to stare at a still frame without driving.
During the driving phase, the subjects were either
asked to focus on driving at 80km/h or perform
both driving at 80km/h and an additional task at the
same time. All subjects participated in the study
under both conditions (driving, driving with an
additional task). The speed of the vehicle was
provided on the bottom left corner of the stimulator
screen so that the subject could maintain the
vehicle speed of 80km/h.
Figure 2: Experimental design.
The additional tasks were composed of
mathematical calculations where the sum of the 2-
digit numbers do not exceed 100 and the task
requires carrying. There were 10 questions in each
block, resulting in 30 questions of additional tasks in
total. The investigator provided the additional task
questions verbally via an audio system attached on
the MR system, and the subject reported verbal
responses to the questions.
The regions of cerebral nerve activation under
each condition (driving, driving with an additional
task) were calculated in comparison to the control
phase. Using a voxel exhibiting the greatest
statistical significance for activation as the standard,
a 5x5x5 region was selected. In this selected region,
the mean value of BOLD signal according to each
condition and each phase was calculated. In order to
analyze the variations in the cerebral nerve
activation during the stimulation phase in
comparison with the resting phase under each
condition, BOLD % change was calculated using the
following equations:
ܤܱܮܦ % ܿhܽ݊݃݁ = {(Driving phase – Control
phase) / Control phase} x 100(%)
In order to assess the difference in BOLD %
change at the selected regions under each condition,
Independent t-test (PASW 18) was performed.
3 RESULTS
The 8 regions that were commonly activated under
both condition included inferior frontal gyrus,
inferior parietal lobule, inferior temporal gyrus,
insula, lingual gyrus, precentral gyrus, precuneus,
and superior temporal gyrus. In comparison to
driving condition, only the one region –insula
(p<0.01)– exhibited significantly larger BOLD %
change when the subject was driving and performing
additional tasks simultaneously (Figure 3).
Figure 3: BOLD % change of insula.
BOLD Signal Change during Driving with Addition Task using fMRI
101

4 CONCLUSIONS
The outcomes of this study were in agreement with
the previous studies, with cerebral nerve activation
in the similar regions. More specifically, BOLD
signals were increased in the inferior parietal lobule,
precuneus and inferior frontal gyrus regions
associated with recognition (Andersen, 2011), as
well as the precentral gyrus region associated with
arm and eye movements (Graydon et al., 2004;
Spiers, 2007). These regions are responsible for
processing visual information related to the driving
and auditory information related to the additional
tasks which involve listening to the questions and
providing answers. Furthermore, BOLD signals
were increased in the insula, the region associated
with error monitoring and controlling unnecessary
behaviors (Anderson et al., 1994).
Previous studies that focused on the regions and
the changes in the area of cerebral nerve activation
reported that performing extra tasks while driving –
in comparison with driving – reduces the area of
cerebral nerve activation associated with driving but
increases the area associated with performing extra
tasks (Just et al., 2008; Uchiyama et al., 2012).
With increasing demand to supplement (or
overcome) this, there is an increased activity in the
sub-lobular regions which are associated with error
monitoring and controlling unnecessary behaviors
(Graydon et al., 2004). In this study, BOLD signal
difference in the regions commonly activated under
both conditions was compared. In other words,
instead of observing the change in the area of
activation based on the condition, the intensity of
activity in the same activated region was observed.
The outcomes of this study suggest that when
driving and performing extra task simultaneously –
in comparison with driving – BOLD signal was
greater in the inferior and superior temporal gyri,
which are associated with extra tasks. Furthermore,
BOLD signal was also greater in the insula region
associated with error monitoring and controlling
unnecessary behavior. Nonetheless, the differences
in BOLD signal were not observed in other regions
directly or indirectly associated with driving. These
findings further confirmed the outcomes of previous
studies that have utilized BOLD signal intensity,
which is another important measurement index of
the changes in cerebral nerve activation. However, at
the same time, these findings also raise the need for
additional studies.
In conclusion, comprehensive analysis of the
outcomes from the previous studies – that focused
on the region and the change in the area of cerebral
nerve activation – and this study – which focused on
the change in the size of activation – suggests that
while driving and performing addition tasks
simultaneously, in comparison with driving, both the
area and the size of neural activation increased in the
regions associated with performing addition tasks
and controlling unnecessary behaviors. However,
other regions deeply related to driving (i.e. region
associated with spatial recognition) did not exhibit
change in the size of neural activation in this study,
despite the previous study outcomes that
demonstrated decreased area of neural activation.
Additional studies are required to explain this
deviation, and potential reasons include: the
difference in the sensitivity of the two indices;
differences in the characteristics of neural activation;
or experimental design.
ACKNOWLEDGEMENTS
This work was supported by a Mid-career
Researcher Program Grant through the National
Research Foundation of Korea (NRF), funded by the
Ministry of Education (MOE) (No. 2017R1A2
B2004629). This research was supported by Basic
Science Research Program through the National
Research Foundation of Korea (NRF) funded by the
Ministry of Education (2017R1D1A1B03029585).
REFERENCES
Just, M. A., Keller, T. A., Cynkar, J., 2008. A decrease in
brain activation associated with driving when listening
to someone speak. Brain Research. 1205: 70-80.
Uchiyama, Y., Toyoda, H., Sakai, H., Shin, D., Ebe, K.,
Sadato, N., 2012. Suppression of brain activity related
to a car-following task with an auditory task: an fMRI
study. Transportation Research Part F: Traffic
Psychology and Behaviour. 15: 25-37.
Newman, S. D., Keller, T. A., Just, M. A., 2007.
Volitional control of attention and brain activation in
dual task performance. Human Brain Mapping. 28:
109-117.
Graydon, F. X., Young, R., Benton, M. D., Genik, Ⅱ R. J.,
2004. Posse S, Hsieh L, Green C. Visual event
detection during simulated driving: identifying the
neural correlates with functional neuroimaging.
Transportation Research Part F: Traffic Psychology
and Behaviour. 7: 271-286.
Andersen, R. A., 2011. Inferior parietal lobule function in
spatial perception and visuomotor integration.
Comprehensive Physiology 1: 483–518.
Spiers, H. J., Maguire, E. A., 2007. Neural substrates of
BIOIMAGING 2019 - 6th International Conference on Bioimaging
102

driving behaviour. NeuroImage 36: 245–255.
Mechelli, A., Humphreys, G. W., Mayall, K., Olson, A.,
Price, C. J., 2000. Differential effects of word length
and visual contrast in the fusiform and lingual gyri
during reading. Proceedings of the Royal Society B:
Biological Sciences. 267: 1909-1913.
Anderson, T. J., Jenkins, I. H., Brooks, D. J., Hawken, M.
B., Frackowiak, R. S. J., Kennard, C., 1994. Cortical
control of saccades and fixation in man A PET study.
Brain 117: 1073-1084.
BOLD Signal Change during Driving with Addition Task using fMRI
103
