
New Indicator for Centrality Measurements in Passing-network Analysis
of Soccer
Masatoshi Kanbata, Ryohei Orihara, Yuichi Sei, Yasuyuki Tahara and Akihiko Ohsuga
Graduate School of Informatics and Engineering, The University of Electro-Communications, Tokyo, Japan
Keywords:
Big Data, Data Mining, Graph Mining, Graph Network, Soccer.
Abstract:
A number of fields including business, science, and sports, make use of data analytics. The evaluation of
players and teams affect how tactics, training, and scouting are conducted in soccer teams. Data such as the
number of shots and goals in match results are often used to evaluate players and teams. However, this is not
enough to fully understand the potential of the players and teams. In this paper, we describe a new analysis
method using passing-distribution data from soccer games. To evaluate the performance of players and teams,
we applied graph mining. We also used an index called centrality, which evaluates individual contributions
with an organization. In this research, we propose a new centrality model to improve existing conventional
models. In the calculating the centrality of a given player pair, we consider not only the shortest sequence of
passing but also longer ones. In this research, we verified the significance of these indicators by applying the
data of UEFA EURO 2008, 2012, and 2016. As a result, we found our method to be more consistent with
game results than conventional methods.
1 INTRODUCTION
In recent years, data analysis has been widely used,
and it has enriched our lives. Among its uses in sports,
data analysis is actively performed during games.
This analysis has the influence on team management,
such as the evaluation of teams and players, team tac-
tics, training of players, and scouting of new play-
ers. Another benefit of data analysis is its ability to
provide an alternative viewpoint for sports audiences.
For example, in baseball, Saber Metrics conducts an
objective analysis from a statistical viewpoint, which
has an influence on players’ evaluations and tactics
(Beneventano et al., 2012).
However, conducting an objective analysis in soc-
cer is more complicated. Team play is important
in soccer, and ball possession in a soccer game fre-
quently switches between the offensive and the de-
fensive side. Furthermore, players and teams are of-
ten evaluated by data such as the number of assists
and goals in a game’s results, and the players with
these statistics in the game tend to be highly evalu-
ated. For this reason, we examine not only the players
who scored goals and assists but also the players in-
volved in goals and assists. In addition, by evaluating
players and teams through a more appropriate analy-
sis method, this research can contribute to the team’s
performances using a logical analysis of tactics, eval-
uation of player’s characteristics and abilities.
In this research, we focus on passes that are con-
sidered to lead to goals and assists in soccer, and we
evaluate the players based on them. In particular, by
applying the graph theory, we obtain the sequence of
the passes that ended with the shots. We apply the
concept of centrality in the graph theory to propose
a new evaluation model that improves current con-
ventional models. At the moment, there is no ob-
jective method to show if a criterion of an individual
player’s evaluation is sound. Therefore, we evaluate
the soundness of our model by calculating the accu-
racy of team evaluations based on the model. The
accuracy of the team’s evaluation can be determined
by comparing it to actual game results.
Section 2 introduces conventional research appli-
cations of the graph theory to soccer and the conven-
tional method of centrality. In Section 3, we will ex-
plain a new centrality model that will improve the
conventional method of centrality. In Section 4, we
explain the details of the data and the experimental
method used to verify the usefulness of the new cen-
trality model. We also present the results of our exper-
iment in this section. Section 5 discusses the results.
616
Kanbata, M., Orihara, R., Sei, Y., Tahara, Y. and Ohsuga, A.
New Indicator for Centrality Measurements in Passing-network Analysis of Soccer.
DOI: 10.5220/0007377506160623
In Proceedings of the 11th International Conference on Agents and Artificial Intelligence (ICAART 2019), pages 616-623
ISBN: 978-989-758-350-6
Copyright
c
2019 by SCITEPRESS – Science and Technology Publications, Lda. All rights reserved

2 RELATED WORK
Analysis related to sports have been widely studied,
among them, the application of the graph theory to
passes in a soccer game has been studied. When con-
ducting this research, data called passing distribution,
which records the number of passes as well as the
passer and receiver of the pass in a game, are often
publicly available.
In soccer, a pass that moves the ball to the oppo-
nent’s goal is considered to be an important offensive
move. Therefore, the analysis to create a graph net-
work based on passing distribution has been done by
other researchers. (Goncalves et al., 2017) conducted
a tactical analysis that considers the player’s position-
ings and the passes between players using passing dis-
tribution. They evaluated the performance of teams
participating in international youth games
1
and ar-
gued that players and tactical features are different
when comparing the two. (Cotta et al., 2013) ana-
lyzed the pass tactics of the Spanish national soccer
team of the 2010 FIFA World Cup. They investigated
the games from the quarter-finals to the final, taking
the transition of the number of passes and player’s po-
sitioning into account.
In addition, (Duch et al., 2010) measured central-
ity as a method to evaluate the players and the teams
in games by creating a graph network from passing
distribution. Furthermore, they modified between-
ness centrality used for the centrality measurement
and proposed flow centrality. This is a centrality mea-
surement using data on only the sequences of passes
leading to a shot. They measured flow centrality from
the passing-distribution data of EURO 2008. They
also evaluated each team by simply averaging play-
ers’ evaluations. From the results, they argued that
the team evaluation based on their method reflects the
game’s results better than one based on betweenness
centrality.
Indicators such as betweenness centrality and flow
centrality are used for centrality measurements. Flow
centrality is a method that measures centrality using
data on only the sequences of passes leading to a shot
and highly evaluates athletes who participated in the
scoring opportunity. However, if it is a small num-
ber of sequences in some games, flow centrality may
yields inaccurate measurements.
In this research, we propose a new model to alle-
viate this problem by improving flow centrality. We
also evaluate teams based on the model to show the
soundness of the model. Let us emphasize that pass-
ing distribution only records the number of passes
between players and cannot reproduce sequences of
1
The teams have players under 15 or 17 years of age.
Figure 1: Graph Network Example.
passes with three or more players. However, realiz-
ing the tendency of the sequence from a large number
of passes is possible. Therefore, we will apply and
verify this data in our research.
2.1 Betweenness Centrality
Centrality is an index of the degree of influence that
any node gives to other nodes in a graph network
(Tsugawa and Ohsaki, 2014). This index makes it
possible to estimate an important individual in an or-
ganization. Because soccer places more emphasis on
organizational team play, applying the index would be
appropriate.
Creating a graph network using nodes, edges, and
edge weights is a feasible endeavor. Figure 1 shows
an actual graph network example. When it is applied
to a soccer match, the node is the player, the edge is
the direction of the pass, and the weight of the edge is
the number of passes.
When this concept is applied to the graph theory, it
is possible to measure the centrality of the player node
by calculating how much the player node involved in
the sequence of a specific pass from the graph was
created by passing distribution. In soccer, there is a
consensus that the more passes a player is involved
in, the more contribution to a match she/he makes.
We accept this idea and conduct our study based on
it.
Betweenness centrality is calculated by counting
the number of times a node appears in one or more
shortest sequences of passes between nodes. The
weights of the sequence are the minimum value of the
edge weights. In the example of Figure 1, the shortest
sequence from node 7 to node 1 is 7 → 3 → 2 → 1,
7 → 4 → 2 → 1, 7 → 5 → 2 → 1, and 7 → 6 → 2 → 1.
The edge weights of 7 → 3 → 2 → 1, 7 → 5 → 2 → 1,
and 7 → 6 → 2 → 1 are one. In addition, 7 → 4 →
2 → 1 has the edge weights of three, and the number
of passes of the shortest sequence is three. Therefore,
the number of passes in the shortest sequence from
New Indicator for Centrality Measurements in Passing-network Analysis of Soccer
617
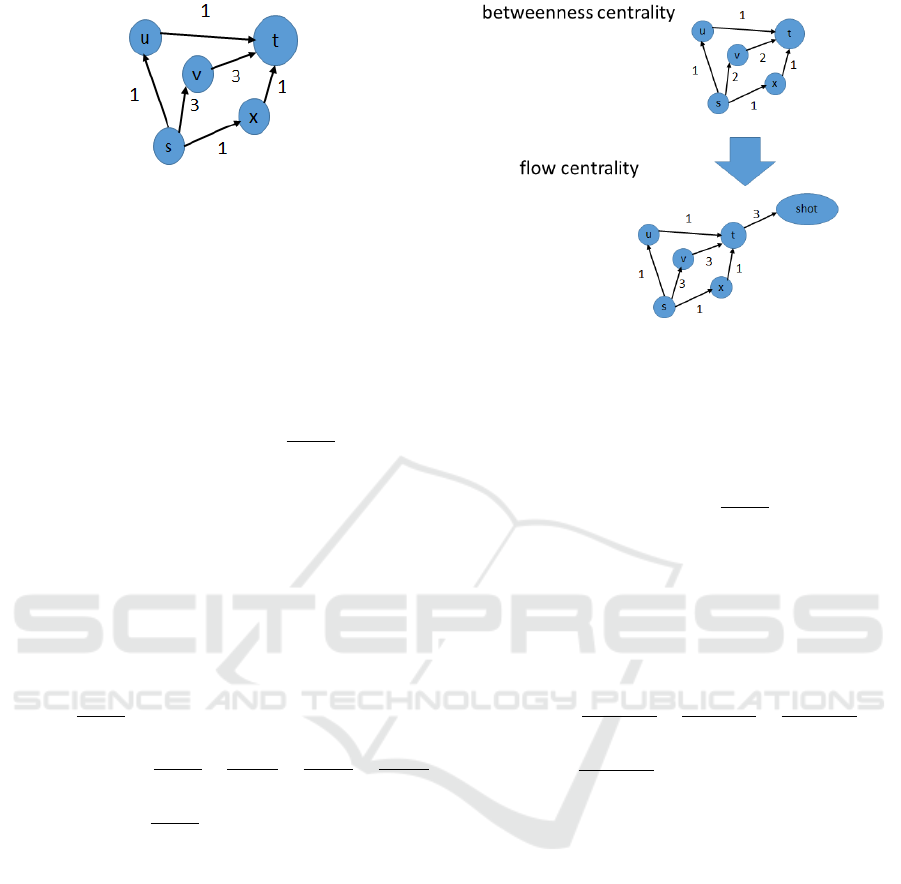
Figure 2: Example of Betweenness Centrality’s Graph Net-
work.
node 7 to node 1 is six.
Let σ
st
be the number of passes in the shortest se-
quence from node s to node t. Let σ
st
(v) be the num-
ber of passes through node v in the shortest sequence
from node s to node t. Betweenness centrality repre-
senting the centrality of the nodes is defined as fol-
lows.
betweenness(v) =
∑
s,t∈V
s̸=v̸=t
σ
st
(v)
σ
st
(1)
Where, V = {1,2, ..., 11 } denotes a set of player
nodes (Barthelemy, 2004). For example, the shortest
sequence from node s to node t in Figure 2 is s →
u → t, s → v → t, s → x → t. In this case, to calculate
σ
st
(v)/σ
st
, the number of edge weights of s → u → t
is one, the number of edge weights of s → v → t is
three, and the number of edge weights of s → x → t is
one. Therefore, we can write equation (2) as follows:
σ
st
(v)
σ
st
= 3/5
betweenness(v) =
σ
st
(v)
σ
st
+
σ
su
(v)
σ
su
+
σ
ut
(v)
σ
ut
+
σ
sx
(v)
σ
sx
+
σ
xt
(v)
σ
xt
= 3/5 + 0 +0 + 0 + 0 = 3/5
(2)
2.2 Flow Centrality
Betweenness centrality is a method to measure cen-
trality from the shortest sequence between nodes, but
when you applied it to soccer, the scoring opportu-
nity to measure centrality between the player nodes is
unclear.
Here (Duch et al., 2010) improved betweenness
centrality. They only treat the process of the short-
est sequence leading to the shots. Specifically, they
newly create the shot node in the graph network and
divide it into a shot on goal and a shot wide, and the
direction of the player’s shot is the edge, and the num-
ber of shots is the weight of the edge (Duch et al.,
Figure 3: Changes in Graph Network from Betweenness
Centrality to Flow Centrality.
2010). Figure 3 exemplifies this. For this reason, they
evaluate the players by considering the opportunity to
score directly. They define flow centrality as follows.
f low(v) =
∑
s∈V
t∈U
s̸=v
σ
st
(v)
σ
st
(3)
Where, U = {12, 13} is the set of shot nodes and
the shot wide node is 12 and the shot on goal node is
13. In Figure 3, to calculate f low(u), we can write
equation (4) as follows:
f low(u) =
σ
s shot
(u)
σ
s shot
+
σ
t shot
(u)
σ
t shot
+
σ
v shot
(u)
σ
v shot
+
σ
x shot
(u)
σ
x shot
= 1/5 + 0 + 0 + 0 = 1/5
(4)
(Duch et al., 2010), who believed that a player’s
degree of influence in the game will have the largest
evaluation in the sequence directly connected to the
goal, arguing that flow centrality can evaluate players
more effectively than betweenness centrality.
3 PROPOSED METHOD
The shortest sequence in flow centrality is determined
by fixing node t as shot nodes. However, in a soccer
game, a team may adopt defensive tactics or maybe
unilaterally attacked during a game. As a result, the
number of shots would be relatively small in these
cases. In applying flow centrality to such games, the
number of the shortest sequence to be calculated de-
creases, and the players involved in the score in the
measurement would be limited.
ICAART 2019 - 11th International Conference on Agents and Artificial Intelligence
618
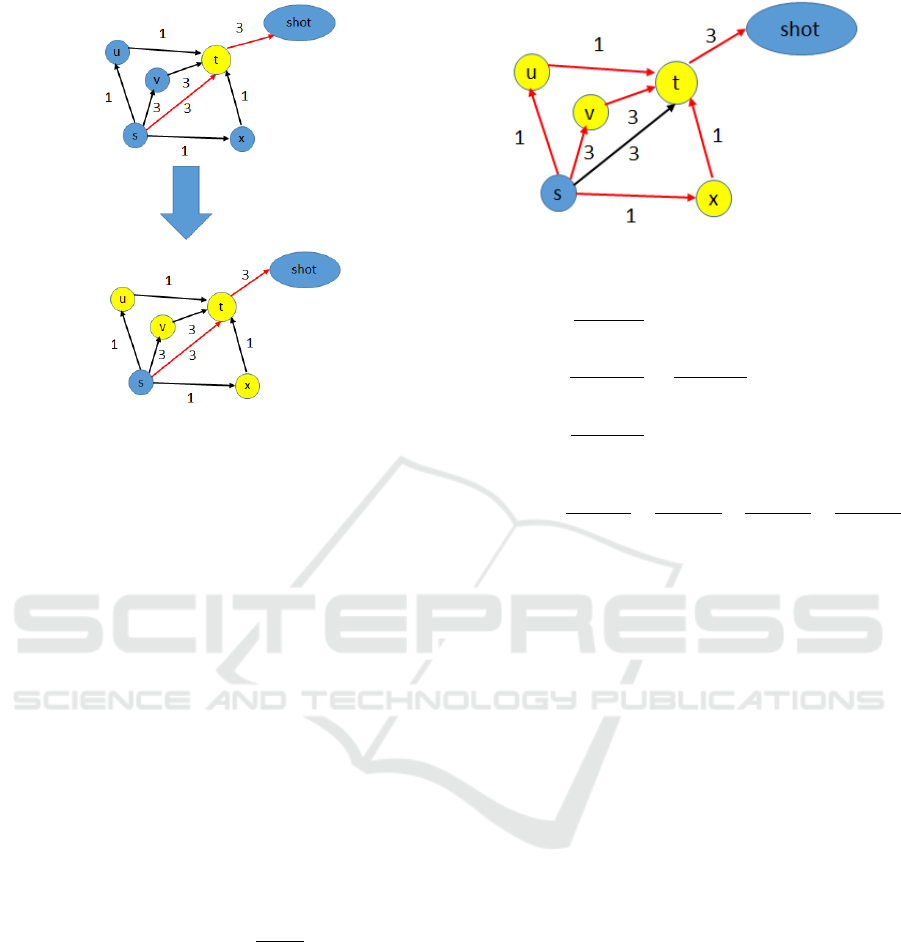
Figure 4: Flow Centrality Problem.
In the example of Figure 4, when flow centrality is
applied, the shortest sequence is s → t → shot. In this
case, σ
s shot
(t)/σ
s shot
= 1 and σ
s shot
(u)/σ
s shot
=
σ
s shot
(v)/σ
s shot
= σ
s shot
(x)/σ
s shot
= 0. Therefore,
the values of nodes u, v, and x, which are involved
in the opportunity of the score, are not evaluated. To
evaluate each player’s contribution to the score, we
need to consider not only node t but also nodes u, v,
and x.
Therefore, in this research, in order to consider
the players involved in the passes leading to the shot,
we increase the number of sequences to be calculated
by searching for a sequence whose sequence length is
l+1, where l is the length of the shortest sequence.
Let σ
′
st
be the number of the sequence with a
length is l+1 from node s to node t. Let σ
′
st
(v) be
the number of sequences through node v in the num-
ber of the sequence whose length is l+1 from node s
to node t. f low
+
is defined as follows.
f low
+
(v) =
∑
s∈V
t∈U
s̸=v
σ
′
st
(v)
σ
′
st
(5)
Figure 5 shows an example of a graph network
created from sequences whose length is l+1.
From this graph network example, sequences with
a length of 1+1 include is s → u → t → shot, s →
v → t → shot, and s → x → t → shot. Therefore, it
is possible to evaluate nodes u, v and x. Furthermore,
we can write equations (6) and (7) as follows:
Figure 5: Flow+’s Graph Network Example.
σ
′
s shot
(t)
σ
′
s shot
= 1
σ
′
s shot
(u)
σ
′
s shot
=
σ
′
s shot
(x)
σ
′
s shot
= 1/5
σ
′
s shot
(v)
σ
′
s shot
=
3
/
5
(6)
f low
+
(t) =
σ
s shot
(t)
σ
s shot
+
σ
u shot
(t)
σ
u shot
+
σ
v shot
(t)
σ
v shot
+
σ
x shot
(t)
σ
x shot
= 1 + 1 + 1 + 1 = 4
(7)
4 EVALUATION EXPERIMENT
4.1 Data Sets
We conducted this experiment using the passing-
distribution data of UEFA EURO 2008, 2012, and
2016. Table 1 shows the details of the data.
“Matches” represents the number of matches in the
tournament, “Teams” the number of teams, and
“Evaluated Matches” the number of games excluding
draws. “Passes attempted” indicates the number of
passes in all games in the tournament, “Passes com-
pleted” represents the number of successful passes of
all games, and “Ave. Passes” indicates the average
number of successful passes. The passing-distribution
data were prepared as public data from FIFA and
UEFA and it can be obtained directly from the web-
sites (FIFA, 2018) (UEFA, 2018).
New Indicator for Centrality Measurements in Passing-network Analysis of Soccer
619

Table 1: Data Details.
Data Sets 2008 2012 2016
Teams 16 16 24
Matches 31 31 51
Evaluated Matches 26 24 42
Passes attempted 23756 27517 44490
Passes completed 17679 19893 37947
Ave. Passes 339 414 744
4.2 Experiment
We examined whether the proposed model is an ap-
propriate measure for the players and teams in the
match. P
A
betweenness
, P
A
f low
, and P
A
f low
+
are arrays of
betweenness, f low, and f low
+
of players in the ini-
tial lineup of team A, where the arrays are sorted in
descending order. We defined the team’s evaluations
in matches in equations (8), (9), and (10). The players
are represented as n ∈ {1, 2, ...,11}.
P
A
betweenness
(n) =
1
n
n
∑
i=1
P
A
betweenness
(i)
(P
A
betweenness
(1) > P
A
betweenness
(2) > ...) (8)
P
A
f low
(n) =
1
n
n
∑
i=1
P
A
f low
(i)
(P
A
f low
(1) > P
A
f low
(2) > ...) (9)
P
A
f low
+
(n) =
1
n
n
∑
i=1
P
A
f low
+
(i)
(P
A
f low
+
(1) > P
A
f low
+
(2) > ...) (10)
(Duch et al., 2010) used team evaluations as the
average of the top n players’ values from the equa-
tions (8), (9) and (10). They calculated this estimate
from the team evaluation and by using the bootstrap
method. As a result, they showed the usefulness of
this method by creating the sample distribution of an
estimate and performing a hypothesis test.
In this research, we set n = 3, 11 based on (Duch
et al., 2010) and verified whether the values of P
A
(n)
and P
B
(n) are directly linked to the outcome of a
match of A versus B. We calculate the accuracy of
our method as the ratio of agreement between the val-
ues of P
A
(n) and P
B
(n) and a match’s outcome agree
(Duch et al., 2010). We did not conduct the evaluation
in the case of a draw.
4.3 Result
The results of our experiments on the data from
EURO 2008, 2012, and 2016 will be described below.
Table 2: Accuracy of Match Results.
EURO 2008 betweenness f low f low
+
P(11) 0.35 0.42 0.46
P(3) 0.35 0.50 0.65
EURO 2012 betweenness f low f low
+
P(11) 0.42 0.46 0.46
P(3) 0.38 0.42 0.42
EURO 2016 betweenness f low f low
+
P(11) 0.59 0.35 0.49
P(3) 0.41 0.35 0.41
Table 2 shows the accuracy of betweenness central-
ity, flow centrality, and flow+ centrality as a ratio of
the level of agreement between the experiment’s ar-
ray values and match outcomes. Furthermore, Table
3, 4, and Table 5 depict P
A
f low
(3) and P
B
f low
(3) as well
as P
A
f low
+
(3) and P
B
f low
+
(3). The country’s name is
expressed in FIFA code, and when the match results
and values do not match, the values are followed by
the letter F (FIFA, 2010).
5 DISCUSSION
Table 2 shows that f low
+
of P shows higher values
than betweenness and f low. Because f low
+
calcu-
lates sequences whose length is l+1, more sequences
leading to the shot are calculated than the conven-
tional model. From this, the player involved in the
sequence that ended with a shot was evaluated. There-
fore, this is considered to be more accurate than the
conventional method. In this research, we verified
f low
+
’s soundness with sequences with a length of
l+1. From now on, it is necessary to estimate the ap-
propriate length of the sequence. It is also necessary
to verify a new index in which both the sequences
with a length of l+1 and the sequences with a length
of l are applied.
Furthermore, in EURO 2012 and EURO 2016, the
accuracy was low overall. The value of f low
+
in P
did not exceed f low in EURO 2012 and betweenness
in EURO 2016. From this result, in order to verify the
cause of mismatch of f low
+
against the outcomes,
we examined the distribution of the value of f low
+
.
As an example of a mismatch of P, Figure 6 shows
the distribution of f low
+
for the match between Italy
and the Republic of Ireland in EURO 2012. Further-
more, Figure 7 depicts the distribution of f low
+
for
the match between Croatia and Spain.
Figure 6 shows an example where Italy won but P
in f low
+
is higher for the Republic of Ireland than for
Italy. The variance of the value of f low
+
for Italy is
4.68, whereas the Republic of Ireland is 15.1, which
ICAART 2019 - 11th International Conference on Agents and Artificial Intelligence
620
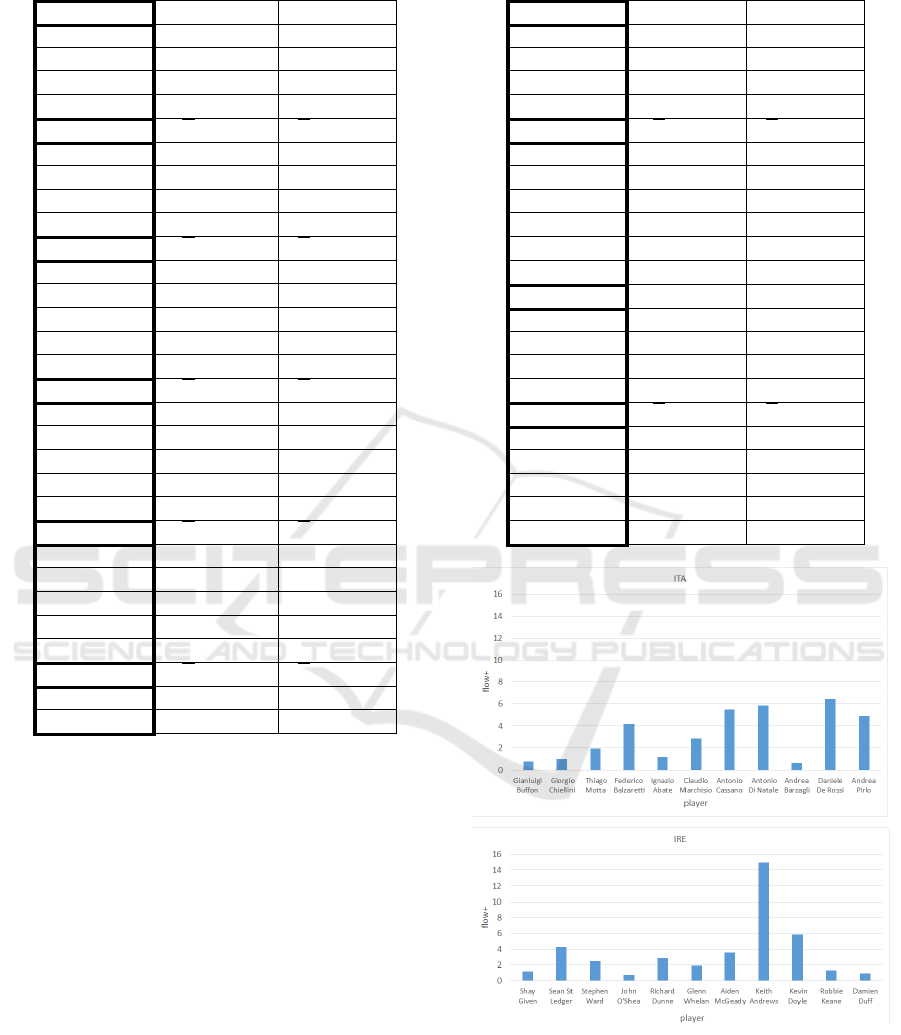
Table 3: Team Evaluation of Each League Game in EURO
2016.
Gr.A P
f low
(3) P
f low
+
(3)
FRA-ROM 3.92-5.82,F 7.05-8.92,F
ALB-SUI 6.33-4.55,F 8.60-7.06,F
FRA-ALB 4.52-6.54,F 7.55-8.70,F
ROM-ALB 5.28-3.62,F 6.84-6.67,F
Gr.B P
f low
(3) P
f low
+
(3)
WAL-SVK 5.11-6.33,F 8.46-8.69,F
RUS-SVK 6.4-4.44 8.42-7.32,F
ENG-WAL 4.24-7,F 7.84-9.98,F
RUS-WAL 4.03-4.38 6.77-6.51,F
Gr.C P
f low
(3) P
f low
+
(3)
POL-NIR 4.24-4.33,F 7.53-4.91
GER-UKR 3.79-6.44,F 6.04-8.18,F
UKR-NIR 3.45-4.33 5.62-6.64
UKR-POL 3.33-4.72 6.18-7.60
NIR-GER 4.79-3.2,F 5.28-5.77
Gr.D P
f low
(3) P
f low
+
(3)
TUR-CRO 4.67-2.27,F 8.22-5.09,F
ESP-CZE 3.40-5.81,F 5.12-8.30,F
ESP-TUR 5-2.67 7.09-4.31
CZE-TUR 4.07-5.61 6.93-7.75
CRO-ESP 3.72-4.61,F 5.91-6.99,F
Gr.E P
f low
(3) P
f low
+
(3)
BEL-ITA 4.34-6 7.06-8.45
ITA-SWE 6.22-3 7.42-4.59
BEL-IRL 4.01-6.83 5.94-8.53
ITA-IRL 2.67-4.18 4.39-7.63
SWE-BEL 4.89-4.11,F 8.33-6.60,F
Gr.F P
f low
(3) P
f low
+
(3)
AUT-HUN 3.94-2.12 6.63-5.96
ISL-AUT 3.83-4.39,F 7.12-6.42
shows that there are variations in the value of f low
+
for the Republic of Ireland.
Although the relative evaluation of each player
does not change depending on f low and f low
+
, we
can observe a phenomenon in which particular play-
ers get extremely high evaluations with f low
+
, result-
ing in a high team evaluation.
In addition, the Croatia versus Spain game in Fig-
ure 7 shows that Spain won, but it is the mismatch of
f low
+
against the outcomes. In this game, the overall
evaluation of the Spanish team is low.
From this, we found that there are mainly two pat-
terns in the trend of f low
+
in cases of inconsistency.
From this point on, we analyzed these two patterns
further and examined the current problem and solu-
tion of f low
+
.
The reason why the value of a specific player, such
as Keith Andrews in the Republic of Ireland in Figure
6, becomes so large is that the number of shots in the
Table 4: Team Evaluation of Each League Game in EURO
2012.
Gr.A P
f low
(3) P
f low
+
(3)
RUS-CZE 3.75-2.72 7.33-5.41
GRE-CZE 5.42-5.33,F 7.07-8.49
CZE-POL 3.3-2.64 5.55-5.11
GRE-RUS 5.67-1.67 7.93-4.65
Gr.B P
f low
(3) P
f low
+
(3)
NED-DEN 2.33-1.71,F 5.49-3.32,F
GER-POR 5.29-4.36 7.59-6.22
DEN-POR 5.25-4.46,F 8.16-7.20,F
NED-GER 3.82-4.2 7.34-5.07,F
DEN-GER 4.22-4.10,F 6.71-5.81,F
POR-NED 3.60-2.88 6.97-5.67
Gr.C P
f low
(3) P
f low
+
(3)
IRE-CRO 4.34-3.84,F 5.49-3.32,F
ESP-IRE 3.11-6.43,F 5.12-6.43,F
CRO-ESP 6.33-4.52,F 8.76-6.51,F
ITA-IRE 2.54-6.17,F 5.94-8.36,F
Gr.D P
f low
(3) P
f low
+
(3)
UKR-SWE 3.56-4.21,F 6.32-6.87,F
UKR-FRA 5.12-3.67,F 7.99-6.52,F
SWE-ENG 3.34-2.75,F 6.96-5.54,F
ENG-UKR 4.12-2.86 7.12-6.27
SWE-FRA 4.44-2.44 7.12-6.1
Figure 6: Flow+ of Italy and the Republic of Ireland.
game is extremely small and the tactics used to spec-
ify a particular player as the destination of passes are
carried out. In the future, when the value of the index
of a specific player becomes large, it would be nec-
essary to discount it. Furthermore, Table 6 shows the
breakdown of the number of shots in a EURO 2008
New Indicator for Centrality Measurements in Passing-network Analysis of Soccer
621
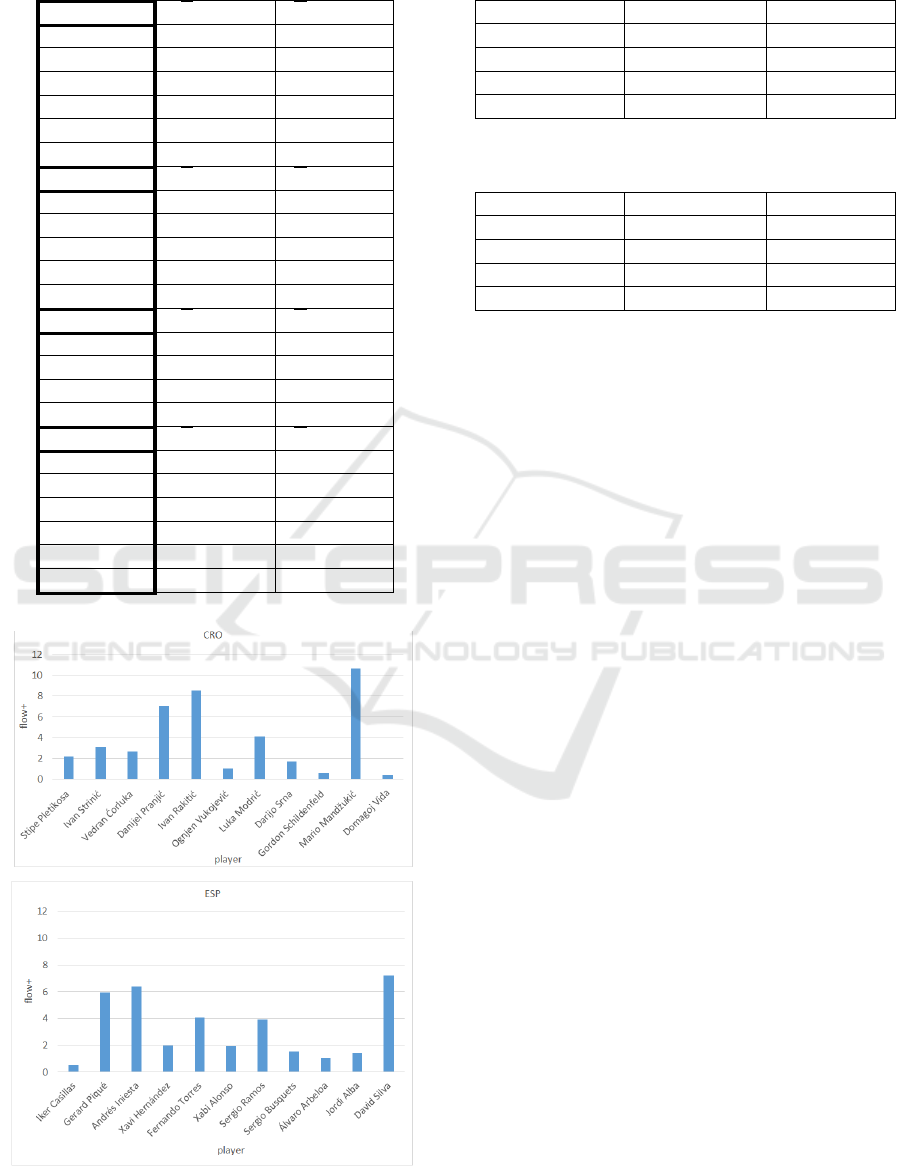
Table 5: Team Evaluation of Each League Game in EURO
2008.
Gr.A P
f low
(3) P
f low
+
(3)
SUI-CZE 4.37-7.83 6.64-8.71
POR-TUR 4.66-3 7.32-4.55
CZE-POR 4.86-4.89 7.4-7.66
SUI-TUR 3.19-4.67 6.88-7.09
SUI-POR 5-5.31,F 8.17-7.94
TUR-CZE 3.9-4.05,F 6.6-6.49
Gr.B P
f low
(3) P
f low
+
(3)
AUT-CRO 4.83-5.12 7.23-7.7
GER-POL 5.67-3.87 8.86-6.98
CRO-GER 3.23-4.22,F 6.38-6.87,F
POL-CRO 4.07-3.51,F 6.45-6.87
AUT-GER 4.72-2.71,F 6.92-5.24,F
Gr.C P
f low
(3) P
f low
+
(3)
NED-ITA 3.27-3.33,F 6.04-5.19
NED-FRA 4.58-3.26 7.24-6.24
NED-ROU 3.68-5,F 6.69-7.18,F
FRA-ITA 5.33-3.57,F 8.33-5.69,F
Gr.D P
f low
(3) P
f low
+
(3)
ESP-RUS 3.57-4.61,F 6.79-7.13,F
GRE-SWE 3.72-3.12,F 6.07-6.25
SWE-ESP 4.33-4.5 5.91-7.26
GRE-RUS 4.97-4.43,F 6.89-7.53
GRE-ESP 4.58-4.73 6.26-8.29
RUS-SWE 2.86-3.2,F 5.95-6.34,F
Figure 7: Flow+ of Croatia and Spain.
Table 6: Breakdown of the Number of Shots in a EURO
2008 Game.
Winning Team Losing Team
Total Attempts 337 287
On-Target 175 121
Off-Target 162 166
Ave. On-Target 6.73 4.64
Table 7: Breakdown of the Number of Shots in a EURO
2012 Game.
Winning Team Losing Team
Total Attempts 347 292
On-Target 195 135
Off-Target 152 157
Ave. On-Target 8.13 5.63
game, and Table 7 shows the breakdown of the num-
ber of shots in a EURO 2012 game. The number of
shots is “Total Attempts”, the number of shots on goal
is “On-Target”, the number of the shots wide is “Off-
Target”, and the number of the average shots on goal
is “Ave. On-Target”.
From Table 6 and Table 7, it can be presumed that
the winning teams are superior in the number of shots,
the number of shots on goal, and the number of the
average shots on goal. From this assumption, it can
be inferred that the number of shots is larger in the
winning team than the defeated team, and the shot ac-
curacy tends to be higher in the winning teams. In
this research, we calculated f low
+
by treating team
A and team B equally. In the future, changing the
edge weight by shots out of the frame or shots in the
frame is a necessary step.
Furthermore, we analyzed the cause of the ten-
dency of values like Spain in Figure 7. f low
+
is
an index that quantifies how much is involved in the
sequence of passes that leads to a scoring opportu-
nity. Figure 8 shows a scatterplot of the number of
shots and the number of passes of the winning team
of EURO 2012, and Figure 9 shows a scatterplot of
the defeated team’s number of shots and number of
passes in EURO 2012.
In Figure 8, Spain’s the number of successful
passes is over four hundred and the number of shots
increases accordingly. In fact, the correlation coeffi-
cient between the number of shots and the number of
passes of the winning team is 0.45, whereas it is 0.63
for the defeated team. From this, we can say there
is a correlation. Based on this, it is thought that the
more the number of successful passes increases, the
more the number of scoring opportunities increases
as well. In Spain, the number of successful passes
is much larger than that of other teams, therefore the
value of f low
+
will most likely not become too large
ICAART 2019 - 11th International Conference on Agents and Artificial Intelligence
622
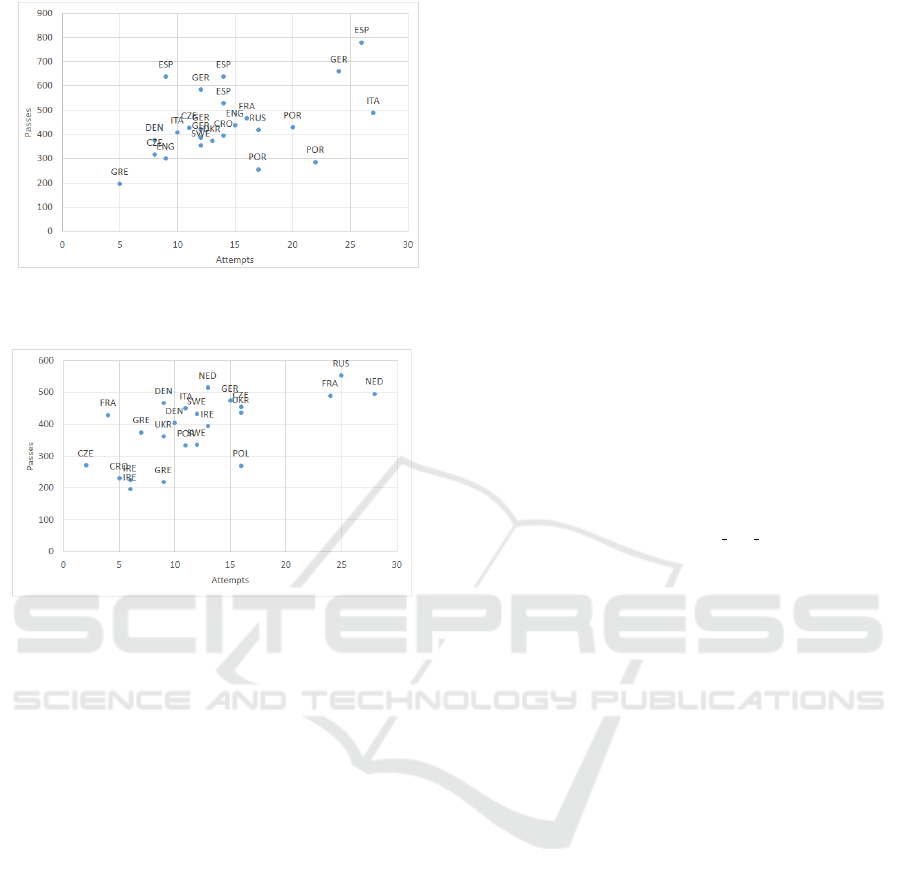
Figure 8: Scatterplot of the Number of Shots and the Num-
ber of Passes of EURO 2012’s Winning Teams.
Figure 9: Scatterplot of the Number of Shots and the Num-
ber of Passes of EURO 2012’s Defeated Teams.
even if the number of shots increases. This can be im-
proved by limiting the number of successful passes to
a certain range.
6 CONCLUSIONS
In this research, we analyzed the contribution of a soc-
cer player in the matches by utilizing graph theory’s
centrality concept from passing-distribution data. As
a result, we found that the proposed model sometimes
has better accuracy than the conventional model. We
were able to verify the soundness of the proposed
model. By improving f low
+
, new indicators may
emerge in future studies. In addition, an objective
method is necessary to show whether the individual
player’s evaluation is sound.
ACKNOWLEDGMENTS
This work was supported by JSPS KAKENHI Grant
Numbers JP16K00419, JP16K12411, JP17H04705,
JP18H03229, JP18H03340, JP18K19835. We ac-
knowledge the professor Shinichi Honiden of the
Waseda University for providing opportunities to
study and the members of our laboratory.
REFERENCES
Barthelemy, M. (2004). Betweenness centrality in large
complex networks. In The European Physical Jour-
nal B pp.163–168.
Beneventano, P., Berger, P., and Weinberg, B. (2012). Pre-
dicting run production and run prevention in baseball:
The impact of sabermetrics. In International Journal
of Business, Humanities and Technology Vol. 2 No. 4
pp.67-75.
Cotta, C., Mora, A., Merelo, J. J., and Merelo-Molina, C.
(2013). A network analysis of the 2010 fifa world
cup champion team play. In JOURNAL OF SYSTEMS
SCIENCE and COMPLEXITY(2013) 26: pp.21–42.
Duch, J., Waitzman, J., and Amaral, L. (2010). Quan-
tifying the performance of individual players in
a team activity. In PLoS ONE 5(6): e10937.
https://doi.org/10.1371/journal.pone.0010937.
FIFA (2010). Fifa’s 208 member associations.
http://www.fifa.com/mm/document/fifafacts/
organisation/52/00/10/fs-120 01a ma.pdf.
FIFA (2018). https://www.fifa.com/.
Goncalves, B., Coutinho, D., Santos, S., Lago-Penas, C.,
Jimenez, S., and Sampaio, J. (2017). Exploring team
passing networks and player movement dynamics in
youth association football. In PLoS ONE 12(1):
e0171156. doi:10.1371/journal.
Tsugawa, S. and Ohsaki, H. (2014). A study on the robust-
ness of centrality measures in network analysis. In
Dai 57 kai zidou seigyo rengou kouenkai ronbunsyu
pp.1072-1077.
UEFA (2018). https://www.uefa.com/insideuefa/
mediaservices/presskits/.
New Indicator for Centrality Measurements in Passing-network Analysis of Soccer
623
