
Evaluating the Process Capability Ratio of Patients’ Pathways by the
Application of Process Mining, SPC and RTLS
Sina Namaki Araghi, Franck Fontanili, Elyes Lamine, Nicolas Salatge, Julien Lesbegueries,
Sebastien Rebiere Pouyade and Frederick Benaben
Industrial Engineering Center of IMT Mines Albi, University of Toulouse, Albi 81000, France
Keywords:
Real-Time Location Systems, Process Mining, Statistical Process Control, Patient’s Pathways.
Abstract:
Learning how patients receive their health treatments is a critical mission for hospitals. To fulfill this task,
this paper defines patients’ pathways as business process models and tries to apply process mining, real-
time location systems(RTLS), and statistical process control (SPC) as a set of techniques to monitor patients’
pathways. This approach has been evaluated by a case study in a hospital living lab. These techniques analyze
patients’ pathways from two different perspectives: (1)control- flow and (2)performance perspectives. In order
to do so, we gathered the location data from movements of patients and used a proof of concept framework
known as R.IO-DIAG to discover the processes. To elevate the performance analyses, this paper introduces
the process capability ratio of the patients’ pathways by measuring the walking distance. The results lead to
the evaluation of the quality of business processes.
1 INTRODUCTION
Healthcare organizations are facing the challenge of
improving the quality of their services continuously
(Rebuge and Ferreira, 2012). Consequently, these or-
ganizations need more knowledge about the executi-
ons of their processes. In the context of digital health,
this paper emphasizes the possibility of enriching the
knowledge of healthcare experts regarding to the real-
time state of patients by analyzing their location data.
The movements of patients inside healthcare orga-
nizations as they are executing different tasks, could
be treated as business process models and defined as
patients’ pathways. To explain this statement, we in-
dicate that the authors in (Vanhaecht et al., 2010) de-
fined the term of care pathway as a complex inter-
vention for the mutual decision-making and organi-
zation of care processes for a well-defined group of
patients during a well-defined period. It has also been
signified that the aim of these care pathways is to en-
hance the quality of care across the continuum by im-
proving risk-adjusted patients’ outcomes, promoting
patient’s safety, increasing patient’s satisfaction, and
optimizing the use of resources. Based on these defi-
nitions and applied analyzing techniques in this paper,
it could be inferred that patients’ pathways can be ca-
tegorized as care pathways too.
On the other hand, each patient’s pathway con-
sists of the sequence of events, several steps, deci-
sion points, actors, and activities with the objective of
delivering health care to the patients. Consequently,
one could conceive these pathways as business pro-
cess models. Similarly, Dumas et al mentioned in
(Dumas et al., 2013) , a business process could be
seen as a mean that organizations use to deliver a ser-
vice or product to clients and it is constructed from
several decision points, sequences of activities, and
actors’ interactions.
As a service organization, a hospital needs to en-
sure about the quality of its services. Primarily, the
quality of hospitals’ services are evaluated by the du-
ration of their processes and activities. In this paper,
we evoke the idea of using the distance of patients’
pathways as a variable for assessing the quality of ser-
vices. There are several motives behind this choice.
For instance, there are several risks regarding transfer-
ring a critically ill patient. These distances should be
monitored precisely in order to be either minimized
or stabilized. Needless to mention that the duration of
processes could be correlated to the distance a patient
should take inside the facility. Additionally, thanks
to the proposed methods here, hospitals can acquire a
target value for monitoring the distance of patients’
pathways. This could lead to the detection of varia-
tions within patients’ processes and consequently en-
hancing the quality of processes.
302
Namaki Araghi, S., Fontanili, F., Lamine, E., Salatge, N., Lesbegueries, J., Rebiere Pouyade, S. and Benaben, F.
Evaluating the Process Capability Ratio of Patients’ Pathways by the Application of Process Mining, SPC and RTLS.
DOI: 10.5220/0007380803020309
In Proceedings of the 12th International Joint Conference on Biomedical Engineering Systems and Technologies (BIOSTEC 2019), pages 302-309
ISBN: 978-989-758-353-7
Copyright
c
2019 by SCITEPRESS – Science and Technology Publications, Lda. All rights reserved

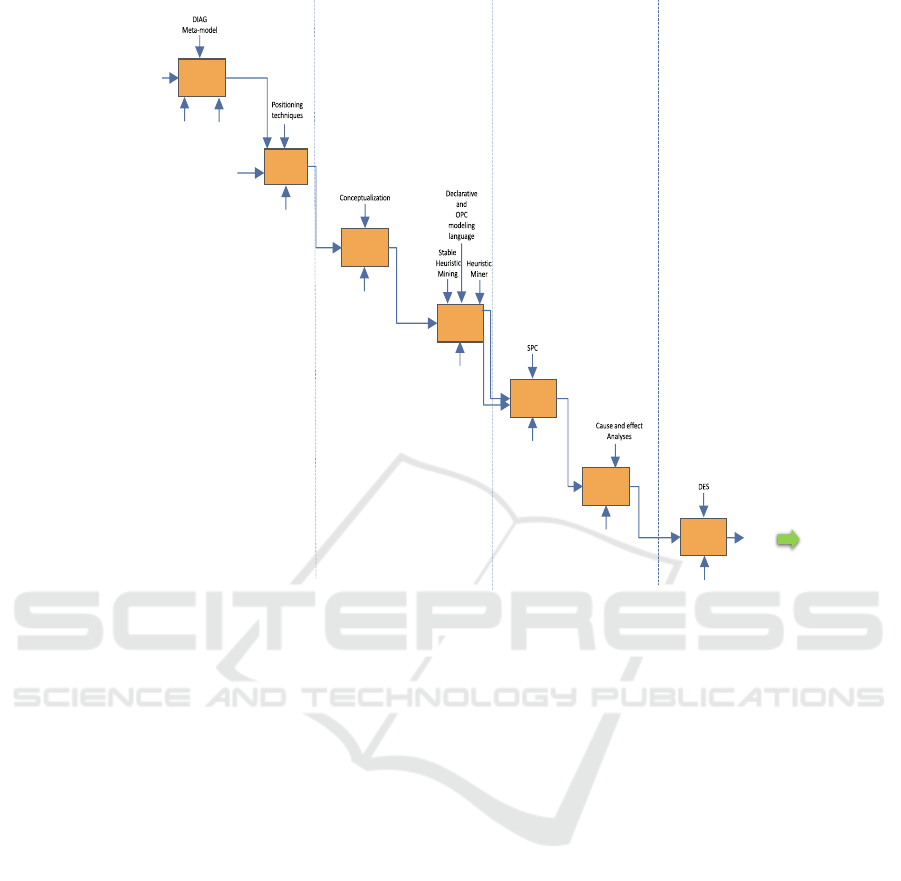
This paper uses DIAG approach in order to extract
comprehensive knowledge from patients’ pathways
within hospitals. This approach which has been
shown in figure 1 is an updated version of the pre-
vious one in (Araghi et al., 2018). It consists of seven
main functions, that could be executed through four
different states. These states are Data state, Infor-
mation state, Awareness, and Governance. The se-
ven functions in this approach would accomplish a
goal which is transforming the location data of the
patients into decisions. This approach is being de-
veloped within R.IO-DIAG application. Each state
of the approach encompasses one or several functi-
ons. The first function is the configuring the envi-
ronment and the systems. This function is concerned
with installation of location systems and importing
the primary information into the R.IO-DIAG appli-
cation. These information are: identifying zones of
the experiment, patient’s information, and functions
that could be executed in certain zones. The second
function is the location data gathering. After obtai-
ning the primary event logs (cf figure 2(a)) a series of
interpreting rules have been devised in order to extract
the corresponding activities at each zone of a hospital.
A more detailed illustration of this function is inclu-
ded within (Namaki Araghi, 2018) article. After re-
ceiving the interpreted data, the list of un-linked acti-
vities would go within the process modeling function.
Thanks to several process mining algorithms, a car-
tography of process models will be discovered and
presented by declarative modeling languages or the
OPC modeling language. These models and its me-
trics (time and distance) will be studied by the process
analyzing function. After detecting the variations of
process models, a series of cause and effect diagnoses
will be performed in the process diagnosing to extract
the cause of those variations. Finally, at prognosing
function, thanks to discrete event simulation (DES)
several scenarios will be generated for choosing the
best scenario to improve the processes.
The next section provides an overview of process
mining, RTLS and the related works. However, the
third section presents the main focus of this paper
which is on the analyzing function of DIAG appraoch,
where we aim at evaluating the capability of processes
in order to ensure the quality of services. The fourth
section evaluates and illustrates the research work by
an experiment. Finally, the last section concludes the
paper.
2 BACKGROUND
There are two problematics that motivate experts to
consider patients’ pathways as business processes.
These problematics are social and technical. Con-
cerning the social aspect, Guardian issued a study in
UK (Pinchin, 2015) based on data from 2013 that
approximately 7 million hospital appointments have
been missed due to patients being lost in the facilities
and each costs on average £108. The impact of faci-
lity design on patients’ safety is a serious issue and
is related to the distance that patients walk in the fa-
cility. Therefore, monitoring the distance traveled by
patients helps hospitals to reduce these errors. Alt-
hough, measuring the exact value is only attainable
by using proper techniques and technologies such as
RTLS.
In the context of smart healthcare, the application
of RTLS is growing rapidly as a prerequisite. These
systems consist of three main components that com-
municate with each other thanks to radio-frequency
signals. The first component is a tag which could be
attached to each object that need to be located. An-
tennas are the second component. They find the po-
sition of the tags over the location area. The third
component is a location engine. This software uses
different types of algorithms and localization techni-
ques to calculate the positions of tags. Some of these
techniques are: triangulation, trilateration, Angle of
Arrival (AOA), Time Difference of Arrival (TDOA),
and Received Signal Strength Indicator (RSSI) (Co-
tera et al., 2016).
2.1 Process Mining
Recently, the application of process mining has been
developed in the context of healthcare (Rojas et al.,
2016) as an evidence-based methods to provide a fast,
automatic and efficient way to map the processes.
The concentration of process mining is on discove-
ring knowledge from event logs which are registered
in an information system. Nowadays, the knowledge
generated by process mining is based on three acti-
vities: process discovery, conformance checking and
enhancement of business processes (Aalst, 2016). Se-
veral researchers have defined process mining as a
practice which is being derived from the field of data
mining (Tiwari et al., 2008). However, Van der Aalst
defines process mining as a bridge between process
science and data science (Aalst, 2016). He identi-
fies that process mining and data mining both start
from data, however, data mining techniques are not
typically “process-centric”. Concerning process mi-
ning in healthcare, it mainly received attentions to-
Evaluating the Process Capability Ratio of Patients’ Pathways by the Application of Process Mining, SPC and RTLS
303
1
Configuring
the
environment
& systems
2
Location data
gathering
3
Data
Interpreting
4
Prcoess
Modeling
5
Process
Analyzing
6
Process
Diagnosing
7
Process
Prognosing
Layout map
+
Environment
characteristics
+
Zone
functionalities
+
Functions
characteristics
+
Actors
characteristics
R.IO-DIAG
Localization
systems
Primary
Event-logs
Localization
Systems
Interpreted events
corresponding to
the activities
Patients’
pathways
R.IO-DIAG
R.IO-DIAG
Variations
Performance
evaluation
(Quantititative
analyses)
R.IO-DIAG
Detected
causes
R.IO-DIAG
Scenarios
Data State
Awarensess
Information
State
Governance
Location
data
interpreting
rules
Objects'
movements
Individual
OPC’s
+
Time and
distance
Decision
Environment’s
Identified
and Categorized
(existing) information
Figure 1: DIAG approach for extracting knowledge from location event logs.
wards designing and applying discovering algorithms.
The enhancement and performance analysis are part
of process mining techniques that have not evolved
significantly mainly in the area of patients’ pathways
(Partington et al., 2015). The focus of this paper is
on this gap. Therefore, the question for this research
work is: how hospitals can measure the quality of pa-
tients’ pathways?
Most of the applied methodologies in this area
contain three main activities: (i)cleaning and prepa-
ring the data, (ii) using discovery algorithms and (iii)
analyzing strategies (Rojas et al., 2016). As exam-
ples of these works, the authors in (Partington et al.,
2015) performed a research in Australia to evaluate
the performance of a care pathway in different hospi-
tals. They analyzed the processes based on the num-
ber of patients who have been admitted, the throug-
hput time of activities and the frequency of used he-
althcare procedures. They also provided an evaluation
of process mining literature in healthcare. Authors
highlighted a large gap among process mining activi-
ties. Based on their evaluation, only 3.5 % of research
works are concerned with performance evaluation and
enhancement of processes. They indicated that 82 %
of works are oriented towards process discovery and
22% are related to conformance checking. The asso-
ciation of process mining and RTLS did not receive a
lot of attention. However, it showed promising results
in previous works. In this regard, the current appro-
aches are highly dependent on the type of the con-
figured location system. In (Fernandez-Llatas et al.,
2015), Fernandez-Llatas et al. defined seven steps to
transform location data in order to reach an enhan-
cement phase of processes. These steps have been
defined in the context of a tool which transforms the
location data into the model-based analysis. They il-
lustrated their research by the PALIA-ILS SUITE ap-
plication (http://pmuc.ing.puc.cl/). In (Yang and Su,
2014), Yang and Su, reviewed the same mentioned
works in (Fernandez-Llatas et al., 2015) and empha-
sized the need to improve the performance evaluation
aspect of their work.
Most of these research works focused on the
control-flow perspective. The main interest was to
map the patients’ pathways through process disco-
very. However, this paper expands this area by adding
quantitative analysis. This would help experts to not
only have a vision of the processes’ executions, but
also to acquire a real-time performance perspective of
the patients’ pathways by controlling the variations
within processes.
HEALTHINF 2019 - 12th International Conference on Health Informatics
304

3 METHOD
To fill the mentioned gaps, this work tends to ex-
tend the DIAG approach presented in (Araghi et al.,
2018) by adding control charts and process capabi-
lity analysis to a process mining application in order
to analyze the real-time location data and quality of
patients’ pathways. This approach supports the per-
formance and control-flow perspectives of a process
mining application in healthcare.
3.1 Statistical Process Control(SPC)
SPC is a powerful collection of problem-solving tools
useful in achieving process stability and improving
capability through the reduction of variations in the
process. SPC has already made its way into the healt-
hcare sector (Thor et al., 2007). However, it has been
used mainly for analyzing biological experiments but
not in a sense of analyzing patients’ pathways. The
Shewhart control charts are one of the most sophi-
sticated techniques of SPC. A typical control chart
has three indicators which are known as center-line
(CL), upper control limit (UCL), and lower control li-
mit (LCL). These lines are being represented in the
charts as horizontal lines. The UCL and LCL are in-
dicating that if a process is in control, then nearly all
of the sample points would fall between them. As
long as all of the points of the samples are between
LCL and UCL, no action is necessary. But, if a point
falls beyond those limits, it could be inferred that the
process is out of control due to the high level of va-
riations. Therefore, some inspections on different as-
pects of the process are required. There are several
types of control charts, such as ¯x chart, R-chart (range
chart), P-chart, and C-chart. The application of each
of these charts depends on the types of data and ana-
lysis that one could require. In this research work, ¯x
and R charts will be used since the outcomes are ba-
sed on two types of numeric data: Time and Distance
of patients pathways. In followings, the mathematical
principles for constructing the control limits will be
presented.
Let ¯x
1
, ¯x
2
,.., ¯x
m
, be the average values of the sam-
ples, then the process average is the grand average (
¯
¯x):
¯
¯x =
¯x
1
+ ¯x
2
+ .. + ¯x
m
m
(1)
If the range of each sample equals to R then:
R = x
max
− x
min
(2)
Now letR
1
, R
2
, ..., R
m
be the ranges of samples then the
average range of process is:
¯
R =
R
1
+ R
2
+ ... + R
m
m
(3)
The control limits to construct the ¯x and R-charts are
as follows:
UCL
¯x
=
¯
¯x + A
2
¯
R UCL
R
=
¯
RD
4
CL
¯x
=
¯
¯x CL
R
=
¯
R (4)
LCL
¯x
=
¯
¯x − A
2
¯
R LCL
R
=
¯
RD
3
The constant A
2
, D
3
, and D
4
in (4) changes based
on the size of the samples. These constants exist in
most of the mathematical statistics references (Jogle-
kar, 2005).
3.1.1 Process Capability Ratio
Another method to analyze the performance of pro-
cesses is in terms of process capability ratio (PCR)
or C
p
. PCR is a statistical metric for making a com-
parison between the output of a process and with the
specifications limits of the process. A process which
all of its outcomes fall between the specification li-
mits is considered as a capable process. For exam-
ple, if hospitals define certain specifications as the ex-
pected length of stay for patients’ pathways; C
p
ratio
helps them to evaluate their performance. PCR ana-
lysis could be defined by adjusting two new limits as
Upper Specification Limit (USL) and Lower Speci-
fication Limit (LSL). These limits are specifications
relevant to the quality characteristics that one desires
to analyze (such as reliability of a process). In this re-
search work, the USL and LSL could be defined ma-
nually by the healthcare experts, or be calculated by
analyzing the distribution of the gathered data. Equa-
tion (5) shows the mathematical expressions to calcu-
late C
p
. Where σ is the standard deviation of samples.
Equation (6) shows how to calculate the specification
limit regarding to the distribution of the data.
C
p
=
USL − LSL
6σ
(5)
USL =
¯
¯x + 3σ
LSL =
¯
¯x − 3σ (6)
C
p
could have three states, which help experts to ana-
lyze the capability of the As-Is processes: If C
p
< 1;
it means that process is using up more than 100 %
of the tolerance band which means the process is not
capable to provide the desired outcome continuously.
If C
p
= 1; it means that process is using 100% of its
tolerance band. This implies that process may pro-
vide some undesirable outcomes, but statistically is
predictable and capable of satisfying the current spe-
cification defined by the organization. If C
p
> 1; the
process is using much less than 100 % of its tolerance
band. As a result, relatively few undesirable outcomes
could be produced by the process. These analyses can
be seen concretely by the description of the study case
in the next section.
Evaluating the Process Capability Ratio of Patients’ Pathways by the Application of Process Mining, SPC and RTLS
305

4 CASE STUDY AND THE
EXTRACTED RESULTS
To validate this approach, an experiment in a hos-
pital living lab has been conducted. In this regard,
R.IO-DIAG application has been developed within
R.IO SUITE platform (https://research-gi.mines-
albi.fr/display/RIOSUITE/R-IOSuite+Home) as a
proof of concept, and for the illustration of the
results. This tool receives the location data, refines
them and generates business process models with the
addition of robust statistical analyses and diagnoses.
The results of this study case are the outcomes of two
core functions of DIAG approach: process modeling
and analyzing. This experiment had been carried
out during ten days, and 150 patients have been
monitored. They have been divided into 10 samples
with the unique size of 15. These patients had similar
profiles regarding which health care procedure they
required. Event logs from the RTLS have been
generated by the location engine with the JSON
format. Each event contains several information
such as event ID, time-stamp of entering a zone or
exiting one, location data and other complementary
data such as room temperature, humidity and tag’s
battery level. Figure 2 shows an example of patients
tracking view and the primary event logs. To perform
process discovery, a set of complex event processing
rules have been defined based on DIAG reference
model (Namaki Araghi, 2018). This reference model
helps to identify which types of activities could
happen in a certain zone. The details of these rules is
within location data interpreting function of DIAG,
which are evoked in (Namaki Araghi, 2018). After
gathering the location data of pathways, the modeling
function is the next step to gain a view on the way
processes are being executed.
4.1 A Control-flow Perspective
The first step to obtain a model-based analysis of pa-
tients’ pathways is to perform automatic process dis-
covery. There are several existing process discovery
algorithms (Augusto et al., 2017). DIAG uses sta-
ble heuristic mining algorithm since it can be app-
lied for a collective modeling of pathways (describing
the algorithm in detail is beyond the limits of this
article). As it has been shown in figure 3 a qualita-
tive analysis can be extracted by illustrating patients’
pathways as process models. After analyzing the mo-
del, it has been indicated that most of the cases in the
model have ignored one important step in their pro-
cesses. This step was the "UROLOGY_checkout".
The primary diagnosis indicated this could be due
to the long waiting period at the "waiting area for
checkout_UROLOGY". Such qualitative analysis can
be more useful for the organizations if it is being sup-
ported by quantitative analyses too. Existing mathe-
matical analyses within process mining tools do not
evaluate the quality of processes. The performance
perspective section of this paper targets this proble-
matic.
4.2 The Performance Perspective
It is obvious that the pathways could differ for each
patient. However, it is a non-trivial task for hospi-
tals to offer a stable service quality to patients. As
Montgomery emphasizes in (Montgomery, 2007), the
quality of services which patients are conceiving is
directly influenced by the stability of processes. Du-
ring this experiment, we encountered that patients did
not have problems with the waiting times or length of
pathways in particular but they expressed their dis-
satisfaction when they had to spend longer periods
of time than expected in order to perform certain
tasks. Additionally, they had difficulties for finding
the rooms in the hospital. Therefore, we proposed to
use process control charts to enhance the performance
by discovering and diagnosing the variations.
Since the control limits on the ¯x-chart (Figure 4b)
depend on the process variability, it is ideal to begin
with the R-chart(Figure 4a). Unless the process vari-
ability is in control, these limits (in ¯x-chart) will not
have much meaning (noa, ) and the process is already
out-of-control.
The R-chart helps to ensure the stability of the ex-
tracted data. The CL is the average of all the sub-
groups’ ranges. The other control limits are set by a
distance of 3σ (standard deviation) above and below
the center line. These thresholds define the limits for
expected variations in the subgroups ranges. The fi-
gure 4a shows R-chart for analyzing the range of dis-
tances for patients’ pathways. Based on the stability
in ranges, we may now construct the ¯x-chart presen-
ted in figure 4b. This figure presents the instability
of the average traveled distance by patients. The red
points in the ¯x-chart indicate that within three days
of the experiment, there were some assignable causes
that affect the distance of pathways for the patients.
These variations in the process have been investiga-
ted by the help of healthcare professionals. Because
of an increase in the number of admitted patients on
those days, the department had the lack of resources
to perform medical examination for all the patients.
Therefore, nurses asked some patients to report their
problems to other exam rooms in the hospital. This
caused the traveled distance of some pathways exceed
HEALTHINF 2019 - 12th International Conference on Health Informatics
306
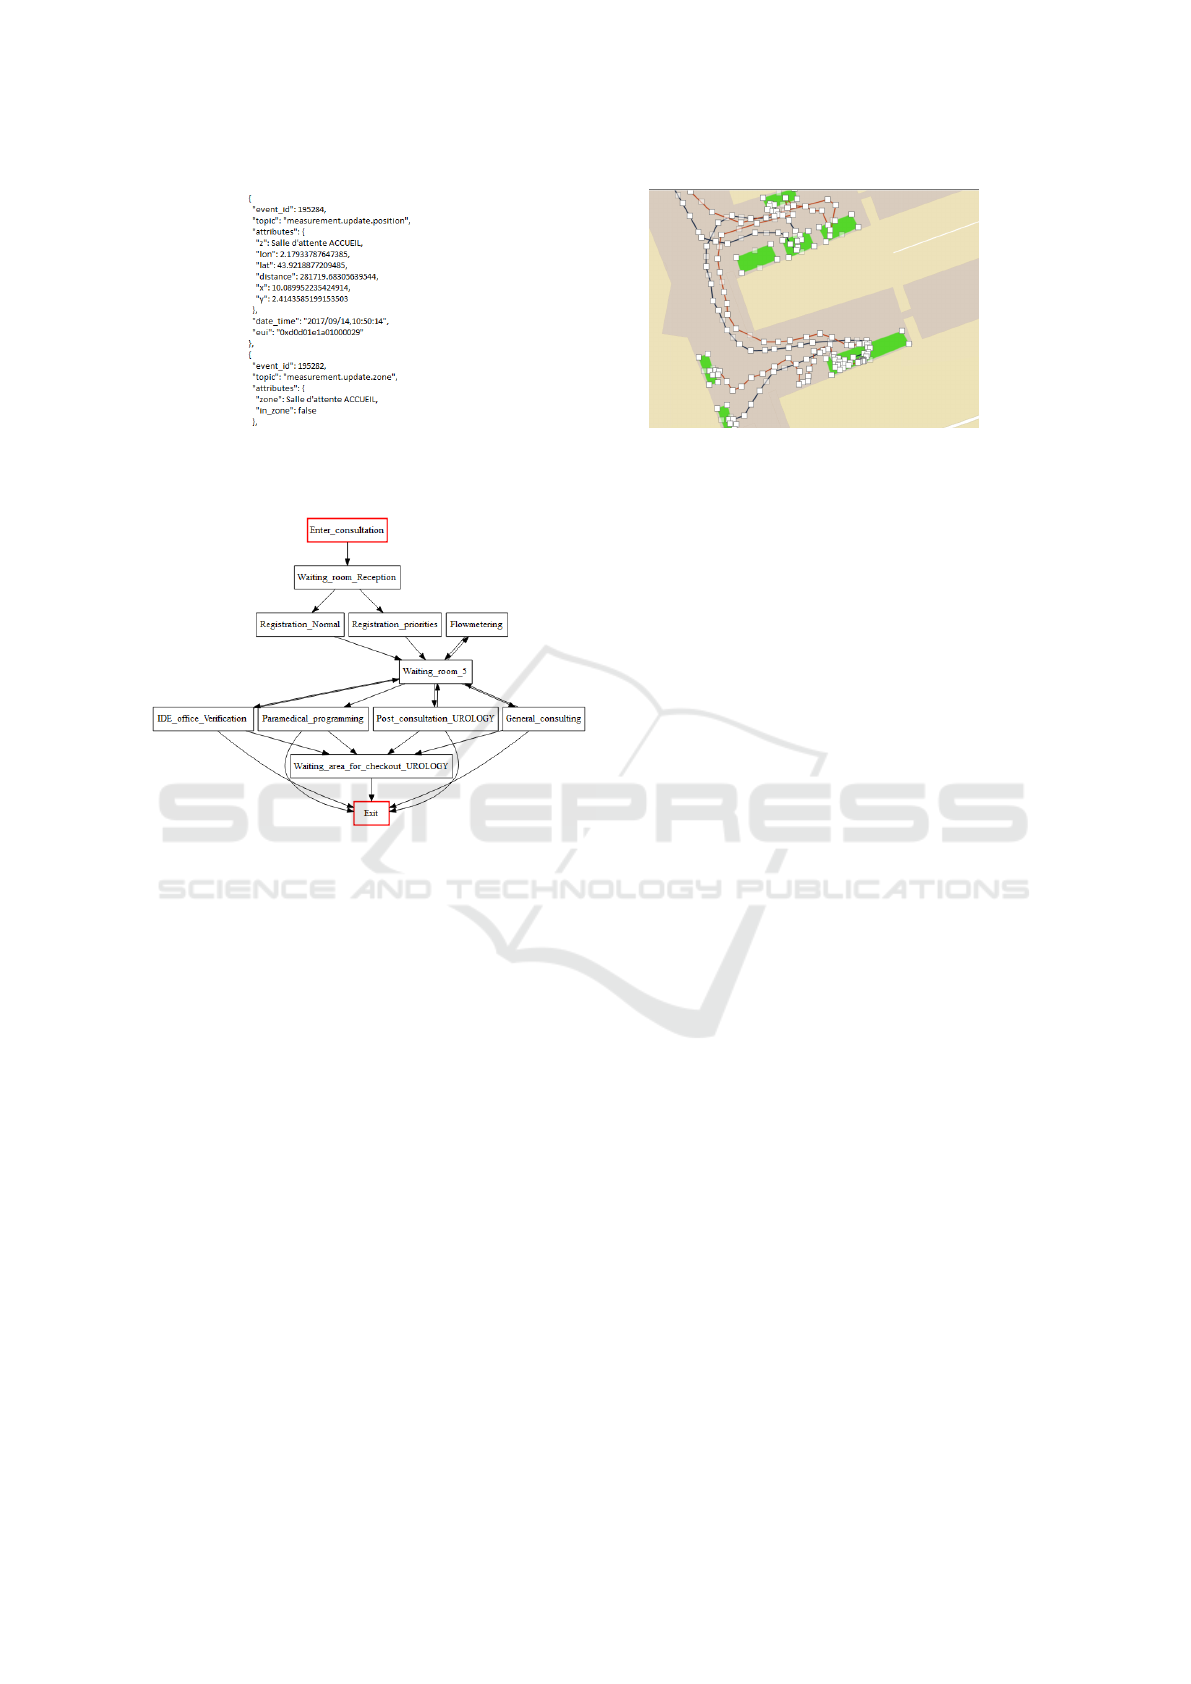
(a) An example of the primary event log. (b) A view on the movement of the patients.
Figure 2: Primary results of tracking patients by RTLS.
Figure 3: The extracted process model by R.IO-DIAG.
from the norm value. Consequently, this issue led to
an instability in the process.
The length of patient’s pathway is a practical indi-
cator for the capability of a hospital in providing effi-
cient services. The reason could be seen as the effect
on the length of stay in the hospital. Also, it influen-
ces the efficiency of providing emergency treatments
to the exact location of a patient with a critical sta-
tus. Thus, this research work seeks different means to
analyze the capability of processes based on the defi-
ned CTQ (Critical To Quality) specifications. These
specifications (USL, target, LSL) either are defined
by the health professionals or could be adapted from
the way patients are moving in the hospital. Figure 5
presents the results on process capability ratio (C
p
) of
the experiment.
There are several points that should be inferred
from the PCR analysis; first of all, this chart consists
of two specification limits that show the possible mar-
gins for the length of pathways. As it has been shown
in figure 5, there are processes that have the distance
higher than USL and lower than LSL. These proces-
ses are not satisfying the targeted specifications. The
hospital’s experts have defined an USL of 220 meters
provisionally. The LSL has been adapted automati-
cally from the current state of processes with the de-
fined formula in 6. The C
p
is less than 1 which shows
that processes are being executed in an inefficient way
and they are not meeting the expectations. As it has
been shown, approximately 5 % of patients are wal-
king more than the upper specification limit. Note that
C
P
l, and C
P
u, demonstrate the performance of proces-
ses near to the lower specification limit and the upper
specification limit. C
P
k illustrates the capability of the
process when the average of the samples are not well-
centered. C
pm
measure could be useful if we want to
use the average value as the target to reach. C
pm
could
be applied to monitor the difference between the tar-
get value and the average of the results. For instance,
the target in this chart has been identified as 135.115
meters. However, the average length of pathways is
different (Center = 155.04). As process average mo-
ves off of the target, C
pm
grows greater. This would
help to further analyses and diagnoses. The same ana-
lysis are applicable and have been done for the dura-
tion of processes which their explanations are beyond
the scope of this article. Relevant to the "enhance-
ment" activities of process mining paradigm, the pre-
sented methods can provide applicable means in order
to detect the process variations from the outcomes of
the processes.
5 CONCLUSIONS
This paper aimed at addressing several issues regar-
ding monitoring of patients’ processes in healthcare
organizations.
• Firstly, it emphasizes the need to consider pa-
tients’ pathways as business processes. Then
it provides technical and technological means to
monitor these pathways. The advantage of this
approach is related to a shorter period of data ex-
traction and the accuracy level of extracted data.
Evaluating the Process Capability Ratio of Patients’ Pathways by the Application of Process Mining, SPC and RTLS
307
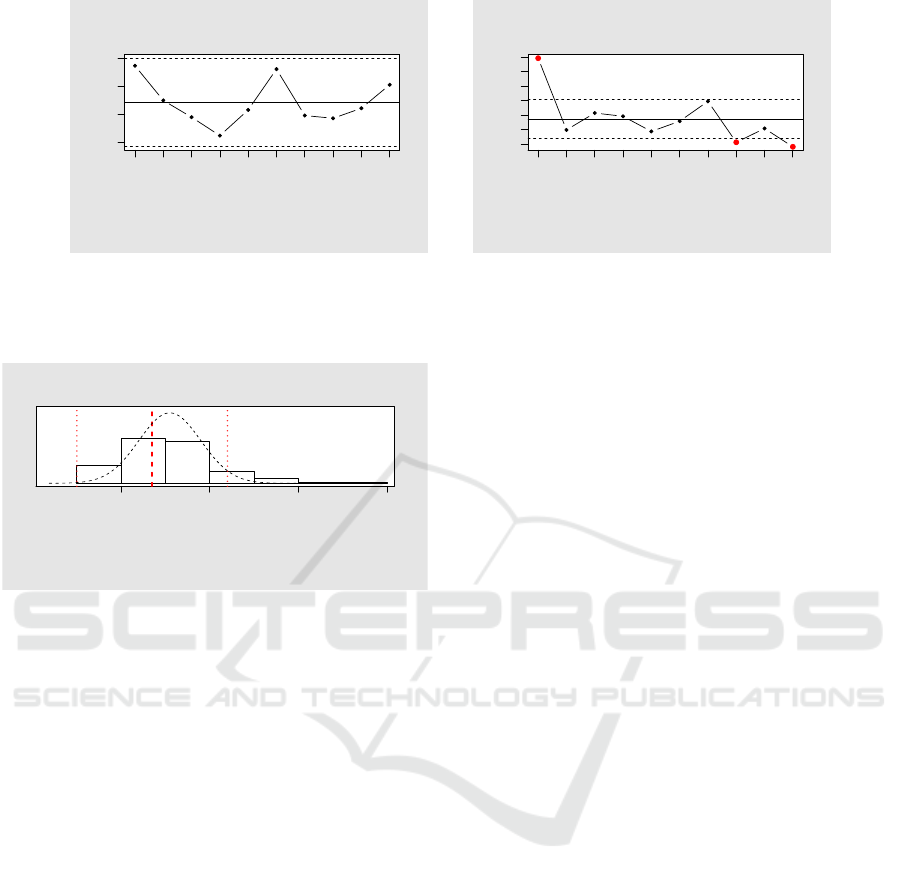
Group
Group summary statistics
1 2 3 4 5 6 7 8 9 10
50 100 200
R Chart
for Distance_Of_Patients_Urology
LCL
UCL
CL
Number of groups = 10
Center = 121.3
StdDev = 34.93664
LCL = 42.04047
UCL = 200.5595
Number beyond limits = 0
Number violating runs = 0
(a) Analyzing the variations of pathways’ length
Group
Group summary statistics
1 2 3 4 5 6 7 8 9 10
120 160 200 240
xbar Chart
for Distance_Of_Patients_Urology
LCL
UCL
CL
Number of groups = 10
Center = 155.04
StdDev = 34.93664
LCL = 127.9782
UCL = 182.1018
Number beyond limits = 3
Number violating runs = 0
(b) The ¯x-chart to monitoring the stability of pa-
tients’ pathways
Figure 4: Control charts analysis related to the distance of pathways.
100 200 300 400
Process Capability Analysis
for Distance_Of_Patients_Urology
LSL USLTarget
Number of obs = 150
Center = 155.04
StdDev = 34.93664
Target = 135.115
LSL = 50.23008
USL = 220
Cp = 0.81
Cp_l = 1
Cp_u = 0.62
Cp_k = 0.62
Cpm = 0.704
Exp<LSL 0.13%
Exp>USL 3.1%
Obs<LSL 0%
Obs>USL 5.3%
Figure 5: Evaluation of the process capability by the length
of patients’ pathways.
• Moreover, the presented approach provides a new
sight to evaluate the capability of patients pro-
cesses based on the traveled distance of their
pathways. To the best of our knowledge regarding
the literature, analyzing the stability and capabi-
lity of patients’ processes by the traveled distance
of their pathways have never been done.
• Most of process mining research works are focu-
sing on a challenge of how to discover a proper
and fitting process model, which is an inevitable
task. However, in this paper we tried to give an
extra attention to the enhancement phase of pro-
cess mining which we believe is necessary in or-
der for process mining to become more applicable
for healthcare organizations.
In this paper care-flow and performance perspectives
are provided thanks to the framework of R.IO-DIAG
which is exclusively being used to extract business
process models from location data.
As it has been introduced, R.IO-DIAG applies dif-
ferent statistical process monitoring techniques which
are not being used in other process mining packages.
Thanks to these techniques, it is possible to moni-
tor and reduce the variability of patients’ pathways,
which could lead to the quality improvement of pro-
cesses.
After analyzing the patients’ pathways and high-
lighting the shortcomings of the processes, the future
perspective of this research work is to provide an au-
tomatic diagnosis of the processes.
REFERENCES
Aalst, W. M. P. v. d. (2016). Process Mining: Data
Science in Action. Springer. Google-Books-ID: hU-
EGDAAAQBAJ.
Araghi, S. N., Fontanili, F., Lamine, E., Tancerel, L.,
and Benaben, F. (2018). Applying Process Mining
and RTLS for Modeling, and Analyzing Patients’
Pathways. pages 540–547.
Augusto, A., Conforti, R., Dumas, M., La Rosa, M., Maggi,
F. M., Marrella, A., Mecella, M., and Soo, A. (2017).
Automated Discovery of Process Models from Event
Logs: Review and Benchmark. arXiv:1705.02288
[cs]. arXiv: 1705.02288.
Cotera, P., Velazquez, M., Cruz, D., Medina, L., and
Bandala, M. (2016). Indoor Robot Positioning Using
an Enhanced Trilateration Algorithm. International
Journal of Advanced Robotic Systems, 13(3):110.
Dumas, M., Rosa, M. L., Mendling, J., and Reijers, H. A.
(2013). Introduction to Business Process Manage-
ment. In Fundamentals of Business Process Mana-
gement, pages 1–31. Springer, Berlin, Heidelberg.
Fernandez-Llatas, C., Lizondo, A., Monton, E., Benedi, J.-
M., and Traver, V. (2015). Process Mining Metho-
dology for Health Process Tracking Using Real-Time
Indoor Location Systems. Sensors, 15(12):29821–
29840. WOS:000367539100004.
Joglekar, A. M. (2005). Appendix G: Table of Control Chart
Constants. In Statistical Methods for Six Sigma: In
R&D and Manufacturing, pages 311–311. John Wiley
& Sons, Inc.
Montgomery, D. C. (2007). Introduction to statistical qua-
lity control. John Wiley & Sons.
HEALTHINF 2019 - 12th International Conference on Health Informatics
308

Namaki Araghi, S. (2018). ACS/IEEE International
Conference on Computer Systems and Applications
AICCSA.
Partington, A., Wynn, M. T., Suriadi, S., Ouyang, C., and
Karnon, J. (2015). Process mining for clinical proces-
ses: A comparative analysis of four Australian hospi-
tals. ACM Transactions on Management Information
Systems, 5(4):19:1–19:18.
Pinchin, J. (2015). Getting lost in hospitals costs the NHS
and patients. The Guardian.
Rebuge, l. and Ferreira, D. R. (2012). Business pro-
cess analysis in healthcare environments: A methodo-
logy based on process mining. Information Systems,
37(2):99–116.
Rojas, E., Munoz-Gama, J., Sepúlveda, M., and Capurro,
D. (2016). Process mining in healthcare: A literature
review. Journal of Biomedical Informatics, 61:224–
236.
Thor, J., Lundberg, J., Ask, J., Olsson, J., Carli, C., Hären-
stam, K. P., and Brommels, M. (2007). Application of
statistical process control in healthcare improvement:
systematic review. Quality & Safety in Health Care,
16(5):387–399.
Tiwari, A., Turner, C. J., and Majeed, B. (2008). A re-
view of business process mining: state-of-the-art and
future trends. Business Process Management Journal,
14(1):5–22.
Vanhaecht, K., Sermeus, W., Peers, J., Lodewijckx, C., De-
neckere, S., Leigheb, F., Decramer, M., and Panella,
M. (2010). The impact of care pathways for exacer-
bation of Chronic Obstructive Pulmonary Disease: ra-
tionale and design of a cluster randomized controlled
trial. Trials, 11:111.
Yang, W. and Su, Q. (2014). Process mining for clinical
pathway: Literature review and future directions. In
2014 11th International Conference on Service Sys-
tems and Service Management (ICSSSM), pages 1–5.
Evaluating the Process Capability Ratio of Patients’ Pathways by the Application of Process Mining, SPC and RTLS
309
