
Comparison between Supervised and Unsupervised Feature Selection
Methods
Lilli Haar, Katharina Anding, Konstantin Trambitckii and Gunther Notni
Institute of Mechanical Engineering, Department of Quality Assurance and Industrial Image Processing, Ilmenau,
University of Technology, Gustav-Kirchhoff-Platz 2, Ilmenau, Germany
{lilli.haar, katharina.anding, konstantin.trambitckii, gunther.notni}@tu –ilmenau.de
Keywords: Feature Selection, Dimensionality Reduction, Unsupervised Learning.
Abstract: The reduction of the feature set by selecting relevant features for the classification process is an important
step within the image processing chain, but sometimes too little attention is paid to it. Such a reduction has
many advantages. It can remove irrelevant and redundant data, improve recognition performance, reduce
storage capacity requirements, computational time of calculations and also the complexity of the model.
Within this paper supervised and unsupervised feature selection methods are compared with respect to the
achievable recognition accuracy. Supervised Methods include information of the given classes in the
selection, whereas unsupervised ones can be used for tasks without known class labels. Feature clustering is
an unsupervised method. For this type of feature reduction, mainly hierarchical methods, but also k-means
are used. Instead of this two clustering methods, the Expectation Maximization (EM) algorithm was used in
this paper. The aim is to investigate whether this type of clustering algorithm can provide a proper feature
vector using feature clustering. There is no feature reduction technique that provides equally best results for
all datasets and classifiers. However, for all datasets, it was possible to reduce the feature set to a specific
number of useful features without losses and often even with improvements in recognition performance.
1 INTRODUCTION
One of the goals of image processing is the automated
classification of objects into classes. For this purpose,
machine learning is used, which performs a grouping
based on image or object features. In order to ensure
a high accuracy, it is essential to use features that
allow an adequate separation of the classes. However,
it is difficult to assess, which features are important
and which are not. If there are only a few features,
satisfactory results could not be achieved, as the
features may be unsuitable for class separation. The
accuracy can be increased by adding more relevant
features. However, this is possible only up to a certain
number of features. When this critical number of
features is reached, the growth of accuracy stagnates
or even decreases. This behaviour is well known as
the peaking phenomenon (see Figure 1). Furthermore,
feature selection can help to avoid the curse of
dimensionality (Bellman 1961). The recognition
performance of a classifier depends on the relation
between the number of training objects and the
number of features. If the number of features
increases, the quantity of objects must increase expo-
nentially (Theodoridis and Koutroumbas 2009).
Figure 1: Illustration of the peaking phenomenon.
To counteract these two phenomena, the feature
vector should be reduced. In addition, the
computational effort and the time required for
training a classifier or for the classification process
itself can be reduced. This is especially important for
neural networks, as they require a lot of time for
training (Han et al. 2012) and also for real-time
recognition tasks, particularly in hyperspectral data.
Furthermore, a reduced number of features can avoid
overfitting. There are many different methods
available to perform this task. This paper aims to
compare different supervised and unsupervised
582
Haar, L., Anding, K., Trambitckii, K. and Notni, G.
Comparison between Supervised and Unsupervised Feature Selection Methods.
DOI: 10.5220/0007385305820589
In Proceedings of the 8th International Conference on Pattern Recognition Applications and Methods (ICPRAM 2019), pages 582-589
ISBN: 978-989-758-351-3
Copyright
c
2019 by SCITEPRESS – Science and Technology Publications, Lda. All rights reserved

methods for feature selection. Different datasets,
which are presented in section 3.1, were used for the
evaluation. The comparison was made using the
recognition rate.
2 STATE OF THE ART
The feature vector can contain redundant and/or
irrelevant features. Feature 2 in Figure 2a can separate
the given two classes alone. Instead, Feature 1 is
similar for both classes. Such a feature is considered
irrelevant. The Features, which are shown in Figure
2b, are redundant because they carry similar
information. Thus, one of the two features could be
left out without suffering any loss of information.
a) Irrelevant features b) Redundant features
Figure 2: Illustration of irrelevant and redundant features.
Three different approaches for feature selection can
be distinguished, these are filters, wrappers and
embedded methods (García et al. 2015). The filter
methods act independently of the selected classifier.
In advance, features are filtered out using heuristics
or the characteristics of the given data. This paper
uses techniques from this approach. The wrapper
methods involve the classifier to decide which
features should be removed or added. The accuracy is
determined with each new feature subset and the one
with the best results is selected. Examples of this type
of feature selection are sequential forward or
backward selection. Embedded methods use the
classifier for decision making, too. The features are
selected within the training of the classifier.
The methods for feature selection can be
categorized into supervised and unsupervised. As
with machine learning, this means that the labels of
the objects are integrated into the reduction process
or not. In the case of unsupervised methods, the
selection is done based on the attributes and their
characteristics without the inclusion of the labels.
When basically no labels are known in clustering,
only unsupervised methods can be used for feature
selection. A selection based on variance or correlation
is unsupervised. (Dy and Brodley 2000), (Mitra et al.
2002) and (Cai et al. 2010) present unsupervised
feature selection methods. Clustering can also be used
for this task.
Common supervised methods of feature selection
are, for example, InformationGain (InfoGain) (Han et
al. 2012), GainRatio (Quinlan 1993), Relief (Kira and
Rendell 1992), ReliefF (Kononenko 1994), Gini-
Index (Breiman et al. 1984).
An overview of different feature selection
methods is given in (Li et al. 2017).
2.1 Information Gain
The Information Gain score is calculated for each
feature based on entropy and indicates the level of
information about the classes to be predicted (Han et
al. 2012). Thus, it can be determined which features
are suitable for a separation of the classes. A high
value indicates a high information content. In this
way, a ranking of the features is created. This method
can distinguish irrelevant features.
2.2 ReliefF
In process of ReliefF, features are weighted, and a
ranking is created. First, an object is selected and the
nearest neighbour from the same and from the other
classes are determined (Kira and Rendell 1992),
(Kononenko 1994). The weights of the features in
which the objects of the same class match and objects
of different classes do not match are increased. On the
other hand, the weights of features in which objects
of one class differ or whose expressions are equal
between objects of different classes are reduced.
Using ReliefF allows removing irrelevant features.
2.3 Based on Variance
The characteristics of some features are almost the
same for all objects and therefore vary only slightly
(Han et al. 2012). Such features are irrelevant and add
no value to the classification, which is why they can
be removed from the feature vector.
2.4 Based on Clustering
The natural grouping tendencies of clustering can also
be used to perform a feature selection. The
Generalized Hebbian Algorithm (GHA) and the self-
organizing map (SOM) can, for example, be used to
perform a principal component analysis (RapidMiner
Inc. 2014). (Roiger 2017) proposes a wrapper
approach for feature selection using unsupervised
learning. Furthermore, it is possible to transpose the
input table and to perform the clustering on the
Comparison between Supervised and Unsupervised Feature Selection Methods
583
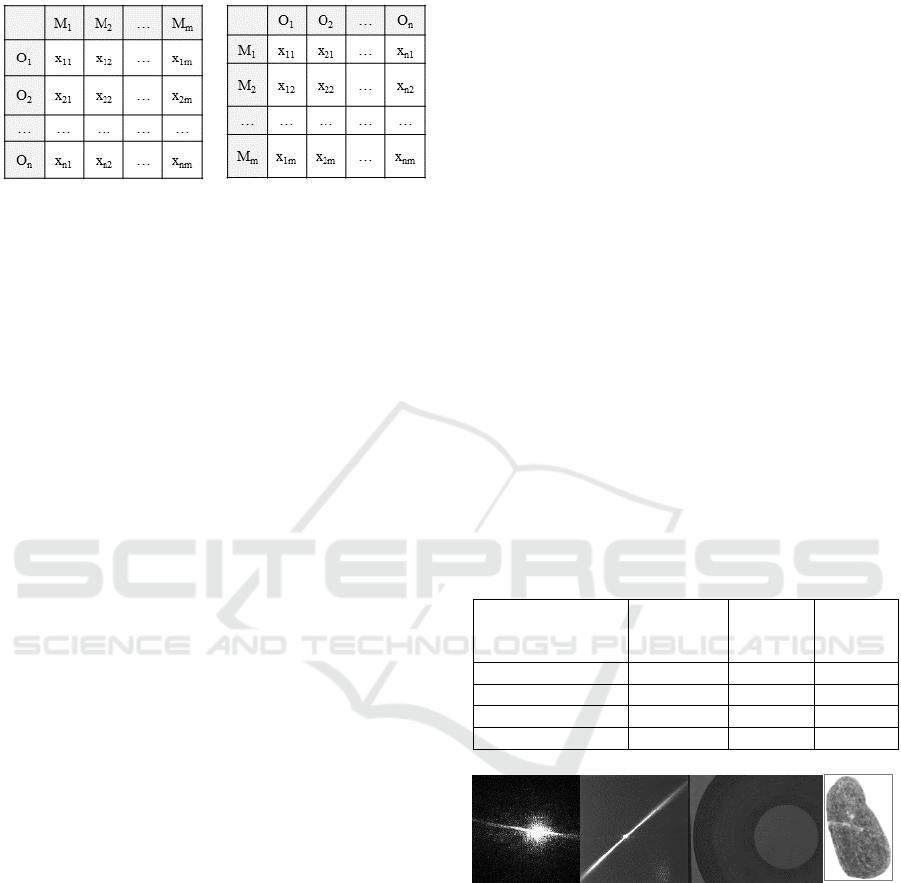
features instead of the objects. This process is
illustrated in Figure 3.
Figure 3: Left: Original input table, right: Transposed input
table for feature clustering.
Such feature selection methods are called feature
clustering. Similar features should be grouped in
clusters. Subsequently, only the nearest feature to the
centre of the cluster is used as the representative of
the entire cluster (Cheung and Jia 2012), (Hong et al.
2014). For this type of feature reduction, mainly
hierarchical methods, but also k-means were
investigated, the former being better suited (Jain and
Dubes 1978), (Guyon and Elisseeff 2003), (Krier et
al. 2007), (Liu and Wu, Xindong, Zhang, Shichao
2011), (Cheung and Jia 2012). However, it is
problematic to find a suitable distance measure,
especially if the features are scaled differently.
Clustering-based methods reduce the feature vector
by removing redundant features.
3 COMPARISON OF FEATURE
SELECTION ALGORITHMS
The presented feature selection methods are
compared based on the achieved recognition
accuracies of different classifiers. InfoGain and
ReliefF are classical methods, which are very
common and therefore very often used.
Instead of hierarchical clustering or k-means, the
Expectation Maximization (EM) algorithm was used
for unsupervised feature clustering (Dempster et al.
1977). Here, a mathematical model, which consists of
𝑘 probability distributions, is created. The aim of this
clustering method is to find those model parameters
of the probability distributions that represent the data
in the best way (Dempster et al. 1977) and thus to
optimize the fitting of the mathematical model to this
data (Aggarwal 2015). The EM algorithm is very
popular because of its simple implementation
(Aggarwal and Reddy 2014) and flexibility
(Aggarwal 2015). Probabilistic methods often surpass
other clustering methods (Kononenko 1994) and can
be used in many fields (Dempster et al. 1977). It is
also a stable process that is robust to outliers (Gan et
al. 2007). This paper aims to investigate whether this
type of clustering algorithm can provide a proper
feature vector using feature clustering. The features
are normalized by using Gaussian z-score
normalization before clustering.
The investigations were carried out in the data
mining program KNIME (Konstanz Information
Miner) based on the Weka plug-in and thus on Weka
implementation of these methods.
3.1 Used Datasets
Four different real datasets are used in the
investigations of this paper. The first two datasets
consist of light scattering images. These represent
reflective, industrially produced surfaces without
defects, with scratches or point defects. The
Autopetrography dataset is based on a developed
method for automatic recognition of mineral
aggregates to solve automatic analysis for all
petrography classes according to legal requirements.
Furthermore, a dataset with images of metal surfaces
with and without defects is used. In Table 1, all
datasets are listed. Figure 4 shows an example of each
dataset.
Table 1: Overview of used datasets.
Name
Number of
Objects
Number
of
Features
Number
of
Classes
Scattered_Light_1
300
182
3
Scattered_Light_2
900
182
4
Metal Surfaces
273
123
3
Autopetrography
15907
234
4
Figure 4: Example images of each dataset. From left to
right: Scattered_Light_1, Scattered_Light_2, Metal
Surfaces, Autopetrography.
3.2 Used Classification Algorithms
Three different classifiers are used. Random Forest is
insensitive to irrelevant or redundant features. Naı̈ ve
Bayes is sensitive to redundant features, whereas
𝑘 Nearest Neighbour is sensitive to irrelevant ones.
For all used classifiers the achieved results are
measured as recognition accuracy in percent. The
ICPRAM 2019 - 8th International Conference on Pattern Recognition Applications and Methods
584

required computational effort is not included in the
assessment.
3.2.1 Random Forest
In some cases, a single tree classifier has an
insufficient accuracy. A combination of several trees
and randomly chosen features can improve the results
significantly. This is the keynote of Random Forest
classifier (Breiman 2001). It is based on the bagging
and random feature selection. Random Forest is a
very powerful classifier, which delivers good results
in a short time. The algorithm is understandable and
comprehensible. When building the tree, an internal
selection of the most important features is made,
which reduces the influence of irrelevant features. A
small influence remains. The number of trees in these
investigations was set to 100.
3.2.2 𝒌 Nearest Neighbour
The learning step of the 𝑘 Nearest Neighbour
algorithm is very simple, the existing training data is
just stored (Cleve and Lämmel 2014). In the
following classification step, the distances between
all training data points and the new and unknown
object are determined. Subsequently, 𝑘 objects of the
training dataset are determined, which have the
smallest distance to the new object in the feature
space. The parameter 𝑘 is a natural number specified
by the user. Assuming that these 𝑘 nearest neighbours
are most similar to the unknown object, their classes
determines the class affiliation of the unknown
object. The Ibk algorithm with 𝑘 = 15, included in
Weka, was used in this paper.
3.2.3 Naı
̈
ve Bayes
Naı̈ve Bayes belongs to the group of statistical or
probability based classifiers (Han et al. 2012), (Cleve
and Lämmel 2014). The basic idea is to calculate the
probabilities of the class membership of an object as
a function of its specific feature vector and to select
the class with the highest result. The suffix ”naı̈ ve”
refers to the simplifying but mostly unrealistic
assumption that the features in the datasets are
independent of each other (Duda et al. 2012), (Witten
et al. 2017). This assumption is not always true,
which is why the classifier is highly sensitive to
redundant features.
4 RESULTS
A ranking of the features was created with InfoGain,
ReliefF and the statistic parameter variance.
Afterwards, one of the classifiers was trained with the
first 10 most important features of each method and
the accuracy was determined. This was done using a
10-fold cross validation for the Scattered Light
datasets and a 3-fold cross validation for the other
datasets. With each step, the number of features was
increased by adding the next 10 features with
remaining highest significance, the classifier was
trained, and the accuracy was determined. The
procedure using the clustering-based method was
similar, but the number of features was determined by
the chosen number of clusters. This value started with
10 and was increased by 10 until the full number of
features was reached.
4.1 Random Forest
Figure 5 shows the results of all four datasets by using
Random Forest. The feature selection was carried out
using the four methods described above. In any case,
a comparable accuracy can be achieved with a
significantly reduced feature vector as with a full one.
The feature clustering achieved the best results for the
Scattered_Light_1 dataset, although this method does
not involve the classes. Significantly, worse results
were provided for this dataset by using the second
unsupervised method based on variance. The two
other methods also gave worse results. Nevertheless,
the accuracy increases continuously with the number
of used features. This indicates that the Random
Forest classifier is insensitive to irrelevant features.
For the datasets, Scattered_Light_2 and
Autopetrography, the differences between the feature
selection methods are small, at most 3%. All methods
are able to create a smaller feature vector, which
nevertheless allows a similarly high accuracy as by
using the full feature number. By using the
Scattered_Light_2 dataset this comparable
recognition performance is achieved with about 30
features and with 60 features using the
Autopetrography dataset. In addition, the recognition
accuracy of the method, which is based on variance,
is at the beginning significantly worse than the other
feature selection methods, but then it increases
significantly and can obtain the same level. The
progress of the accuracy indicates that these datasets
consist of a large number of features which carry little
additional information. The Metal Surface dataset
shows a rapid increase of the accuracy, but also
greater differences between the feature selection
Comparison between Supervised and Unsupervised Feature Selection Methods
585
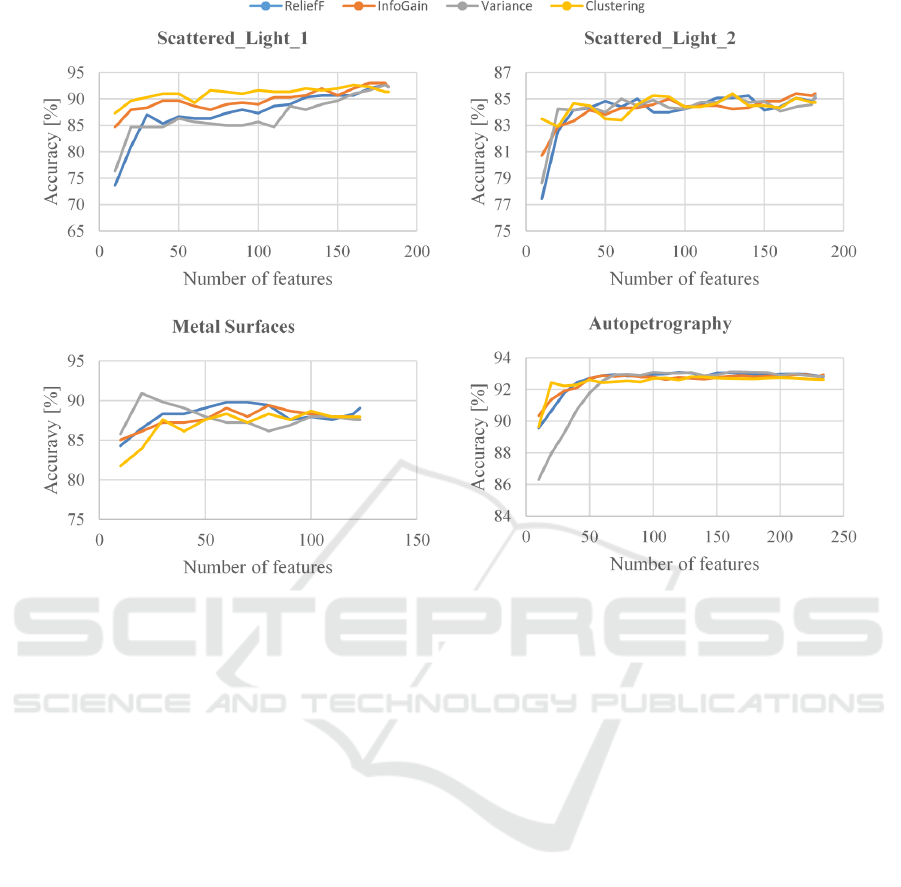
Figure 5: Recognition accuracies of different feature selection methods using Random Forest classifier.
methods and more fluctuations. Variance-based
selection achieved the best results with this dataset. A
significant improvement could be achieved with only
20 features. In addition, a comparable accuracy to the
full feature set was achieved with significantly fewer
features. The benefits are a reduction of storage
capacity requirements, of calculation time and of
computational complexity.
4.2 𝒌 Nearest Neighbour
Figure 6 shows the results by using different feature
selection methods with 𝑘 Nearest Neighbour
classifier. This classifier is sensitive to irrelevant
features. The results of the Scattered_Light_1 dataset
show, that there are many irrelevant features in this
dataset. Using the InfoGain algorithm a significantly
higher accuracy (87.7%) could be achieved with only
20 features. This value is significantly higher than
83% achievable with the full feature vector.
Thereafter, accuracy decreases until a minimum at 70
used features. This indicates an increased number of
irrelevant features. By removing these irrelevant
features, the classification process is no longer
disturbed, which is why better results are possible.
Subsequently, the accuracy increases again. The
accuracies achieved with the other feature selection
methods increases continuously. For
Scattered_Light_2 dataset, InfoGain is no longer able
to achieve such good results. ReliefF and variance
show better accuracies. A reduced number of features
(about 30) is already able to achieve similarly good
results as using full feature set. The behaviour of the
accuracy is especially interesting for the Metal
Surfaces dataset. It was possible to increase the
accuracy by about 5% - 10% with ReliefF and
InfoGain. Subsequently, the accuracies decrease until
the entire feature set is reached. This indicates that the
dataset includes many irrelevant characteristics. The
results of feature clustering are different, because this
method detects redundant instead of irrelevant
features. There is no significant increase in the
accuracy. However, the number of features can also
be reduced without lowering the recognition
performance. The variance also shows a different
trend, since it operates unsupervised. For
Autopetrography the results of ReliefF, InfoGain and
feature clustering are very similar. Variance is
initially unable to keep up. First, a continuous
increase can be seen in all procedures. Then it comes
to a stagnation. Instead of 234 features, 70 could lead
to similar results as by using the full feature set.
ICPRAM 2019 - 8th International Conference on Pattern Recognition Applications and Methods
586
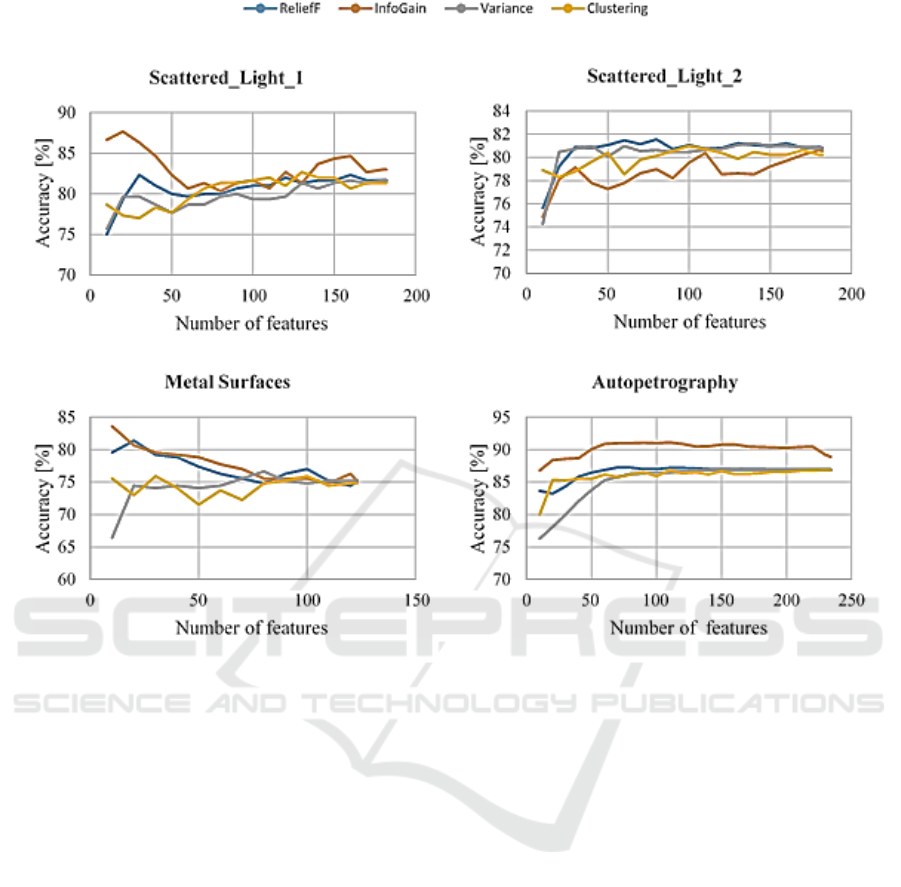
Figure 6: Recognition accuracies of different feature selection methods using IBk classifier.
4.3 Naı
̈
Ve Bayes
This is a simple classifier, which can achieve
relatively high accuracies for simple classification
tasks. As already mentioned, this classifier is also
highly sensitive to redundant features. Figure 7
summarizes the results using Naı̈ve Bayes. Because
redundant features are removed with feature
clustering, this method is best for the
Scattered_Light_1 dataset. An accuracy, which
overcomes the result of the full feature set could be
achieved with only 40 features. After this peak, it
decreases. It can be concluded that this dataset
consists of many redundant features. A set created
with InfoGain containing a lower number of features
gained an accuracy comparable to that using the full
feature set. ReliefF could achieve such a high
accuracy with significantly more features. For the
Scattered_Light_2 dataset, the accuracies for all four
feature selection methods increase very fast, before
they stagnate and decrease again. This is typical for
the peaking phenomenon. The results of the Metal
Surfaces dataset differ more in terms of the selection
methods. Variance shows the worst results. The
gradients of ReliefF and InfoGain are similar, with
the accuracy of the latter being higher. Results
achieved with the feature subsets of feature clustering
initially show worse results, but then surpass the other
methods. Later, the accuracies of all methods are
similar. The continuous increase indicates a small
number of redundant features. For the
Autopetrography dataset, an unusual situation is
shown. InfoGain and clustering show a similar
course. Both achieve an accuracy of approximately
77% with already 10 features. Subsequently, it
decreases continuously with an increase of the
number of features, indicating an increased number of
redundant features. This also explains why the
clustering-based method performs very well in this
case. It is able to filter out redundant features. ReliefF
is significantly worse than InfoGain and the
unsupervised clustering-based method.
5 CONCLUSIONS
It has been shown that each of the four investigated
methods is suitable for creating a reduced feature set.
Comparison between Supervised and Unsupervised Feature Selection Methods
587
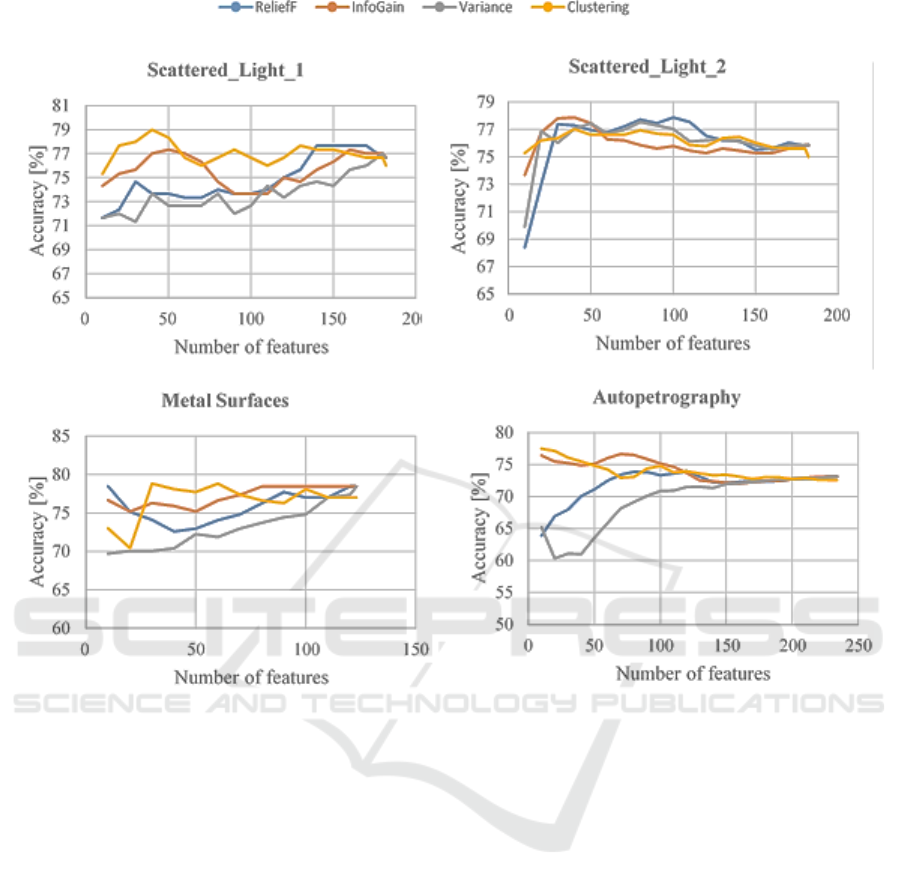
Figure 7: Recognition accuracies of different feature selection methods using Naı̈ ve Bayes classifier.
Furthermore, the results show, that EM is suitable for
feature clustering and leads to good results. The
number and constellation of optimal features are
highly dependent on the chosen machine learning
method and the given dataset. Thus, there is no
feature reduction technique that provides equally
good results for all datasets and all used classifiers.
For this reason, a suitable procedure must be selected
for each new recognition task. The unsupervised
feature clustering could often provide similarly good
results or even better than the two supervised working
feature selection methods. Because no class-labels are
included, it can also be used for datasets without
known labels and thus for feature selection in case of
unsupervised learning. Between InfoGain and
ReliefF, there were often only minor differences. In
some cases, one method was better than the other and
vice versa. For all datasets, it was possible to reduce
the feature set to a specific number of features without
losses and often even with improvements in
recognition performance. It could be shown, that a
significant improvement of the recognition
performance can be achieved by using a feature
selection carried out in advance for classifiers with
high sensitivity to irrelevant or redundant features.
Even using classifiers with low sensitivity to
redundant or irrelevant features, a reduced feature
vector can lead to higher accuracies. This reduction
allows many advantages. From the point of view of
storage capacity and computing power, it is also
absolutely necessary to keep only those data, which
provide added value for the classification task. This is
especially important in Big Data or in spectral
imaging data.
REFERENCES
Aggarwal, C. C., 2015. Data Mining: The Textbook,
Springer. Cham.
Aggarwal, C. C., Reddy, C. K., 2014. Data Clustering:
Algorithms and Applications, CRC Press. Boca Raton.
Bellman, R., 1961. Adaptive Control Processes: A Guided
Tour, Princeton University Press. Princeton, N.J.
ICPRAM 2019 - 8th International Conference on Pattern Recognition Applications and Methods
588

Breiman, L., 2001. Random Forests. Machine Learning
45(1), Pages 5–32.
Breiman, L., Friedman, J. H., Olshen, R. A., Stone, C. J.,
1984. Classification And Regression Trees, Wadsworth
International Group. Belmont.
Cai, D., Zhang, C., He, X., 2010. Unsupervised feature
selection for multi-cluster data. In Proceedings of the
16th ACM SIGKDD international conference on
Knowledge discovery and data mining. ACM. Pages
333–342.
Cheung, Y.-m., Jia, H., 2012. Unsupervised feature
selection with feature clustering. In Proceedings of the
The 2012 IEEE/WIC/ACM International Joint
Conferences on Web Intelligence and Intelligent Agent
Technology-Volume 01. IEEE Computer Society. Pages
9–15.
Cleve, J., Lämmel, U., 2014. Data Mining, De Gruyter
Oldenbourg. München.
Dempster, A. P., Laird, N. M., Rubin, D. B., 1977.
Maximum Likelihood from Incomplete Data via the
EM Algorithm. Journal of the royal statistical society
Series B (methodological), Pages 1–38.
Duda, R. O., Hart, P. E., Stork, D. G., 2012. Pattern
Classification, Wiley-Interscience. s.l., 2. Aufl. edition.
Dy, J., Brodley, C. E., 2000. Feature subset selection and
order identification for unsupervised learning. In
International Conference on Machine Learning. Pages
247–254.
Gan, G., Ma, C., Wu, J., 2007. Data Clustering: Theory,
Algorithms, and Applications, SIAM. Philadelphia.
García, S., Luengo, J., Herrera, F., 2015. Data
Preprocessing in Data Mining, Springer. Cham.
Guyon, I., Elisseeff, A., 2003. An introduction to variable
and feature selection. Journal of Machine Learning
Research 3(Mar), Pages 1157–1182.
Han, J., Kamber, M., Pei, J., 2012. Data mining: Concepts
and Techniques, Elsevier/Morgan Kaufmann.
Amsterdam, 3th edition.
Hong, T.-P., Liou, Y.-L., Wang, S.-L., Vo, B., 2014.
Feature selection and replacement by clustering
attributes. Vietnam Journal of Computer Science 1(1),
Pages 47–55.
Jain, A. K., Dubes, R. C., 1978. Feature definition in pattern
recognition with small sample size. Pattern recognition
10(2), Pages 85–97.
Kira, K., Rendell, L. A., 1992. A practical approach to
feature selection. In Machine Learning Proceedings.
Pages 249–256.
Kononenko, I., 1994. Estimating attributes: analysis and
extensions of RELIEF. In European conference on
machine learning. Springer, Berlin, Heidelberg. Pages
171–182.
Krier, C., François, D., Rossi, F., Verleysen, M., 2007.
Feature clustering and mutual information for the
selection of variables in spectral data. In European
Symposium on Artificial Networks, Computational
Intelligence and Machine Learning. Pages 157–162.
Li, J., Cheng, K., Wang, S., Morstatter, F., Trevino, R. P.,
Tang, J., Liu, H., 2017. Feature Selection: A Data
Perspective. ACM Computing Surveys (CSUR) 50(6),
Pages 94.
Liu, H., Wu, Xindong, Zhang, Shichao, 2011. Feature
Selection using Hierarchical Feature Clustering. In
Proceedings of the 20th ACM international conference
on Information and knowledge management. ACM.
Pages 979–984.
Mitra, P., Murthy, C. A., Pal, S. K., 2002. Unsupervised
feature selection using feature similarity. IEEE
transactions on pattern analysis and machine
intelligence 24(3), Pages 301–312.
Quinlan, J. R., 1993. C4.5: Programs for Machine
Learning, Morgan Kaufmann. San Mateo.
RapidMiner Inc., 2014. RapidMiner: Operator Reference
Manual.
Roiger, R. J., 2017. Data Mining: A Tutorial-Based Primer,
CRC Press. Boca Raton, 2nd edition.
Theodoridis, S., Koutroumbas, K., 2009. Pattern
recognition, Elsevier/Acad. Press. Amsterdam, 4th
edition.
Witten, I. H., Frank, E., Hall, M. A., Pal Christopher J.,
2017. Data mining: Practical Machine Learning Tools
and Techniques, Morgan Kaufmann. Cambridge, MA,
4th edition.
Comparison between Supervised and Unsupervised Feature Selection Methods
589
