
A Stranded Unshielded Twisted Pair Modeling for Online Fault Location
using OMTDR-based Diagnosis Sensor
Wafa Ben Hassen, Moussa Kafal and Esteban Cabanillas
CEA, LIST, Laboratoire de Fiabilisation et d’Integration des Capteurs Nano-Innov, Bat. 862-PC172,
91191 Gif-sur-Yvette Cedex, France
Keywords:
Wiring Diagnosis, Transmission Line Modeling, Stranded Twisted Pair, Reflectometry, OMTDR.
Abstract:
Despite the worldwide use of stranded Unshielded Twisted Pair (UTP) cables, scientific references dealing
with accurate calculation of distributed parameters of such transmission lines are generally missing, especially
in high frequency applications where skin and proximity effects are present. On the other hand, reflectome-
try is a high frequency method that relies on wave propagation in a cable under test for fault diagnosis. In
this context, this paper proposes a distributed parameters model for the lossy transmission line of a stranded
UTP cable including the pitch of twist and frequency dependent effects to evaluate as faithfully as possible
the reflectometry response in such cables. The developed model is validated with 3D-electromagnetic simu-
lations using Time Domain Reflectometry (TDR). For online diagnosis, Orthognal Multi-Tone Time Domain
Reflectometry is performed thanks to its capacity to control bandwidth and enable sensors fusion. In complex
wiring networks, the developed model is performed to evaluate the performance of OMTDR-based diagnosis
sensor including a Xilinx Zynq 7010 FPGA, 10-bit Analog-to-Digital Converter (ADC) and Digital-to-Analog
Converter (DAC).
1 INTRODUCTION
Electrical wiring are usually implemented in envi-
ronments sensitive to severe conditions (aeronautics,
naval, space, etc.) thus exposing cables to dangerous
situations and problems (Auzanneau, 2013). For in-
stance, cutting a wire in a cable can cause the loss of
functionality of one or more critical systems. Thus,
the need for a system to online diagnose faults in the
electrical wiring in an alive mode becomes essential
to facilitate maintenance, minimize downtime, etc.
Orthogonal Multi-Tone Time Domain Reflectometry
(OMTDR) has the advantage of being simple to ana-
lyze: the impedance faults or discontinuities present
on the cable are represented by peaks on the corre-
sponding reflectogram (Hassen et al., 2013). For a
Maintenance Repair Overhaul (MRO) application, the
diagnosis sensor is connected to the cable giving ac-
cess to the network in which a fault has been identified
in an effort to characterize the fault (detection, local-
ization and identification) (Kafal et al., 2018). How-
ever, a reflectogram could be very complex to analyze
due to the measurement noise, the network complex-
ity, the phenomenon of attenuation, etc.
In fact, the presence of Impedance Discontinuities
(IDs) along the cable may locally disturb the prop-
agation of the test signal, subsequently provide un-
desirable signals and thus increase the noise level of
the reflectometry measurement. The diagnosis per-
formance may be limited by the resistance of the ca-
ble leading to signal attenuation. This phenomenon
is mainly encountered on long cables, and becomes
more important in the presence of connectors for con-
necting the different sections of the cable networks.
In the presence of one or sometimes all of the above
constraints, the reflectogram acquired by the diagno-
sis system can be very complex to analyze and in-
terpret. However, it is essential to provide clear and
precise information regarding the fault to technicians
responsible for accurately performing cables mainte-
nance and repair. For this reason, modeling and sim-
ulating transmission lines is necessary to evaluate the
reflectometry response according to the test signal fre-
quency, cable length, network topology, coupling, etc.
Within this context, the current paper proposes a
distributed parameter model for a lossy transmission
line of a stranded Unshielded Twisted Pair (UTP) ca-
ble. In fact, state of the art shows that most sci-
entific references consider twisted pairs as parallel
wires and replace air with uniform dielectric with-
out considering the effect of twists on the characteris-
tic impedance, coupling, and so on (Truong, 2000).
40
Ben Hassen, W., Kafal, M. and Cabanillas, E.
A Stranded Unshielded Twisted Pair Modeling for Online Fault Location using OMTDR-based Diagnosis Sensor.
DOI: 10.5220/0007387000400046
In Proceedings of the 8th International Conference on Sensor Networks (SENSORNETS 2019), pages 40-46
ISBN: 978-989-758-355-1
Copyright
c
2019 by SCITEPRESS – Science and Technology Publications, Lda. All rights reserved

Moreover, stranded cables are generally considered
as a solid core. These assumptions are unsuitable,
particularly, at high frequencies since stranded cables
have larger resistances compared to solid core ones
(Meng et al., 2002). To counter these effects, we de-
veloped in this paper a model that takes into account
the pitch of twist, strand area per conductor and fre-
quency dependent effects (i.e. skin effect, proximity
effect, etc.). The developed model is validated with
3D-electromagnetic simulations using Time Domain
Reflectometry (TDR). To ensure online diagnosis, Or-
thogonal Multi-Tone Time Domain Reflectometry is
used thanks to its capacity to control bandwidth and
enable sensors fusion (Cabanillas et al., 2018b; Has-
sen et al., 2018). In complex wiring networks, the
developed model is used to evaluate the performance
of the OMTDR-based diagnosis sensor including Xil-
inx Zynq 7010 FPGA, 10-bit Analog-to-Digital Con-
verter (ADC) and Digital-to-Analog Converter (DAC)
in different configurations (Cabanillas et al., 2018a).
The rest of the paper is organized as follows:
In section 2, the distributed parameters model of a
twisted pair is introduced. The validation of the de-
veloped model is verified by 3D electromagnetic sim-
ulations in section 3. After that, section 4 proposes
to study the behavior of the developed model of the
twisted pair as a function of the signal frequency,
pitch of twist, and cable length. In section 5, an evalu-
ation of the OMTDR-based sensor in complex wiring
networks is performed.
2 TRANSMISSION LINE MODEL
An UTP is a transmission line composed of two con-
ductors spirally wound around each other to limit sen-
sitivity to interference and cross-talk. It is widely
used in the aeronautical field for controller appli-
cation not limited to the Controller Area Network
(CAN) bus, MIL-STD-1553B, etc. The characteris-
tic impedance, Z
c
, of a transmission line is a func-
tion of the distributed parameters (per unit length) se-
ries Resistance R, series inductance L, shunt capaci-
tance C, and shunt conductance G. The characteristic
impedance is thus defined as follows:
Z
c
=
s
R + j2π f L
G + j2π fC
. (1)
where f is the frequency. In the case of a lossy
twisted-pair transmission line, distributed parameters
are modeled using electrical and geometrical proper-
ties such as conductor diameter, dielectric loss, etc.
The helical pitch angle of twist influences the dielec-
tric constant denoted ε
eq
and is calculated in equation
(2) as follows (Lefferson, 1971):
θ = tan
−1
(2T πD), (2)
where T is the number of twists per meter and D is
the distance between the centers of conductors. The
twist correction factor is then used to adjust the di-
electric constant in equation (3) as follows (Truong,
2000):
q = 0.45 +10
−3
θ ·
180
π
2
. (3)
The equivalent dielectric constant integrating the
influence of the twist angle ε
eq
can be calculated in
equation (4) as follows (Kasthala and Venkatesan,
2016):
ε
eq
= 1 + q(ε
r
−1), (4)
where ε
r
is the relative permittivity. With the de-
termined equivalent dielectric constant, the capacity
can be described as:
C =
πε
0
ε
eq
log
10
D
d
+
q
D
d
2
−1
, (5)
where, the parameter ε
0
is the permittivity of air.
In the same manner, the inductance per unit length of
the cable is given in (6):
L =
µ
0
µ
r
π
log
10
D
d
+
s
D
d
2
−1
, (6)
where µ
0
is the permeability of free space and µ
r
is the relative permeability of the dielectric.
Since reflectometry operates at a high frequency
to ensure accurate fault location, the model must re-
flect the behavior of the transmission line at such
bands. In this context, there are two factors that deter-
mine the current distribution on the conductor cross-
section. The first is the skin effect which, for high fre-
quency, causes a concentration of the current near the
outer surfaces of the cylindrical conductor (Wheeler,
1942). When a current flows through two or more
adjacent conductors, the current distribution in a con-
ductor is affected by the magnetic flux produced by
the adjacent conductors, as well as by the magnetic
flux produced by the current in the conductor itself.
This phenomenon is called proximity effect and causes
a resistance value greater than that of a simple skin
effect (Ferkal et al., 1996). In this paper, we note the
proximity factor P that is determined according to the
ratio between D and d as described in (Smith, 1971).
A Stranded Unshielded Twisted Pair Modeling for Online Fault Location using OMTDR-based Diagnosis Sensor
41

For a twisted pair with n strands per conductor,
one can calculate the resistance per unit-length in (7),
where d
s
is the strand diameter:
R( f ) = P
2n
πdδσ
d
s
d
2
, (7)
where the skin effect δ is expressed in (8) as fol-
lows:
δ =
1
√
πµσ f
, (8)
where µ = µ
0
µ
r
being the dielectric permeability,
σ the conductor conductivity and f the frequency.
The conductance per unit length G is given in (9) as:
G( f ) = 2π fC tan δ, (9)
where tanδ is the tangent of the dielectric loss and
depends on the frequency.
The behavior of the characteristic impedance of a
lossless UTP according to twist pitch is studied later
in the current paper. For this reason, the twist correc-
tion factor q(ξ) may be expressed as a function of the
twist pitch as follows (Truong, 2000):
q(ξ) = 0.45 +10
−3
ξ
2
. (10)
where ξ is the twist pitch. In the case of a lossless
UTP cable where D ' d, the characteristic impedance
may be expressed in function of the twist pitch as:
Z
c
(ξ) =
r
L
C
=
1
π
log
D
d
r
µ
ε
0
ε
eq
(ξ)
. (11)
where ε
eq
(ξ) is the equivalent permittivity constant
and is computed according to (4) using q(ξ) formula
(10) rather than q formula (3).
3 RLCG MODEL VALIDATION
In this section, we propose to validate the distributed
parameters model described in section (2). For this,
the distance between the two conductors is D =
0.95 mm and the diameter of a conductor is d =
0.75 mm. The strands are made of copper (σ = 5.810
7
S/m) and the insulation is made of Teflon (ε
r
= 2.1
and µ = 4π10
−7
) . The proximity factor P = 2.1 is de-
termined directly from the curve provided in (Smith,
1971) for a ratio
D
d
= 1.2. To reconstruct the re-
flectogram from the secondary parameters calculated
on the basis of R, L, C and G, the transfer function
expressed as follows can be used:
H( f ) = Γ
E
+
(1 −Γ
2
E
)Γ
L
e
−2γl
1 + Γ
E
Γ
L
e
−2γl
, (12)
where l is the length of the cable, Γ
E
and Γ
L
are, re-
spectively, the reflection coefficients at the input and
output of the line and γ is the propagation constant.
The propagation constant γ is given by:
γ =
p
(R + j2π f L) (G + j 2π fC). (13)
The reflection coefficient Γ
E
at the input of the
line is calculated as follows:
Γ
E
=
Z
c
−Z
0
Z
0
+ Z
c
. (14)
with Z
0
is the impedance of the generator. In this
case, it is considered equal to 50Ω. In the case of
an open circuit at the end of the line, the reflection
coefficient is defined Γ
L
= 1.
In order to validate the distributed parameters
model, a 3D electromagnetic (EM) model of an UTP
is developed using a dedicated 3D-electromagnetic
simulation software as shown in figure 1. The model
consists of 19 copper strands per conductor. The di-
ameter of one strand is 0.15 mm. The diameter of the
conductor is 0.75 mm. The conductor is covered by
a thin layer of Teflon insulation whose thickness is
0.08 mm. The distance between the two conductors is
0.95 mm and the number of twist steps is 100 per me-
ter. The length of the model is 1 m. A local mesh is
performed, as shown in figure 2, with a step width in
absolute value as follows: x = 0.1 mm, y = 0.04 mm
and z = 0.04 mm. The total number of meshes is 37
004 352. The 19 strands per conductor are connected
to a central point through 19 lines with perfect con-
ductivity and lengths of 0.5 mm. The port with a 50 Ω
impedance connects the two conductors through the
center points as shown in figure 3 to inject/receive test
signals.
Figure 1: The developed 3D EM model of a stranded USTP.
Figure 2: The 3D model
mesh.
Figure 3: The 3D model
port.
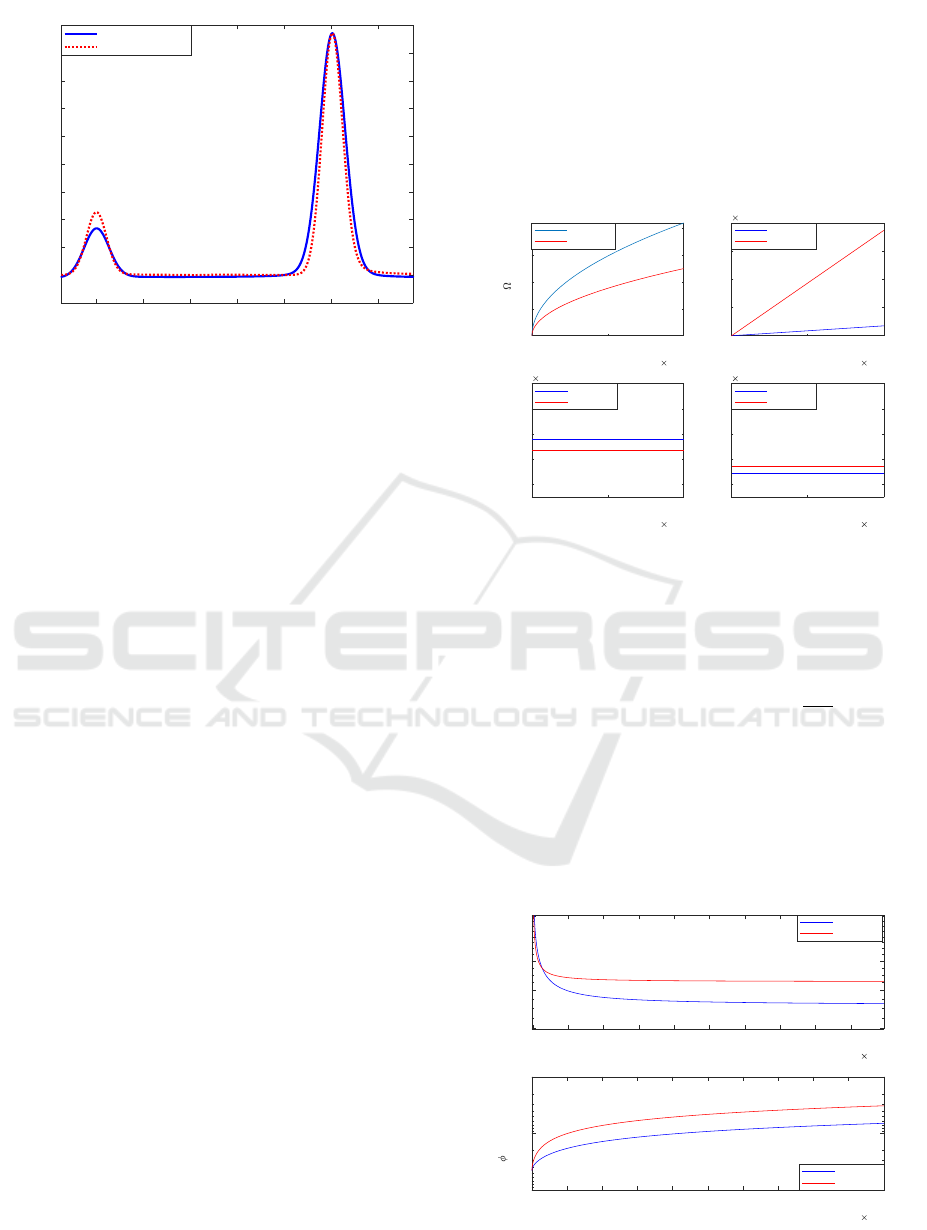
Figure 4 shows the TDR reflectograms of the
RLCG-based model and the 3D EM model. For these
simulations, the used bandwidth is ranged from 0 Hz
to 1 GHz and the width of the Gaussian pulse, used as
test signal, is 1 ns.
SENSORNETS 2019 - 8th International Conference on Sensor Networks
42
0 0.2 0.4 0.6 0.8 1 1.2
Distance [m]
-0.1
0
0.1
0.2
0.3
0.4
0.5
0.6
0.7
0.8
0.9
Amplitude [V]
RLCG-based model
3D EM-based model
Figure 4: TDR reflectograms of the RLCG-based model
and 3D EM model.
The correlation coefficient is used to compare the
similarity between the data from the calculated dis-
tributed parameters model and that of the 3D elec-
tromagnetic simulations. Here, it is considered that
the data is strongly correlated if the correlation co-
efficient is between 0.9 and 1. In this context, the
correlation coefficient between the two reflectograms
resulting from the calculated RLCG model and the 3D
model is equal to 0.9855. One can thus consider that
the correlation coefficient is strong and one can val-
idate the model with distributed constants developed
in section (2) in the case of a twisted pair. The ampli-
tude of the peak of the open circuit present at the end
of the cable is equal to 0.86 V knowing that the am-
plitude of the Gaussian pulse is 1V . It is important to
note that the correlation coefficient between the two
reflectograms resulting directly from the model pro-
posed in (Truong, 2000) and the 3D model is equal to
0.2222. After RLCG-based model validation, the fol-
lowing section proposes to study the UTP behavior.
4 UTP PARAMETERS ANALYSIS
The RLCG parameters may be calculated based on
physical and electrical proprieties of the transmission
line such as conductor diameter, material, stranding,
etc. On the other hand, these parameters may also
be estimated based on the channel response measure-
ment (Cohen and Gregis, 2014; Jiao and Liao, 2017)
when the exact properties of the transmission line are
not available on the cable data sheet. Here, the RLCG
parameters are calculated in the following order start-
ing with equation (7), (6), (5) and ending with (9).
They may be also estimated according to (Cohen and
Gregis, 2014) where the length of the transmission
line is 1 m, the width of the Gaussian pulse is 1ns
and finally the obtained reflectogram of the 3D-based
model shown in figure 4 (red curve) are used as inputs
of the considered algorithm.
Figure 5 presents the increase of the resistance R
and of the conductance G as a function of frequency,
respectively. It shows also that the capacitance (C)
and inductance (L) do not depend on frequency.
0 5 10
Frequency(Hz)
10
5
0
0.1
0.2
0.3
0.4
/m
Resistance (R)
Calculation
Estimation
0 5 10
Frequency(Hz)
10
5
0
2
4
6
8
S/m
10
-7
Inductance (G)
Calculation
Estimation
0 5 10
Frequency(Hz)
10
5
2
4
6
8
10
F/m
10
-11
Capacitance (C)
Calculation
Estimation
0 5 10
Frequency(Hz)
10
5
2
4
6
8
10
H/m
10
-7
Conductance (L)
Calculation
Estimation
Figure 5: Variation of calculated and estimated RLCG pa-
rameters of the twisted pair as a function of the frequency.
The phase angle Φ( f ) of the characteristic
impedance of Z
c
( f ) is given by:
Φ( f ) = angle (Re(Z
c
( f )),Im(Z
c
( f )))
180
π
. (15)
Figure 6 (top) demonstrates the modulus of the
characteristic impedance as a function of the fre-
quency whereas figure 6 (bottom) shows the phase of
the characteristic impedance as a function of the fre-
quency. The characteristic impedance is 71.4Ω in this
case study.
0 1 2 3 4 5 6 7 8 9
Frequency (Hz)
10
5
60
80
100
120
140
|Z(f)|
Calculation
Estimation
0 1 2 3 4 5 6 7 8 9 10
Frequency (Hz)
10
5
-10
2
-10
1
-10
0
(f) (deg/m)
Calculation
Estimation
Figure 6: Variation of the characteristic impedance Z
c
as a
function of the frequency.
A Stranded Unshielded Twisted Pair Modeling for Online Fault Location using OMTDR-based Diagnosis Sensor
43
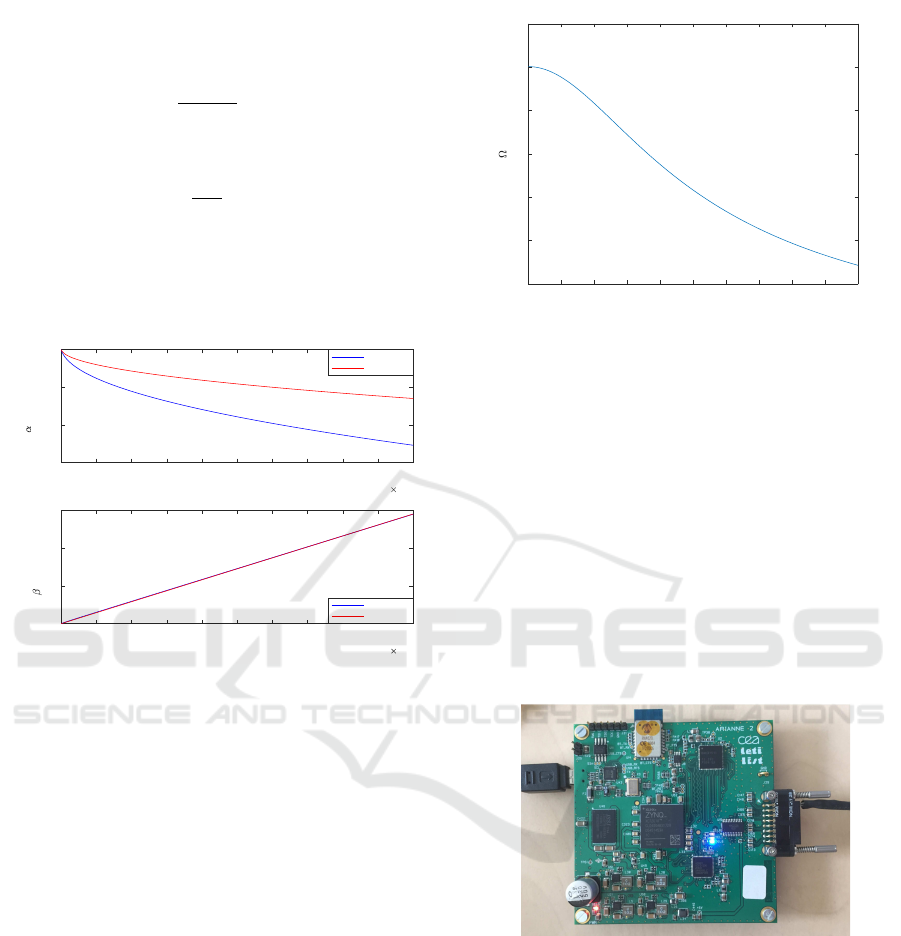
The attenuation of the cable in dB/m is given as
follows:
α( f ) =
−20
log(10)
Re(γ( f )). (16)
The phase constant in degree/m is given as:
β( f ) =
180
π
Im(γ( f )). (17)
Figure 7 (top) and figure 7 (bottom) show the in-
crease of the attenuation according to (16) and of the
phase constant according to (17) as a function of fre-
quency, respectively.
0 1 2 3 4 5 6 7 8 9 10
Frequency (Hz)
10
5
-0.03
-0.02
-0.01
0
(f) (dB/m)
Attenuation
Calculation
Estimation
0 1 2 3 4 5 6 7 8 9 10
Fréquence (Hz)
10
5
0
0.5
1
1.5
(f) (deg/m)
Constant phase
Calculation
Estimation
Figure 7: Attenuation and phase constant versus frequency.
It is noteworthy that the frequency of the reflec-
tometry signal is a critical parameter in detecting and
locating a fault in a cable. Indeed, the higher the fre-
quency of the reflectometry signal, the better is the
resolution of the reflectogram and the localization ac-
curacy of small defects. However, in the case of fault
detection on long cables, increasing the signal fre-
quency is not recommended as it introduces disper-
sion and increase in signal attenuation. TDR simula-
tions were performed on the RLCG model for a length
of 100 m. In this context, the peak amplitude of the
open circuit is 0.0084 V and 0.065 V for a frequency
of 2 GHz and 200 MHz, respectively.
Figure 8 demonstrates the variation of the charac-
teristic impedance as a function of the twist pitch in
a lossless UTP cable. It can be noted that the char-
acteristic impedance decreases with the increase of
the twist pitch. Indeed, the variation of twist pitch
throughout the cable can significantly affect the char-
acteristic impedance of the twisted pair and thus in-
troduce multiple reflections on the reflectogram.
0 10 20 30 40 50 60 70 80 90 100
Twist Pitch
20
30
40
50
60
70
80
Zc( /m)
Figure 8: The characteristic impedance Z
c
according to the
twist step ξ.
5 EXPERIMENTAL RESULTS
The development of the distributed parameter model
permits to evaluate the reflectometry response in dif-
ferent configurations and hence avoid the develop-
ment of test benches leading to a gain in cost and
time. For experimental validations, a 10 m long UTP
EN 2267-009 DRB 24 cable is connected to an elec-
tronic board that permits to inject/receive OMTDR
signals. The electronic board includes FPGA SoC
Xilinx ZyNQ 7010, 10-bits ADC, 10-bits DAC and
512 Megabyte DDR chip as shown in figure 9.
Figure 9: The electronic board used for generating, inject-
ing and receiving the OMTDR signals into a tested wiring
network.
An OMTDR based signal composed of 128 sub-
carriers over a total bandwidth ranging from 300 KHz
to 1.5 GHz with 2048 frequency samples has been
generated and injected into the tested network. The
principle of OMTDR is shown in figure 10.
For numerical results, the processing performed
by the electronic board is modeled using Matlab
simulations (i.e, analog to digital conversion, digi-
tal to analog conversion, oversampling, measurement
noise, etc.). Figure 11 shows the OMTDR based-
reflectogram of the UTP model and the measured one
SENSORNETS 2019 - 8th International Conference on Sensor Networks
44
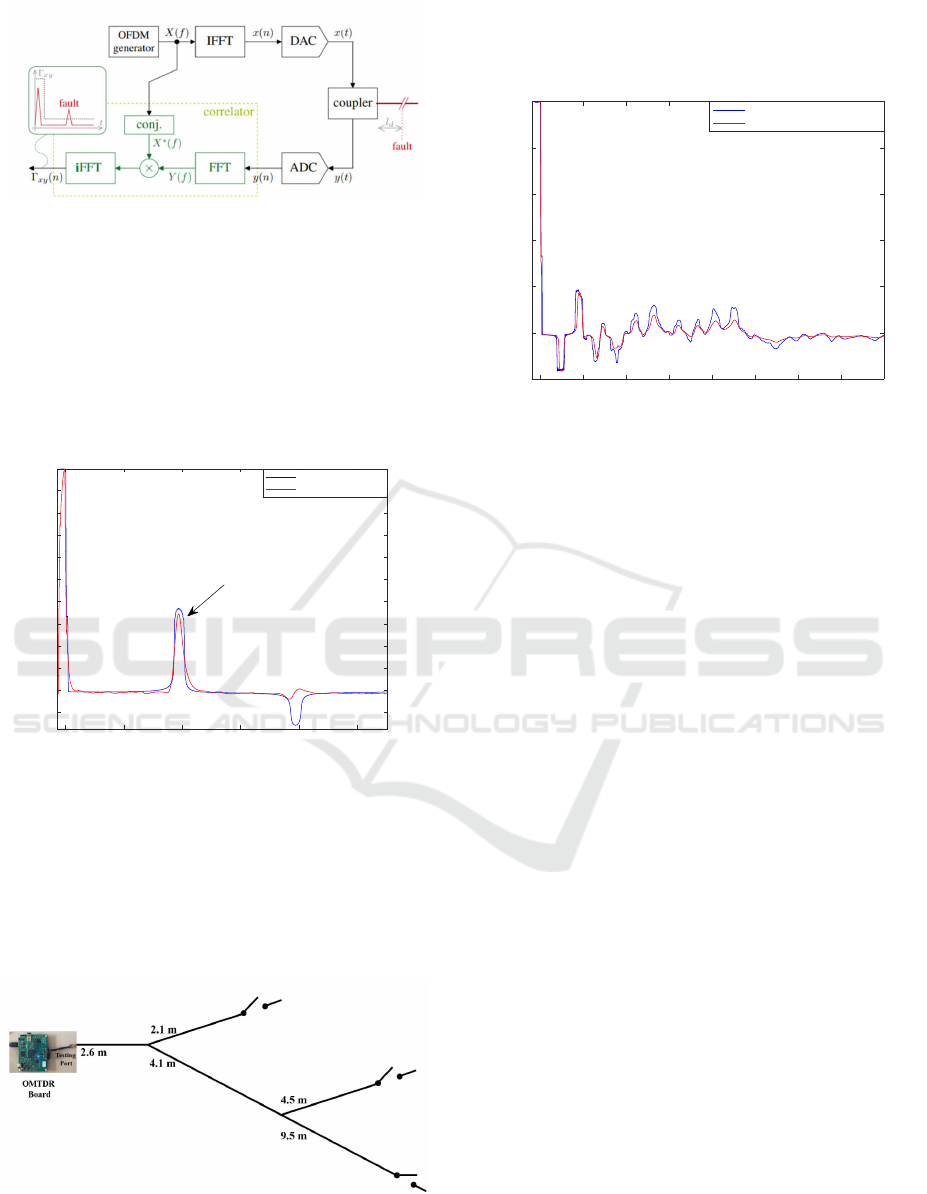
Figure 10: Schematic diagram of an OMTDR reflectometry.
on a 10 m cable. The open circuit present at the end
of the cable is represented in the reflectogram by an
amplitude peak 0.36 with respect to the amplitude of
the peak at the input of the reflectogram. In the same
configuration, the open circuit present at the end of
the cable with 100 m-length is represented by a peak
of amplitude 0.03 with respect to the amplitude of the
peak at the input of the transmission line.
0 5 10 15 20 25
Distance(m)
-0.1
0
0.1
0.2
0.3
0.4
0.5
0.6
0.7
0.8
0.9
Amplitude normalisée
Simulation results
Measurement results
End of the cable
Figure 11: OMTDR reflectograms of the RLCG model of
the twisted pair 30 m long.
For complex networks, a double Y-junction net-
work topology was implemented using UTP EN
2267-009 DRB 24 cables as depicted in figure 12. The
extremities of the network were left open and one ex-
tremity served as a testing port. The tested network
consists in 5 branches and 2 junctions.
Figure 12: Layout of the double Y-junction NUT consid-
ered for the experimental validation of the developed model.
Figure 13 shows the OMTDR reflectometry re-
sponse of the UTP cable model in complex networks
as the double Y-junction configuration of figure 12.
0 5 10 15 20 25 30 35 40
Distance(m)
-0.2
0
0.2
0.4
0.6
0.8
1
Normalized Amplitude
RLCG- based simulations
Electronic board measurement
Figure 13: The measured and simulation OMTDR re-
sponses of the tested NUT
The distributed-constant model of the twisted pair
may be extended to other twisted pairs. It suffices to
define the geometrical properties (for example, con-
ductor radius, distance between two conductors, etc.)
and the electrical properties (for example, permittiv-
ity, conductivity, etc.) to determine the primary and
subsequently secondary parameters. It is then suffi-
cient to define the topology of the cable network to
evaluate the performance of the on-board diagnostic
system in the desired configuration (connector, splice,
etc.).
6 CONCLUSION
In this paper, a distributed parameters model of a
stranded twisted pair has been introduced. This model
has been validated by 3D electromagnetic simulations
of an unshielded twisted pair cable. The developed
model could be extended to other twisted pairs sub-
ject to knowing their geometric and electrical prop-
erties. This model permits to evaluate the diagnosis
system (i.e. electronic board, etc.), in the desired con-
figuration of a twisted pair without resorting to the
establishment of a test bench.
REFERENCES
Auzanneau, F. (2013). Wire troubleshooting and diagnosis:
Review and perspectives. Progress In Electromagnet-
ics Research, 49:253–279.
Cabanillas, E., Kafal, M., and Ben-Hassen, W. (2018a). On
the implementation of embedded communication over
A Stranded Unshielded Twisted Pair Modeling for Online Fault Location using OMTDR-based Diagnosis Sensor
45

reflectometry-oriented hardware for distributed diag-
nosis in complex wiring networks. In 2018 IEEE AU-
TOTESTCON, pages 1–6. IEEE.
Cabanillas, E., Layer, C., Kafal, M., and Dupret, A.
(2018b). Enhancing the spatial resolution for wire
fault detection systems using multi-carrier signals.
IEEE Sensors Journal, 18(23):9857–9866.
Cohen, J. and Gregis, N. (2014). Method of determining
lineal parameters of a transmission line.
Ferkal, K., Poloujadoff, M., and al (1996). Proximity ef-
fect and eddy current losses in insulated cables. IEEE
transactions on Power Delivery, 11(3):1171–1178.
Hassen, W. B., Auzanneau, F., Incarbone, L., P
´
er
`
es, F., and
Tchangani, A. P. (2013). Omtdr using ber estimation
for ambiguities cancellation in ramified networks di-
agnosis. In Intelligent Sensors, Sensor Networks and
Information Processing, 2013 IEEE Eighth Interna-
tional Conference on, pages 414–419. IEEE.
Hassen, W. B., Kafal, M., Cabanillas, E., and Benoit, J.
(2018). Power cable network topology reconstruc-
tion using multi-carrier reflectometry for fault detec-
tion and location in live smart grids. In 2018 Con-
dition Monitoring and Diagnosis (CMD), pages 1–5.
IEEE.
Jiao, X. and Liao, Y. (2017). A linear estimator for trans-
mission line parameters based on distributed parame-
ter line model. In Power and Energy Conference at
Illinois (PECI), 2017 IEEE, pages 1–8. IEEE.
Kafal, M., Mustapha, F., Hassen, W. B., and Benoit, J.
(2018). A non destructive reflectometry based method
for the location and characterization of incipient faults
in complex unknown wire networks. In 2018 IEEE
AUTOTESTCON, pages 1–8. IEEE.
Kasthala, S. and Venkatesan, G. P. (2016). Experimental
verification of distributed parameters on indian resi-
dential networks for power line communication. In-
ternatioanl Journal of Engineering and Technology,
8(6):2845–2852.
Lefferson, P. (1971). Twisted magnet wire transmission
line. IEEE Transactions on Parts, Hybrids, and Pack-
aging, 7(4):148–154.
Meng, H., Chen, S., and al (2002). A transmission line
model for high-frequency power line communication
channel. In International Conference on Power Sys-
tem Technology, volume 2, pages 1290–1295.
Smith, G. (1971). The proximity effect in systems of par-
allel conductors and electrically small multiturn loop
antennas. Technical report, Harvard Univ Cambridge
Ma Div Of Engineering And Applied Physics.
Truong, T. K. (2000). Twisted-pair transmission-line dis-
tributed parameters. EDN Mag.
Wheeler, H. A. (1942). Formulas for the skin effect. Pro-
ceedings of the IRE, 30(9):412–424.
SENSORNETS 2019 - 8th International Conference on Sensor Networks
46
