
Ventricular Activity Signal Removal in Atrial Electrograms of Atrial
Fibrillation
Bahareh Abdi
1
, Richard C. Hendriks
1
, Alle-Jan van der Veen
1
and Natasja M. S. de Groot
2
1
Circuits and Systems (CAS) Group, Delft University of Technology, Delft, The Netherlands
2
Department of Cardiology, Erasmus University Medical Center, Rotterdam, The Netherlands
Keywords:
Atrial and Ventricular Source Separation, Low-rank and Sparse Matrix Decomposition, Atrial Fibrillation,
Atrial Electrogram.
Abstract:
Diagnosis and treatment of atrial fibrillation can benefit from various signal processing approaches employed
on atrial electrograms. However, the performance and interpretation of these approaches get highly degraded
by far-field ventricular activities (VAs) that distort the morphology of the pure atrial activities (AAs). In this
study, we aim to remove VAs from the recorded unipolar electrogram while preserving the AA components.
To do so, we have developed a framework which first removes the VA-containing segments and interpolates the
remaining samples. This will also partly remove the atrial components that overlap with VA signals, e.g., du-
ring atrial fibrillation. To reconstruct the AA components, we estimate them from the removed VA-containing
segments based on a low-rank and sparse matrix decomposition and add them back to the electrograms. The
presented framework is of rather low complexity, preserves AA components, and requires only a single EGM
recording. Instrumental comparison to template matching and subtraction and independent component analy-
sis shows that the proposed approach leads to smoother results with better similarity to the true atrial signal.
1 INTRODUCTION
Atrial fibrillation (AF) is one of the most com-
mon age related cardiac arrhythmia whose persistence
and progression is rooted in impaired electrical con-
duction known as electropathology. Atrial electro-
grams (EGMs), i.e. a record of changes in the electri-
cal potential of the (many) cells in the neighborhood
of an electrode that is positioned on the heart surface,
play an important role in the analysis of AF and ex-
amining the level of electropathology in human tis-
sue (Yaksh et al., 2015). However, these electrograms
suffer from far-field ventricular activities (VAs) cau-
sed by ventricular depolarizations. Although during
sinus rhythm (SR), atrial activity (AA) and VA are se-
parated in time, they might overlap during AF. These
strong VAs distort the morphology of the pure AAs,
complicate their further analysis and affect their fi-
nal interpretations. Therefore, a required step before
any further processing of the recorded electrograms is
to estimate the pure atrial activities by removing the
VAs.
Reita et al. in (Rieta and Hornero, 2007) catego-
rizes the developed algorithms for VA removal into
three groups. The first group of algorithms is based
on template matching and subtraction (TMS) (Shku-
rovich et al., 1998). A second group is based on
adaptive filtering using a VA reference (Petrutiu et al.,
2006), which is obtained using a reference ECG lead.
The third group of VA removal algorithms is based on
blind source separation approaches that try to separate
the components based on the assumption that VA and
AA are uncorrelated, orthogonal, or statistically in-
dependent from beat to beat over time or over space
in multichannel recordings. Independent component
analysis (ICA) is one of the most widely used appro-
aches from this group (Rieta et al., 2004). None of
above mentioned approaches results in a pure AA es-
timate. A perfect performance, however is hampered
by the fact that these signals share overlapping com-
ponents in both time and frequency domain and are
also partially correlated over time and space.
In this study we develop a new framework for re-
moving VA which is based on a sparse and low rank
matrix decomposition. Initially, VA-containing seg-
ments are detected, removed and replaced with subse-
quent spline interpolation. However the performance
of this approach is limited during AF, as VAs might
overlap with the depolarization phase of AAs. In our
approach, we propose to reconstruct AAs in the remo-
Abdi, B., Hendriks, R., van der Veen, A. and S. de Groot, N.
Ventricular Activity Signal Removal in Atrial Electrograms of Atrial Fibrillation.
DOI: 10.5220/0007388901790184
In Proceedings of the 12th International Joint Conference on Biomedical Engineering Systems and Technologies (BIOSTEC 2019), pages 179-184
ISBN: 978-989-758-353-7
Copyright
c
2019 by SCITEPRESS – Science and Technology Publications, Lda. All rights reserved
179

ved segments and adding them back to the interpola-
ted signal. Finally, using simulations, we compare the
performance of the proposed algorithm with two other
approaches, TMS and ICA.
The remainder of this paper is as follows. In
Section 2 we formulate the ventricular and atrial acti-
vity separation problem and present our proposed fra-
mework for solving the problem. In Section 3 we pre-
sent the results and compare them with two other met-
hods. Finally, in Section 4, conclusions are drawn.
2 METHOD
2.1 Electrogram Model
We consider a sampled unipolar atrial electrogram
m ∈ R
N×1
with N the number of time samples. We
assume that m is the summation of AAs and VAs, mo-
deled as
m = a + v, (1)
where vectors a, and v contain the AA and VA sam-
ples produced by atrial and ventricular sources re-
spectively. From the physiological point of view, the
AA is composed of two phases, the depolarization
phase and the repolarization phase. The depolariza-
tion phase is of most interest and consists of a pre-
dominantly positive spike followed by a sharp ne-
gative deflection. It mostly contains high frequency
AA components and shows a sparse representation
in time. The repolarization phase on the other hand,
changes very smoothly in time and contains very low
frequency components. These repolarization activi-
ties are often viewed as baseline wandering and may
even fade out in some recordings. Depending on the
homogeneity of the depolarization wavefront and the
speed of the electrical propagation in the tissue, the
morphology of these two components may vary from
activity to activity even during SR and they cannot be
simply considered as a shifted version of each other,
especially during AF.
2.2 Data Matrix Formation
To overcome the unnecessary introduction of arti-
facts, we use the concept of minimal processing and
process only VA-containing segments. In this study,
we used a simultaneously recorded ECG as reference
signal to specify the VA-containing segments in the
electrogram which coincide with the QRS complexes
in ECG. Since the QRS complex or the R peak is ea-
sily detectable, any simple detection algorithm could
be used. A rectangular window centered at each de-
tected R peak with a fixed width W is used to mark
the onset and offset of the VA and to denote the VA-
containing segments that might also contain AA du-
ring AF.
The baseline wandering of the electrogram is
mainly caused by the repolarization phase of AA. To
remove the VA without affecting this component, we
first remove the VA-containing segments and then re-
place them by spline interpolation applied on the re-
maining data samples. This can to some extend re-
place the removed baseline in the VA segment and
is one of the most basic and efficient approaches for
VA cancellation during SR (Ahmad et al., 2011). The
interpolated data is denoted by m
0
and has the same
length as the recorded electrogram m. During SR
and in some cases during AF, the VA does not over-
lap with the depolarization phase of AA, and leaves
this component unaffected. Removal and interpola-
tion cancels the VAs thus sufficiently and no further
processing would be necessary, cf. the input signal m
and interpolated signal m
0
in the first VA-containing
segment of Figure 1. However, unlike during SR, it
is likely that during AF the depolarization phase of
the AA and the VA completely or partially overlap.
In this case VA removal and interpolation also re-
moves the overlapping depolarization phase of AA.
Therefore, processing the removed component, i.e.,
x = m − m
0
, is required to extract the potentially re-
moved atrial components and add them back to the
interpolated data, cf. the m, m
0
and the removed sig-
nal x in the second and third VA-containing segments
of Figure 1.
Before employing any further processing, we con-
struct an appropriate data matrix X of size W × K,
where each column of X = [x
T
1
, x
T
2
, ..., x
T
K
]
T
is one VA-
containing segment (of length W) of x stored in the
vector x
k
, k ∈ 1, 2, .., K, and where K is the total num-
ber of detected segments. The data matrix X is mo-
deled as the sum of two components (i) matrix V con-
taining the aligned ventricular activities and (ii) ma-
trix A containing the randomly occurring atrial acti-
vities that coincided with the VA-containing segment,
i.e.
X = A + V. (2)
2.3 VA and AA Separation
We now formulate the problem of decomposing the
data matrix X into its two components, V and A.
The problem can be considered as a highly under-
determined blind source separation where the num-
ber of unknowns, A and V, is twice the number of
given measurements, X. However, prior knowledge
of the two sources can be employed to derive use-
ful approximate solutions: (i) The aligned VAs in V,
BIOSIGNALS 2019 - 12th International Conference on Bio-inspired Systems and Signal Processing
180

from beat-to-beat, have an almost similar morphology
which indicates that V is a low-rank matrix while the
occurrence of AA and its morphology in these seg-
ments is random indicating that A is not a low-rank
matrix, (ii) When presented in frequency domain, the
VAs are much sparser, and (iii) AAs are sharper and
more spiky in time domain compared to VAs, matrix
A can therefore be constrained to be sparse. Exploi-
ting these three properties, we formulate the separa-
tion problem as
min
{A,V}
rank(V) +βkΨ
T
Vk
1
+ αkAk
1
s. t. X = A + V, (3)
where rank(·) is the rank operator, kAk
1
=
∑
i j
|A
i j
| is
the l
1
-norm of A, Ψ
T
performs the two-dimensional
cosine transform (DCT), and α and β are the penali-
zation parameters.
Since the rank function is non-differentiable and
non-convex, it is in most studies approximated with
the nuclear norm, kVk
∗
=
∑
K
i=1
σ
i
(V), that is the sum-
mation of all sorted (from largest to smallest) singular
values σ
i
of matrix V. However, minimizing the trun-
cated nuclear norm (TNN) kVk
r
=
∑
K
k=r+1
σ
i
(V), that
is the summation of the K −r smallest singular values,
performs better in minimizing the rank function than
minimizing the nuclear norm (Hu et al., 2013). The
TNN, on the other hand, is non-convex and it cannot
be minimized directly. To overcome this issue, the
TNN is initially approximated by its convex surrogate
(Hu et al., 2013)
kVk
r
=
K
∑
i=r+1
σ
i
(V) = kVk
∗
−
r
∑
i=1
σ
i
(V)
= kVk
∗
− max
U
r
U
T
r
=I,H
r
H
T
r
=I
Tr(U
r
VH
T
r
), (4)
where Tr(·) indicates the trace of a matrix, and U
r
and H
r
are matrices containing the first r columns of
the left and right singular vectors of V respectively,
where V = Udiag(σ)H
T
is the singular value decom-
position (SVD) of V. Using Equation (4), the new
optimization problem for separation of VA and AA
can be written as
min
{A,V}
{kVk
∗
− max
U
r
U
T
r
=I,H
r
H
T
r
=I
Tr(U
r
VH
T
r
)
+ βkΨ
T
Vk
1
+ αkAk
1
}
s. t. X = A + V. (5)
Generally, the lower K (i.e., the number of VA-
containing segments in M), the less accurate the SVD
will be. This might lead to AA components errone-
ously ending up in the low-rank matrix V. Constrai-
ning V to be sparse in the frequency domain using the
l
1
regularization on Ψ
T
V overcomes that AA compo-
nents, that are constrained to be sparse in time dom-
ain, end up in the V matrix. Notice that we did not
extensively search for efficient dictionaries for Ψ. Ho-
wever, we found that the application of the DCT was
computationally of rather low complexity, while lea-
ding to good performance.
A variety of numerical approaches can be used
to solve the optimization problem in Equation (5),
among which we opt for the alternating direction met-
hod of multipliers (ADMM) (Boyd et al., 2011). This
algorithm solves a convex optimization problem by
breaking it into smaller pieces which are simpler to
implement. Furthermore, ADMM has a fast conver-
gence rate to a reasonable precision in practice. To
solve Equation (5), we follow the same approach and
algorithmic steps introduced in (Xue et al., 2018).
The estimated AAs in A are added back to the corre-
sponding samples in the interpolated electrogram m
0
using a rectangular window. This results in the final
estimated atrial activity
ˆ
a. The ventricular activities
in V are also added to their corresponding samples in
a zero signal of same length as m using a rectangular
window.
3 RESULTS
The proposed framework, from here on referred to as
low-rank and sparse matrix decomposition (LRSD)
method, is tested on clinically recorded epicardial
unipolar electrograms. The electrograms consist of
10 s of induced AF signals recorded at similar loca-
tions on the right atrium of multiple patients, filte-
red (bandwidth 0.5 to 400 Hz) and sampled (1 kHz).
More details on the electrode specifications can be
found in (Yaksh et al., 2015). To provide a clear
understanding of the steps of the algorithm and ena-
ble visual inspection of the results, we initially em-
ploy it on the clinically recorded data and demonstrate
the output of each step. However, in Section 3.2 a
more detailed evaluation will be performed on synt-
hetic data. The results are evaluated using instrumen-
tal measures and will also be compared with TMS and
ICA approaches.
3.1 Experiments on Clinical Data
Figure 1 visualizes a fragment of each stage of the
proposed framework, employed on 10 s of clinically
recorded electrogram during induced AF. The electro-
gram is normalized such that the average ventricular
activity has a maximum amplitude of -1. The 10 se-
conds contain K = 16 VA-containing segments, each
Ventricular Activity Signal Removal in Atrial Electrograms of Atrial Fibrillation
181
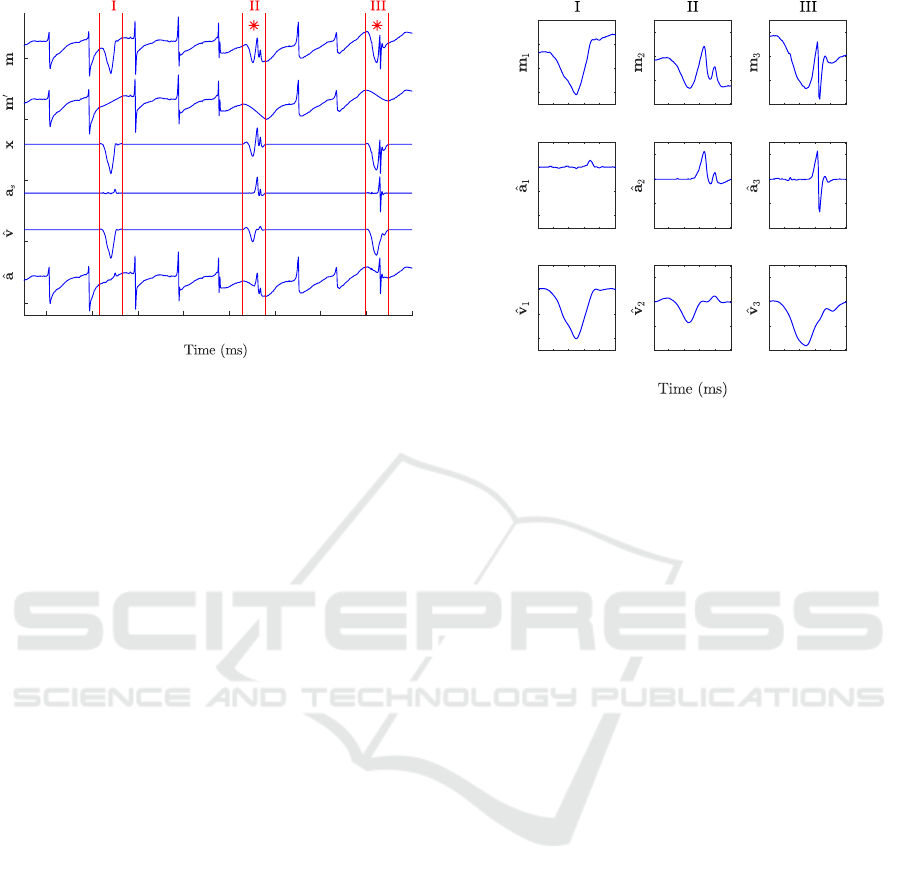
6400 6600 6800 7000 7200 7400 7600 7800 8000
Figure 1: The input electrogram m and output signals at
each stage of the algorithm with
ˆ
v and
ˆ
a as the final ex-
tracted VA and AA output. The onset and offset of VA-
containing segments are denoted by red vertical lines. The
segments where AA and VA overlap are also denoted by *.
windowed with a rectangular window with a fixed
length of W = 100 samples (100 ms). Since the fo-
cus of this study is on introducing the algorithm itself
and not on optimal tuning of its parameters, we used
values that yielded visually good source separation,
that are, α = 0.5, β = 0.8, and r = 3.
The input signal is shown as m in Figure 1. The
VA-containing segments are initially removed and in-
terpolated and the result is shown as m
0
. LRSD is
employed on the data matrix X containing the VA-
containing segments of x = m − m
0
. The separa-
ted atrial and ventricular activities resulting from the
LRSD are plotted as a
s
and
ˆ
v respectively.
ˆ
a = a
s
+m
0
demonstrates the final atrial activity estimated from
the input signal m. For an easier visual inspection,
we show for both
ˆ
a and v in Figure 2 a zoomed ver-
sion of 3 VA-containing segments from the example
in Figure 1.
To compare the performance of the algorithm with
two other approaches we select the TMS (Shkurovich
et al., 1998) and ICA (Rieta et al., 2004) approaches.
TMS, similar to the LRSD, only requires one electro-
gram as well as the ECG signal for detection of VA-
containing segments and is computationally of low
complexity. However, to separate the two sources,
ICA requires the whole ECG signal. Moreover, ta-
king care of the permutation and scaling in the result
of ICA is complicated and can affect its performance.
Figure 3 demonstrates four clinically recorded elec-
trograms m from four different patients as well as
the three estimated atrial components for each patient.
As we can see, LRSD visually provides the best and
smoothest output. The smoothness of the atrial com-
20 60 100 20 60 100 20 60 100
Figure 2: Zoomed version of the three specified VA-
containing segments in Figure 1 as well as
ˆ
v and
ˆ
a as the
final extracted atrial and ventricular activity.
ponent is of high importance for further processing of
the data, since any added distortion might be misin-
terpreted as fractionated AAs.
3.2 Performance Evaluation
Evaluating the performance of the proposed method
using instrumental measures, requires the pure AA
and VA, which are not available from clinically re-
corded data. On the other hand, due to the big range
of variations in AAs and VAs morphology during AF,
generating realistic data for a fair performance eva-
luation is difficult. To avoid these complications and
test the framework on realistic data, we generated the
synthesized data in two steps. First we select a sample
VA-containing segment from the electrogram and we
make sure it does not coincide with AA. We then ex-
tract the VA in this segment using spline interpolation
and subtraction. Since VA does not overlap with AA,
this provides us with well separated AA and VA com-
ponents. The separated VA, referred to as pure VA,
is then added to another location on the same EGM
where it overlaps with pure AA and not with anot-
her VA. The pure VA is also shifted in small steps
(10 ms) to create different degrees of overlap with the
AA. The same steps are also performed on the ECG
signal. Finally, TMS, ICA, and LRSD are employed
on the synthesized data.
To evaluate the performance of the introduced ap-
proaches in separating the AA and VA components,
we use four different instrumental measures. The first
instrumental measure we use is the normalized cross-
correlation coefficient between the pure AA a and the
BIOSIGNALS 2019 - 12th International Conference on Bio-inspired Systems and Signal Processing
182
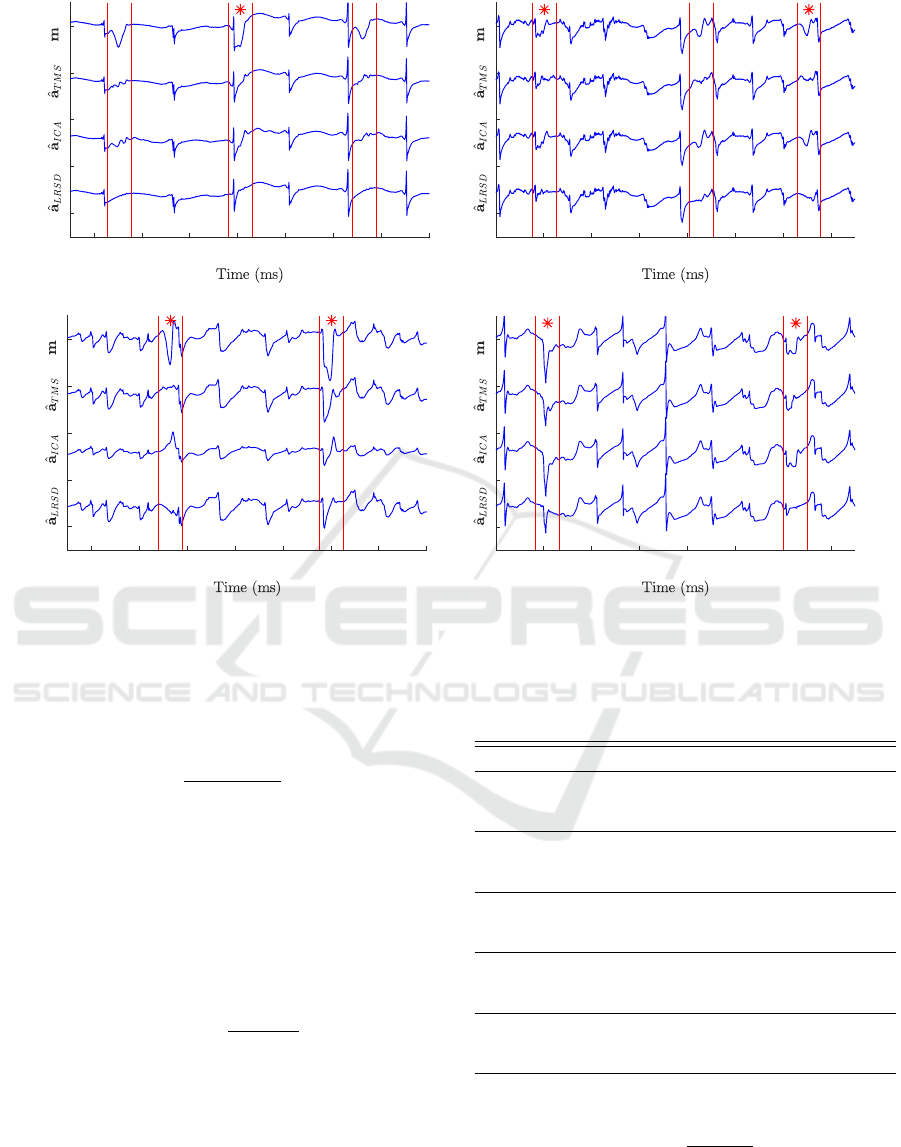
2400 2600 2800 3000 3200 3400 3600 3800
1600 1800 2000 2200 2400 2600 2800 3000
(a) (b)
2200 2400 2600 2800 3000 3200 3400 3600
1800 2000 2200 2400 2600 2800 3000 3200
(c) (d)
Figure 3: The signals from before are respectively the clinically recorded electrogram m from four different patients (a) to
(d), and the separated atrial activity after employing TMS, ICA and the LRSD. The vertical lines indicate the onset and offset
of VA-containing segments. Overlapping AA and VA are indicated by *.
extracted AA
ˆ
a, referred to as the similarity metric,
that is
Si =
cov(a,
ˆ
a)
std(a)std(
ˆ
a)
, (6)
where cov(·) is covariance and std(·) is the standard
deviation. The closer this variable is to 1, the more
similar the signals are. The second instrumental mea-
sure is the mean square error (MSE) between a and
ˆ
a
denoted by MSE
a
. The smaller this value is, the bet-
ter the results. The third instrumental measure is the
ventricular depolarization reduction(VDR) defined as
(Rieta and Hornero, 2007)
VDR =
1 −
max(
|
ˆ
v
|
)
max(
|
v
|
)
(7)
where max(|v|) is the maximum amplitude of ventri-
cular activity that coincides with the R-peak in ECG
and max(|
ˆ
v|) is the maximum amplitude of extrac-
ted ventricular activity. The smaller the VDR is, the
better the ventricular reduction. We also introduce a
new instrumental measure that measures smoothness,
abbreviated as Sm. It is calculated as the the standard
deviation of the first time derivative of the difference
Table 1: Summary of instrumental measures.
MSE
v
Si MSE
a
VDR Sm
P1 0.005 TMS 0.96 0.005 0.19 0.01
ICA 0.29 0.124 0.59 0.03
LRSD 0.75 0.031 0.26 0.02
P2 0.008 TMS 0.89 0.008 0.13 0.01
ICA 0.80 0.058 1.53 0.02
LRSD 0.97 0.007 0.06 0.01
P3 0.021 TMS 0.82 0.02 0.25 0.01
ICA 0.53 2.250 2.64 0.09
LRSD 0.86 0.01 0.04 0.01
P4 0.071 TMS 0.71 0.07 0.32 0.04
ICA 0.36 0.958 2.64 0.09
LRSD 0.84 0.038 0.15 0.03
P5 0.148 TMS 0.68 0.148 0.28 0.07
ICA 0.25 2.820 2.52 0.19
LRSD 0.79 0.038 0.15 0.03
between a and
ˆ
a, which is
Sm = std
d(a −
ˆ
a)
dt
. (8)
The smaller this value is, the less fractionated the re-
sults are.
Table 1 shows the results of the instrumental me-
Ventricular Activity Signal Removal in Atrial Electrograms of Atrial Fibrillation
183

asures evaluated on synthesized data of five different
patients, where the VAs and AAs are separated using
the three introduced approaches TMS, ICA and the
LRSD. The patients are sorted based on the regula-
rity in their VA-containing segments, where the mean
square error between the average of all segments and
the pure VA denoted by MSE
v
is used as the indicator
of the regularity. For all patients, the added pure VA
overlaps with several randomly selected AAs, with
different levels of overlap, except for patient 2 where
we purposely chose samples with no overlap with
AA. The performance of ICA in our simulations is
relatively bad. This might be partly due to (i) the low
quality of the ECG signal we had access to in this
experiment and (ii) the errors in handling the permu-
tation and scaling issues in ICA.
As can be seen, the results with respect to simi-
larity and MSE are quite comparable for all patients,
however as the regularity in VA-containing segments
decreases, the LRSD outperforms the other two ap-
proaches in almost all measures. Only for the first pa-
tient with very regular segments, TMS performs bet-
ter than the proposed LRSD. As previously mentio-
ned, the smoothness is of high importance since the
added distortions might be misinterpreted as fracti-
onated electrograms. However our simulations on
synthesized data show that if the AA is already fracti-
onated, the added distortions after employing TMS
and ICA completely change the morphology of pure
AA, while the LRSD preserves the pure AA morpho-
logy, resulting in better performances.
4 CONCLUSION
In this study we proposed a new framework for re-
moval of VA from atrial electrograms, which is based
on interpolation and subtraction followed by low-rank
and sparse matrix decomposition. The proposed fra-
mework is of low complexity, does not require high
resolution multi-channel recordings, or a calibration
step for each individual patient. The approach outper-
forms the reference methods TMS and ICA with re-
spect to instrumental measures. In particular in cases
where the ventricular activities are less regular. It pro-
vides smooth AA estimates, which is of high impor-
tance for signal processing applications that are based
on the fractionation evaluation in atrial activities.
REFERENCES
Ahmad, A., Salinet, J., Brown, P., Tuan, J. H., Stafford, P.,
Ng, G. A., and Schlindwein, F. S. (2011). Qrs sub-
traction for atrial electrograms: flat, linear and spline
interpolations. Medical & biological engineering &
computing, 49(11):1321–1328.
Boyd, S., Parikh, N., Chu, E., Peleato, B., Eckstein, J.,
et al. (2011). Distributed optimization and statistical
learning via the alternating direction method of mul-
tipliers. Foundations and Trends
R
in Machine lear-
ning, 3(1):1–122.
Hu, Y., Zhang, D., Ye, J., Li, X., and He, X. (2013). Fast
and accurate matrix completion via truncated nuclear
norm regularization. IEEE transactions on pattern
analysis and machine intelligence, 35(9):2117–2130.
Petrutiu, S., Ng, J., Nijm, G. M., Al-Angari, H., Swiryn,
S., and Sahakian, A. V. (2006). Atrial fibrillation and
waveform characterization. IEEE engineering in me-
dicine and biology magazine, 25(6):24–30.
Rieta, J. J., Castells, F., S
´
anchez, C., Zarzoso, V., and
Millet, J. (2004). Atrial activity extraction for
atrial fibrillation analysis using blind source separa-
tion. IEEE Transactions on Biomedical Engineering,
51(7):1176–1186.
Rieta, J. J. and Hornero, F. (2007). Comparative study of
methods for ventricular activity cancellation in atrial
electrograms of atrial fibrillation. Physiological mea-
surement, 28(8):925.
Shkurovich, S., Sahakian, A. V., and Swiryn, S. (1998).
Detection of atrial activity from high-voltage leads of
implantable ventricular defibrillators using a cancel-
lation technique. IEEE Transactions on Biomedical
Engineering, 45(2):229–234.
Xue, Z., Dong, J., Zhao, Y., Liu, C., and Chellali, R. (2018).
Low-rank and sparse matrix decomposition via the
truncated nuclear norm and a sparse regularizer. The
Visual Computer, pages 1–18.
Yaksh, A., van der Does, L. J., Kik, C., Knops, P., Oei, F. B.,
van de Woestijne, P. C., Bekkers, J. A., Bogers, A. J.,
Allessie, M. A., and de Groot, N. M. (2015). A novel
intra-operative, high-resolution atrial mapping appro-
ach. Journal of Interventional Cardiac Electrophysio-
logy, 44(3):221–225.
BIOSIGNALS 2019 - 12th International Conference on Bio-inspired Systems and Signal Processing
184
