
A Combination of Histogram of Oriented Gradients and Color Features
to Cooperate with Louvain Method based Image Segmentation
Thanh-Khoa Nguyen
1,2
, Mickael Coustaty
1
and Jean-Loup Guillaume
1
1
L3i Laboratory, University of La Rochelle, France
2
Ca Mau Community College, Vietnam
Keywords:
Image Segmentation, Complex Networks, Modularity, Superpixels, Louvain Algorithm, Community De-
tection.
Abstract:
This paper presents an image segmentation strategy using histograms of oriented gradients (HOG), color
features and Louvain method, a community detection on graphs algorithm, to tackle the image segmentation
problem. This strategy relies on the use of community detection based image segmentation which often leads
to over-segmented results. To address this problem, we propose an algorithm that agglomerates homogeneous
regions using texture and color features properties. The proposed algorithm is tested on the publicly available
Berkeley Segmentation Dataset (BSDS300 and BSDS500), and the Microsoft Research Cambridge Object
Recognition Image Database (MSRC) datasets. The experimental results point out that our method produces
sizable segmentation and outperforms almost other known methods in terms of accuracy and comparative
metrics scores.
1 INTRODUCTION
Image segmentation has become an indispensable
task that is widely employed in several image proces-
sing applications including object detection (Liu and
Chen, 2008), object tracking (Zhou et al., 2000), au-
tomatic driver assistance (Chen et al., 2008), and traf-
fic control systems (Junwei and Shaokai, 2013), etc.
The goal of image segmentation is not only to distin-
guish the interesting objects from the background, but
also to identify them in an image. A variety of pro-
posed algorithms have dealt with image segmentation
in the literature. These methods can be divided into
some main groups according to the underlying appro-
aches, such as feature-based clustering, spatial-based
segmentation methods, hybrid techniques and graph-
based approaches.
Recently, complex networks have mushroomed
both theories and applications as a trend of develop-
ments. Hence, image segmentation techniques ba-
sed on community detection algorithms have been
proposed and have become an interesting discipline
in the literature (Youssef Mourchid, Mohammed El
Hassouni and Hocine Cherifi, 2015; Youssef Mour-
child, Mohammed El Hassouni and Hocine Cherifi,
2016; Abin et al., 2011; Li and Wu, 2015; Mour-
chid et al., 2017; Linares et al., 2016; Li, 2013; Bro-
wet et al., 2011). A community is a group of nodes
with dense internal connections and sparse connecti-
ons with members of other communities. The general
idea of those techniques is to highlight the similarity
between the modularity criterion in network analysis
and the image segmentation process. In fact, the lar-
ger the modularity of a network is, the more accu-
rate the detected communities, i.e., the objects in the
image, are (Browet et al., 2011; Youssef Mourchid,
Mohammed El Hassouni and Hocine Cherifi, 2015;
Mourchid et al., 2017; Abin et al., 2011). If the mo-
deling of the image in a graph is well done then we
can expect that a good partition in communities cor-
responds to a good segmentation of the image. The
modularity of a partition is a scalar that measures the
density of links inside communities as compared to
links between communities, and its value falls into the
interval [-0.5,1] (Newman and Girvan, 2004).
Among all the existing community detection algo-
rithms, the Louvain method (Blondel et al., 2008) has
received significant attention in the context of image
segmentation (Li and Wu, 2015; Youssef Mourchild,
Mohammed El Hassouni and Hocine Cherifi, 2016;
Browet et al., 2011). However, it is still facing a
problem of over-segmentation. In this paper, we pro-
pose a new segmentation approach based on the Lou-
vain method that agglomerates homogeneous regions
280
Nguyen, T., Coustaty, M. and Guillaume, J.
A Combination of Histogram of Oriented Gradients and Color Features to Cooperate with Louvain Method based Image Segmentation.
DOI: 10.5220/0007389302800291
In Proceedings of the 14th International Joint Conference on Computer Vision, Imaging and Computer Graphics Theory and Applications (VISIGRAPP 2019), pages 280-291
ISBN: 978-989-758-354-4
Copyright
c
2019 by SCITEPRESS – Science and Technology Publications, Lda. All rights reser ved

in order to overcome the over-segmentation problem.
Each sub-segment obtained during the Louvain met-
hod phase represents a region. We compute a histo-
gram of oriented gradients (HOG) (Dalal and Triggs,
2005), and the values of mean and standard deviation
are computed from the three color channels RGB in-
dividually. Then, the proposed algorithm operates by
considering the similarity value between two adjacent
regions based on combining HOG and color features
in order to control the aggregation processes.
The rest of this paper is organized as follows. In
Section 2, we briefly review graph-based image seg-
mentation methods. In Section 3, we introduce com-
plex networks, the concept of community detection
and Louvain algorithm to point out how community
detection algorithms can be applied in image segmen-
tation efficiently. In Section 4, we give details of our
method for implementation and performance. Experi-
ments on three publicly available datasets are reported
in Section 5. Finally, our conclusions are presented in
Section 6.
2 RELATED WORK
In this Section, we briefly review some well-known
graph-based image segmentation methods.
Considering image segmentation problem from
the perspective of graph partitioning has interested se-
veral researchers. In this approach, the image is regar-
ded as an undirected weighted graph in which each
node represents a pixel, and edge weights measure
the similarity between nodes, i.e., similarity between
pixels. The graph is clustered by optimizing any ade-
quate criteria, e.g., minimum cut, normalized cut or
related variants. (Shi and Malik, 2000).
Felzenszwalb and Huttenlocher (Felz-Hutt) (Fel-
zenszwalb and Huttenlocher, 2004) attempt to par-
tition image pixels into components. Constructing
a graph in which pixels are nodes, and edge weig-
hts measure dissimilarity between nodes (e.g., color
differences), each node is initially placed in its own
component. The internal difference of a component
Int(R) has been defined as the largest weight in the
minimum spanning tree of R. Considering in non-
decreasing order by weight of edges, each step of the
algorithm merges components R
1
and R
2
connected
by the current edge if the weight of the edge is less
than:
min(Int(R
1
) + τ(R
1
),Int(R
2
) + τ(R
2
)) (1)
where τ(R) = k/|R|, k is a scale parameter that can
be used to set a preference for component size.
Recently, complex networks analysis domain has
been considered to segment images, and has achie-
ved outstanding results (Mourchid et al., 2017; Lina-
res et al., 2016; Abin et al., 2011; Li and Wu, 2015).
The idea that community detection can be used for
image segmentation offers a new perspective.
Wenye Li (Li, 2013), and Youssef, et al. (Yous-
sef Mourchild, Mohammed El Hassouni and Hocine
Cherifi, 2016) attempt to apply community detection
problems in complex networks to solve image seg-
mentation problems, and investigate a new graph-
based image segmentation as well as compare other
methods. These studies point out the potential per-
spective of community detection based image seg-
mentation domain.
The image segmentation approaches of Ahmad
Ali Abin et al. (Abin et al., 2011), and Oscar A. C.
Linares et al. (Linares et al., 2016) are constructing
weighted networks in which the small homogeneous
regions (super-pixels) obtained by initial segmenta-
tion processes are nodes of the graph, and the com-
puted similarity distances between these regions are
edge weights. One community detection method is
applied to extract communities as segments.
Shijie Li, et al. (Li and Wu, 2015), and Yous-
sef Mourchid, et al. (Mourchid et al., 2017) pro-
pose using super-pixel and features to solve the over-
segmentation problem. Both strategies initialize with
an over-segmented image segmentation in which each
subsegment represents a super-pixel. Then, they treat
the over-segmentation issue in different ways. Shi-
jie Li, et al. solve it by reconstructing the neighbor-
hood system for each region (super-pixel) and the his-
togram of states (HoS) texture feature. Then, they es-
timate the distribution of the color feature for each re-
gion. The similarity matrix W is computed and adap-
tively updated based on color feature and histogram of
states (HoS) texture feature. Youssef Mourchid, et al.
approach the over-segmented problem in a quite si-
milar way but they compute coefficients to adaptively
update the similarity matrix W based on color feature
and histogram of oriented gradients (HOG) texture fe-
ature.
3 DESCRIPTION OF APPROACH
We consider images from the perspective of a com-
plex network, and solve the image segmentation pro-
blem using community detection on graphs. The
complex network is built by considering that each
pixel is a vertex, and edge weight measures the simila-
rity of a pair of pixels. Then, the Louvain algorithm is
applied to the obtained network but this method does
A Combination of Histogram of Oriented Gradients and Color Features to Cooperate with Louvain Method based Image Segmentation
281
not overcome the over-segmentation problem. Our al-
gorithm is therefore built on top of the Louvain met-
hod, using HOG and color features so as to avoid this
drawback and produce more accurate results.
3.1 Complex Networks
A complex network is a graph (network) whose topo-
logical structure cannot be trivially described. It com-
prises properties that emerge as a consequence of glo-
bal topological organization of the system. Complex
network structures describe various systems of high
technological and intellectual importance, such as the
Internet, World Wide Web, financial, social, neural,
and communication networks. One property that has
attracted particular attention is the community struc-
ture of these networks.
The problem of community detection is usually
defined as finding the best partition (or covering) of
a network into communities of densely connected
nodes, with the nodes belonging to different com-
munities being only sparsely connected. Several
algorithms have been proposed to find good partitions
in a fast way. These algorithms can be divided into
some main types such as, divisive algorithms that de-
tect inter-community links and remove them from the
network, agglomerative (or hierarchical clustering)
algorithms that merge similar or close nodes and
more generally optimization methods are based on
the maximization of an objective function (Fortunato,
2010). The qualities of partitions resulting from
these methods are often measured by the modularity
that has been introduced by Newman and Girvan
(Newman and Girvan, 2004). It is defined as follows:
Q =
∑
i
(e
ii
− a
2
i
) (2)
where e
ii
denotes the fraction of edges in community
i and a
i
if the fraction of ends of edges that belong to
i. The value of modularity Q ranges in [-0.5,1] and
higher values indicate stronger community structure
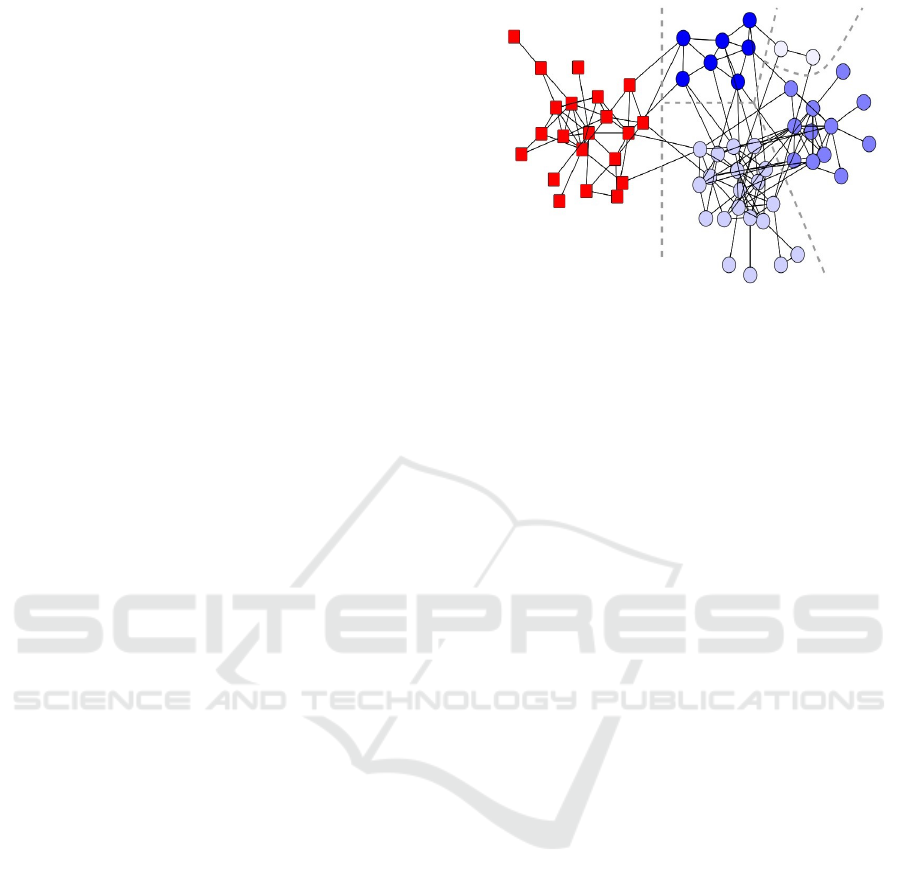
of the network. Figure 1 shows a partitioning into
two communities of a real-world graph.
3.2 From Images to Complex Networks
Complex networks can be generated from ima-
ges. Each image is represented as an undirected
graph G = (V,E), where V is a set of vertices
(V = {v
1
,v
2
,...,v
n
}) and E is a set of edges (E =
{e
1
,e
2
,...,e
k
}). Each vertex v
i
∈ V corresponds to an
individual pixel and similarity/closeness of pixels are
modeled as edges: an edge e
i j
∈ E connects vertices
v
i
and v
j
. The weight of each edge, w
i j
, is a non-
negative value that measures the affinity between v
i
Figure 1: Community structure in the social network of
bottle-nose dolphins population extracted using the algo-
rithm of Girvan and Newman (Girvan and Newman, 2002).
The squares and circles denote the primary split of the net-
work into two groups and the circles are further subdivided
into four smaller group as (Newman, 2004).
and v
j
. A higher affinity represents a stronger relation
between corresponding pixels.
In this paper, edge weights are defined as:
w
i j
=
(
1 i f d
c
i j
≤ t for all color channels c
nil otherwise
(3)
where t is a threshold, d
c
i j
is a measure of the simi-
larity of pixels i and j intensity for color channel c
(among R, G and B). It is defined by d
c
i j
=
I
c
i
− I
c
j
where I
c
i
and I
c
j
represent the intensity of pixel i and j
respectively for channel c.
For a given pixel, links towards other pixels are
created if and only if other considered pixels are in-
side 20 neighboring pixels for rows and columns di-
rections. Plus all distances d
c
i j
of color channels must
be lower than t for the edge to be considered. In this
case, the weight is assigned w
i j
= 1. Empirically, the
20 value is based on several experiments that shows a
relatively good performance with this value. Note that
we could have put an edge and a weight that reflect the
distance (both physical distance and color distance) in
a more complex way but this is left for future investi-
gations.
3.3 Louvain Algorithm
The Louvain method (Blondel et al., 2008) is a hier-
archical greedy algorithm that is designed to optimize
the modularity (see Equation 2) on graphs or weigh-
ted graphs.
Louvain algorithm is an iterative process that con-
sists of two phases. Initially, every node is a singleton
community. Next, during the first phase, all nodes
are considered one by one. Each node is placed in its
VISAPP 2019 - 14th International Conference on Computer Vision Theory and Applications
282
neighboring community, including its own one, that
maximizes the static modularity gain. This process is
repeated until no further improvement can be achie-
ved and this first phase therefore stops when the mo-
dularity reaches a local maximum. Then, the second
phase consists in building a new graph whose nodes
are the communities found during the first phase. To
build this graph, links between nodes of the same
community lead to self-loops while the weights of
links between new nodes are computed by the sum
of the weights of the links between nodes in the cor-
responding two communities. The global process is
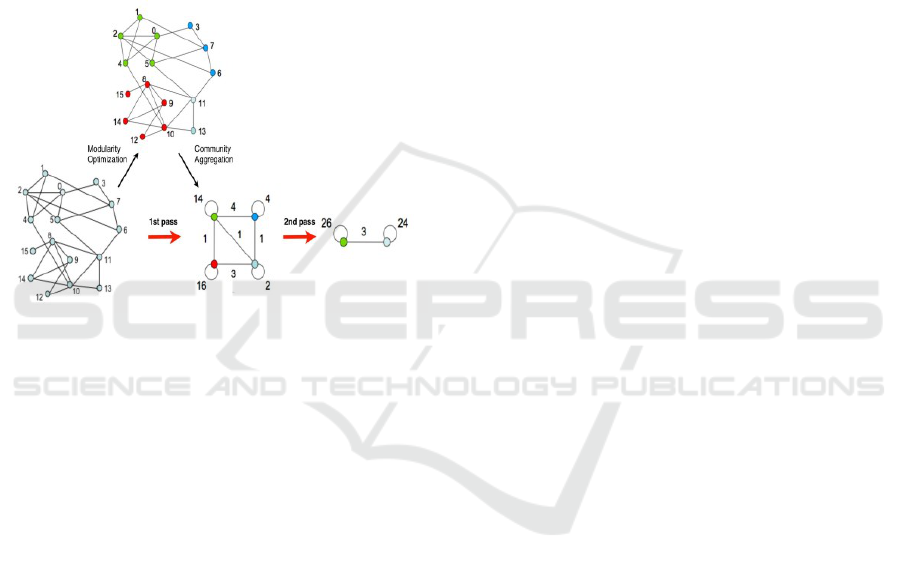
illustrated in Figure 2.
Figure 2: Process of community detection for Louvain met-
hod (Blondel et al., 2008). Each pass consists of two phases:
modularity optimization using local movements and aggre-
gation of communities.
3.4 Merging Homogeneous Regions
Algorithm
Maximizing modularity is a NP-hard problem and
community detection algorithms are generally heu-
ristics algorithms (mostly without guarantee) and
not exact ones. Furthermore, image segmenta-
tion based community detection often leads to over-
segmentation (Nguyen et al., 2018b). In order to solve
this problem, a solution is to combine homogeneous
regions whenever possible (Nguyen et al., 2018a).
Given an over-segmented image that consists of a
set of homogeneous regions. Let regthres is the thres-
hold that defines the number of pixels in one small
region, function C(R
i
) returns the number of pixel in
region R
i
and threshold(t) is the similarity distance
threshold. Our algorithm can merge these regions in
order to generate better segmented image results. It is
described as Pseudocode below:
Algorithm MHR
Input: A set of regions R = {R
1
,R
2
,...,R
n
}
01: for (R
i
∈ R) do
02: for (R
j
∈ R; i 6= j) do
03: if (R
i
and R
j
are adjacent regions)
04: if ((C(R
i
) < regthres) OR
(C(R
j
) < regthres))
05: Merge region R
i
and region R
j
06: else
07: Compute similarity distance
d(R
i
,R
j
)
08: if (d(R
i
,R
j
) >= threshold(t))
09: Merge region R
i
and region R
j
10: end if
11: end if
12: end if
13: end for
14: end for
Output: The set of image segmentation result
R = {R
1
,R
2
,...,R
k
}
4 IMPLEMENTATION AND
PERFORMANCE
In this Section, we detail our implementation strategy
and study the effects of various choices on performan-
ces.
4.1 Features for Similarity
In the algorithm MHR, the similarity between region
R
i
and region R
j
is computed as using Equation 12
that we will detail below. The primary straightfor-
ward feature for image segmentation is color (Li and
Wu, 2015; Mourchid et al., 2017) which is essential
when segmenting images using community detection.
However, the color feature alone cannot achieve good
segmentation if the image is composed of repetitive
patterns of different colors in many homogeneous ob-
jects. In the proposed algorithm, we incorporate the
histogram of oriented gradients (HOG) and the color
features into a so-called similarity feature vector that
represents each region.
4.1.1 The HOG Feature
The histogram of oriented gradients is computed ba-
sed on a grayscale image: given a grayscale image I,
we extract the gradient magnitude and orientation as
using the 1D centered point discrete derivative mask
(4), (5) in the horizontal and vertical directions to
compute the gradient values.
A Combination of Histogram of Oriented Gradients and Color Features to Cooperate with Louvain Method based Image Segmentation
283

D
X
=
−1 0 1
(4)
and
D
Y
=
−1
0
1
(5)
We obtain the x and y derivatives by used a convolu-
tion operation (6), (7).
I
X
= I ∗ D
X
(6)
and
I
Y
= I ∗ D
Y
(7)
In this paper, we decided to use the oriented gradient
given by Equation 8 to build the similarity feature
vectors.
θ = arctan
I
Y
I
X
(8)
In the implementation, we use the function atan2
that returns a value in the interval (−π, π]. The orien-
tation of gradient at a pixel is θ = atan2(I
Y
,I
X
) ra-
dians. The angle degrees are transformed by α =
θ ∗ 180/π, that give values in the range (-180, 180]
degrees. To shift into signed gradient we apply for-
mula 9 and obtain the range of the gradient [0, 360).
The orientation of gradient is put into 9 bins that re-
present 9 elements in the similarity feature vectors.
For each region, we compute the HOG feature by the
statistic of the percentage of oriented gradient bins.
α =
(
α, i f α ≥ 0
α + 360, i f α < 0
(9)
4.1.2 The Color Feature
For the color feature, we consider color images (with
RGB color space, but other color spaces could be used
as the principle remains generic) on individually co-
lor channels. For each region, we compute Mean and
Standard deviation for every channel of colors as for-
mulas (10), (11) which contribute 6 elements in the
similarity feature vectors.
Mean(R) =
n
∑
i=1
C
i
n
(10)
SD(R) =
v
u
u
u
t
n
∑
i=1
(C
i
− Mean(R))
2
n
(11)
where C
i
is the color value channel of pixel i in image
and n is the number of pixels in the set R.
4.1.3 The Similarity Feature Vectors
For every region, we build a similarity feature vector
including 9 elements coming from the HOG features
and 6 elements coming from the color features. The
HOG features for a region is obtained by the compu-
ting of percentage of oriented gradient bins. The co-
lor features are obtained by the combination of three
pairs of Mean and Standard deviation for every color
channels. The similarity distance of two adjacent re-
gions R
i
and R
j
is computed by cosine similarities of a
pair of 15-dimensional vectors a
i
,a
j
that represented
to two considering regions (a
i
,a
j
∈ R
15
), as indicated
in equation (12).
d(R
i
,R
j
) = Cosine(a
i
,a
j
) =
a
|
i
a
j
ka
i
k.ka
j
k
(12)
4.2 Noise Removal
In the implementation, a primary technique that must
be pointed out is the noise removal process. As men-
tioned above, the results obtained from Louvain pro-
cesses consist of over-segmented results, which de-
crease the quality when evaluated. In this paper, we
recommend applying a noise removal strategy that of-
fers better results and obtains higher evaluation sco-
res. The removing noise process is a crucial part
of our algorithm because it merges the small regions
that remain after Louvain process. Empirically, we
tried different values to set the threshold regthres =
{100,200,...,600} on our sample dataset (a part of
BSDS500) and obtained some potential insights: it
is stable in terms of PRI score when the threshold
regthres is in the range {100, 200, 300}. Therefore,
we set the threshold for small regions to be regthres =
200 pixels for testing and evaluating on datasets.
5 EXPERIMENTAL EVALUATION
This Section provides experiments that were perfor-
med to assess our algorithm. To evaluate the pro-
posed model, we used three publicly available da-
tasets for image segmentation: Berkeley Segmenta-
tion Data Set 300 (BSDS300) (Martin et al., 2001),
Berkeley Segmentation Data Set 500 (BSDS500) (Ar-
belaez et al., 2011) and MSRC object Recognition
Data Set (MSRC) (Shotton et al., 2006). Three wi-
dely used evaluation segmentation metrics: Variation
of Information (VI) (Meila, 2005), Segmentation Co-
vering (SC) (Arbelaez et al., 2009) and Probabilistic
Rand Index (PRI) (Pantofaru and Hebert, 2005) have
been applied to measure the accuracy of proposed al-
VISAPP 2019 - 14th International Conference on Computer Vision Theory and Applications
284

gorithm. The qualitative and quantitative evaluation
are presented below in Tables 1, 2 and 3.
5.1 Datasets
The Berkeley Segmentation Data Set 300 (BSDS300)
has been built with the aim of providing an empirical
basis for research on image segmentation and boun-
dary detection. This dataset comprises 300 images,
including 200 images for training and 100 images for
validation. Each image has 481 x 321 pixels, which
yields a graph of 154401 vertices. The BSDS300 also
provides multiple ground-truth segmentation images
that are manually generated by many human subjects.
For every image, there are from 5 to 10 ground-truth
segmentation maps.
The Berkeley Segmentation Data Set 500
(BSDS500) is an extension of BSDS300. This
dataset comprises 500 images, including 200 images
for training, 200 new testing images and 100 images
for validation. Each image has 481 x 321 pixels and
has in average 5 ground-truth segmentation maps.
Supplying a benchmark for comparing different
segmentation and boundary detection algorithms.
The Microsoft Research Cambridge Object Re-
cognition Image Database (MSRC) contains a set of
591 natural images of size 320 x 213 with one ground-
truth per image grouped into categories. Its intended
use is research, in particular object recognition rese-
arch.
5.2 Evaluation Metrics
In general, evaluation segmentation metrics have been
used to evaluate different image segmentation algo-
rithms in the literature. Some common one include
Variation of Information (VI) (Meila, 2005), Segmen-
tation Covering (SC) (Arbelaez et al., 2009) and Pro-
babilistic Rand Index (PRI) (Pantofaru and Hebert,
2005). Especially, PRI brings exceedingly benefit of
evaluation on BSDS300 and BSDS500 datasets which
provide multiple ground-truth.
The Probabilistic Rand Index (PRI) (Pantofaru
and Hebert, 2005) is a classical evaluation criterion
for clustering. The PRI measures the probability that
pair of pixels have consistent labels in the set of ma-
nual segmentation maps (ground-truth). Given a set
of ground-truth segmentation images {S
k
}, the Pro-
babilistic Rand Index is defined as:
PRI(S
test
,{S
k
}) =
1
T
∑
i< j
[c
i j
p
i j
+ (1 − c
i j
)(1 − p
i j
)]
(13)
where c
i j
is the event that the algorithm gives the
same label to pixels i and j, and p
i j
corresponds to
the probability of the pixels i and j having the same
label, and is estimated by using sample mean of the
corresponding Bernoulli distribution on the ground-
truth dataset. T is the total number of pixel pairs. The
PRI values range in [0,1] in which a larger value likely
indicates a greater similarity between these segmenta-
tion images.
The Variation of Information (VI) metric was
introduced for the evaluation of clustering (Meila,
2005). It measures the distance between two cluste-
rings in terms of the information difference between
them. VI is defined by:
V I(C ,C
0
) = H(C) + H(C
0
) − 2I(C,C
0
) (14)
where H(C ) and H(C
0
) are the entropy of segmen-
tation image C and ground-truth C
0
, respectively and
I(C,C
0
) is the mutual information of two segmenta-
tion image C and ground-truth image C
0
. Let seg-
mentation image C and ground-truth image C
0
have
N levels of gray and distributions are uniform, i.e.
PN=1/N. The maximal values of entropies H(C) =
logN and H(C
0
) = logN, and let mutual information
I(C,C
0
) be equal to zero. Hence, the range of this me-
tric is [0,2logN], and the smaller value is the better
segmentation results.
The Segmentation Covering (SC) metric that me-
asures averaged matching between proposed segment
with a ground-truth labeling was introduced by Arbe-
laez et al. (Arbelaez et al., 2009). It is defined by:
SC(S,S
g
) =
1
N
∑
R∈S
|R|. max
R
0
∈S
g
O(R,R
0
) (15)
where N denotes the total number of pixels in the
image and the overlap between two regions R and R
0
,
defined as:
O(R,R
0
) =
|R ∩ R
0
|
|R ∪ R
0
|
(16)
5.3 Results
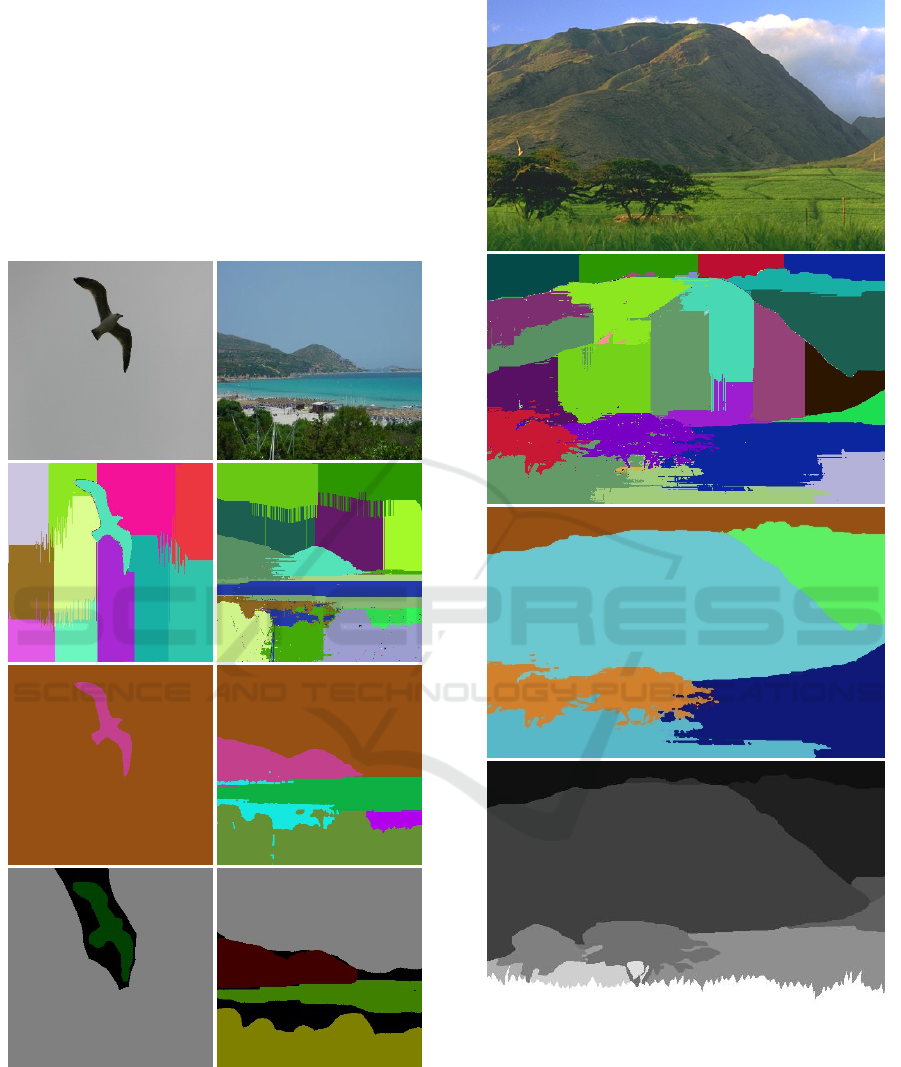
For qualitative evaluations, we present some images
of the segmentation results in Figure 3 and Figure 4,
collected from the dataset BSDS300. Figure 5 and Fi-
gure 6 are the representations for MSRC dataset seg-
mented image results. Finally, Figure 7 and Figure
8 displays some segmentation images of the dataset
BSDS500. For these qualitative results, we can see
that the proposed algorithm offers good results and
produces sizable regions for all selected images. Our
algorithm can aggregate homogeneous neighboring
regions successfully even if pixels inside each region
are dissimilar. Besides the success of our method, it
remains a challenge for segmenting images whose co-
lors contained are quite different in parts of an object
A Combination of Histogram of Oriented Gradients and Color Features to Cooperate with Louvain Method based Image Segmentation
285
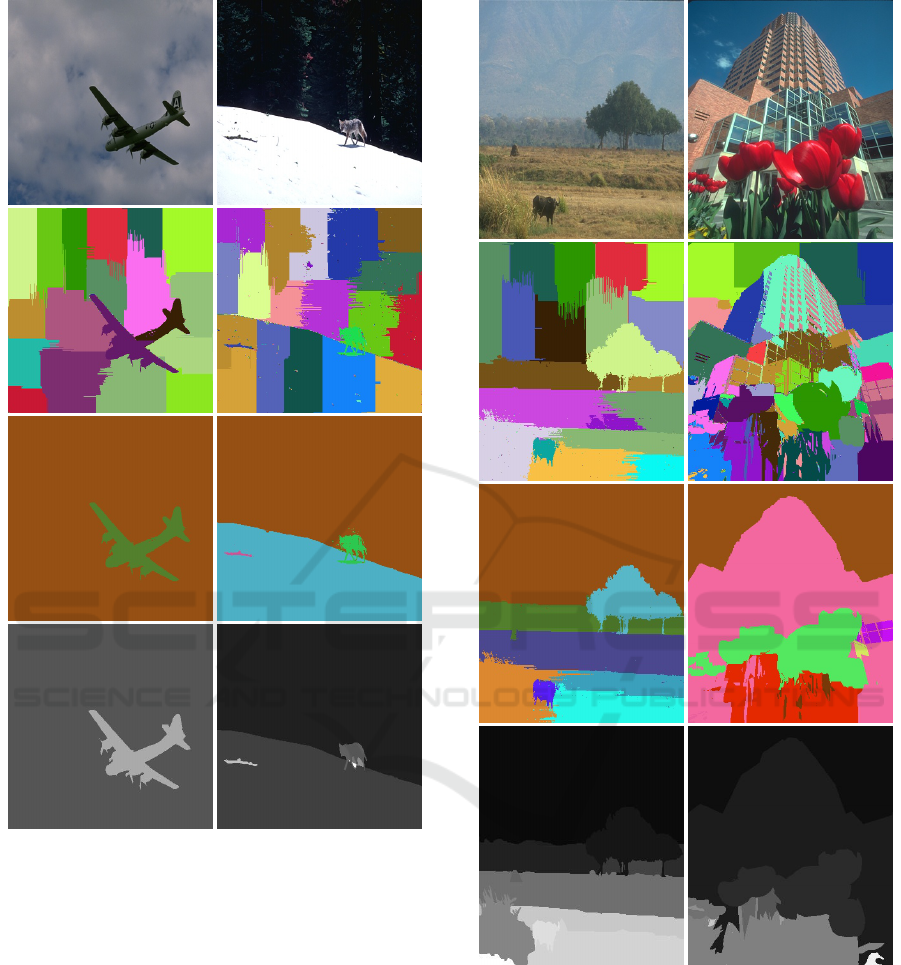
Figure 3: Top: Original images. Second line: Segmentation
results obtained by the Louvain method. Third line: Seg-
mentation results with the proposed algorithm. Fourth line:
Ground-truth.
as we point out in Figure 9 and Figure 10. To solve
this problem, we attempted to build a graph which en-
codes both texture and color features but is this left for
future research.
From a quantitative point of view, we evaluated
the segmentation results using evaluation metrics pre-
sented in section 5.2 (PRI, VI, SC) by comparing a
test segmentation with multiple ground-truth images.
We applied these evaluation metrics on the MSRC da-
taset, detailed results are given in Table 1. We run
MHR algorithm on the validation set from the Berke-
ley segmentation data set 300 (BSDS300) and the test
data set BSDS500, detailed results are given in Table
2 and Table 3, respectively.
Figure 4: Top: Original images. Second line: Segmentation
results obtained by the Louvain method. Third line: Seg-
mentation results with the proposed algorithm. Fourth line:
Ground-truth.
The evaluation results give the successful roof
for our algorithm. Our method exceeds all previous
graph-based algorithms in terms of PRI scores. Empi-
rically, the threshold range for the agglomeration pro-
cess is only taking range from 0.940 to 0.999 (with
0.005 intervals). The best results are recorded when
the value of cosine similarity distance equal to 0.995.
Cosine similarity distance domain that offers best re-
VISAPP 2019 - 14th International Conference on Computer Vision Theory and Applications
286
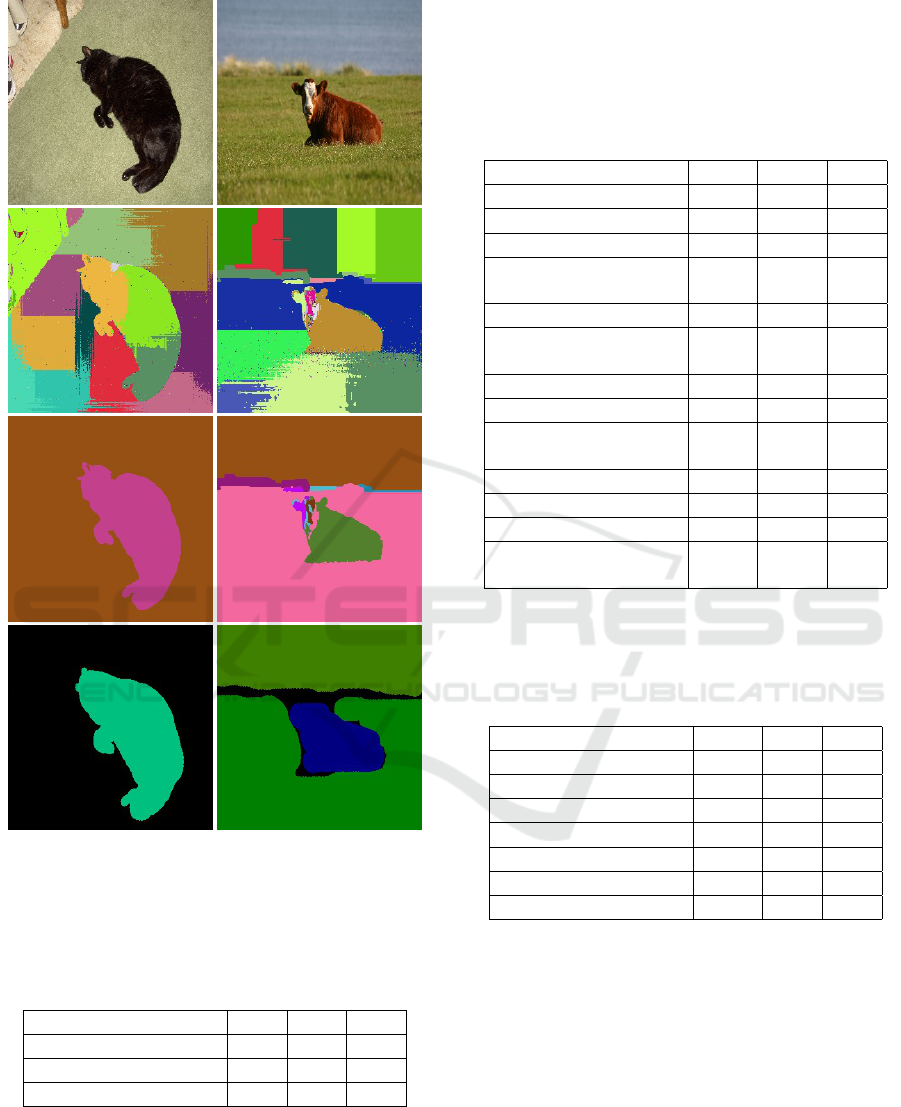
Figure 5: Top: Original images. Second line: Segmentation
results obtained by the Louvain method. Third line: Seg-
mentation results with the proposed algorithm. Fourth line:
Ground-truth.
Table 1: Quantitative comparisons on MSRC Object Re-
cognition Data set using the proposed algorithm and gPb-
owt-ucm and Canny-owt-ucm (Arbelaez et al., 2011).
Methods
PRI VI SC
gPb-owt-ucm
- - 0.75
Our algorithm
0.74 1.36 0.75
Canny-owt-ucm
- - 0.68
sults in our algorithm fall into [0.990, 0.999]. Note
that the regions belong to one segment have HOG and
color features properties in common to each other.
Table 2: Quantitative comparisons on BSDS300 validation
set of the proposed algorithm and gPb-owt-ucm and Canny-
owt-ucm (Arbelaez et al., 2011), Lv-ara (Nguyen et al.,
2018a), HOG and FMS(HOG) (Mourchid et al., 2017),
RGB(HoS) (Li and Wu, 2015), Lv-ahr (Nguyen et al.,
2018b), Mean Shift (Comaniciu and Meer, 2002), NCuts
(Cour et al., 2005), Felz-Hutt (Felzenszwalb and Huttenlo-
cher, 2004).
Methods
PRI VI SC
Human
0.870 1.16 -
Our algorithm
0.822 1.399 0.74
Lv-ara
0.819 - -
Youssef Mourchild’s
(FMS(HOG))
0.811 - -
gPb-owt-ucm
0.810 1.47 0.75
Youssef Mourchild’s
(HOG))
0.803 - -
Lv-ahr
0.80 - -
Mean Shift
0.780 1.63 0.66
Shijie Li’s method
(L*a*b (HoS))
0.777 1.879 -
Felz-Hutt
0.770 1.79 0.68
Canny-owt-ucm
0.770 1.81 0.66
NCuts
0.750 1.84 0.66
Shijie Li’s method
(RGB (HoS))
0.749 2.149 -
Table 3: Quantitative comparisons on BSDS500 test set of
the proposed algorithm and Pb-owt-ucm and Canny-owt-
ucm (Arbelaez et al., 2011), Mean Shift (Comaniciu and
Meer, 2002), NCuts (Cour et al., 2005), Felz-Hutt (Felzen-
szwalb and Huttenlocher, 2004).
Methods
PRI VI SC
Human
0.870 1.17 -
Our algorithm
0.835 1.30 0.74
gPb-owt-ucm
0.830 1.48 0.74
Felz-Hutt
0.800 1.87 0.69
Mean Shift
0.790 1.64 0.66
Canny-owt-ucm
0.790 1.89 0.66
NCuts
0.780 1.89 0.67
6 CONCLUSION
This paper proposes an efficient agglomerative algo-
rithm cooperating with the Louvain method for com-
munity detection to implement image segmentation.
Our method is significantly accurate and produces ef-
ficient image segmentation results. The novelty in this
paper is the consideration of HOG and color features
properties in order to build a 15-dimensional vector
for each region and proposal to apply cosine simi-
larity distance for aggregation processes. Our met-
hod does not need to recompute the feature properties
A Combination of Histogram of Oriented Gradients and Color Features to Cooperate with Louvain Method based Image Segmentation
287
when operated merging processes. Hence, the time
complexity has been reduced significantly compared
with the classical use of a 256-dimensional vector for
each region and the recomputation of feature proper-
ties for every merging processes that is implemen-
ted in some other techniques. Extensive experiments
have been performed, and the results show that the
proposed algorithm can reliably segment the image
and avoid over-segmentation in order to produce more
accurate objects and enhance computing performance
efficiently.
Figure 6: Top: Original images. Second line: Segmentation
results obtained by the Louvain method. Third line: Seg-
mentation results with the proposed algorithm. Fourth line:
Ground-truth.
Figure 7: Top: Original images. Second line: Segmentation
results obtained by the Louvain method. Third line: Seg-
mentation results with the proposed algorithm. Fourth line:
Ground-truth.
VISAPP 2019 - 14th International Conference on Computer Vision Theory and Applications
288
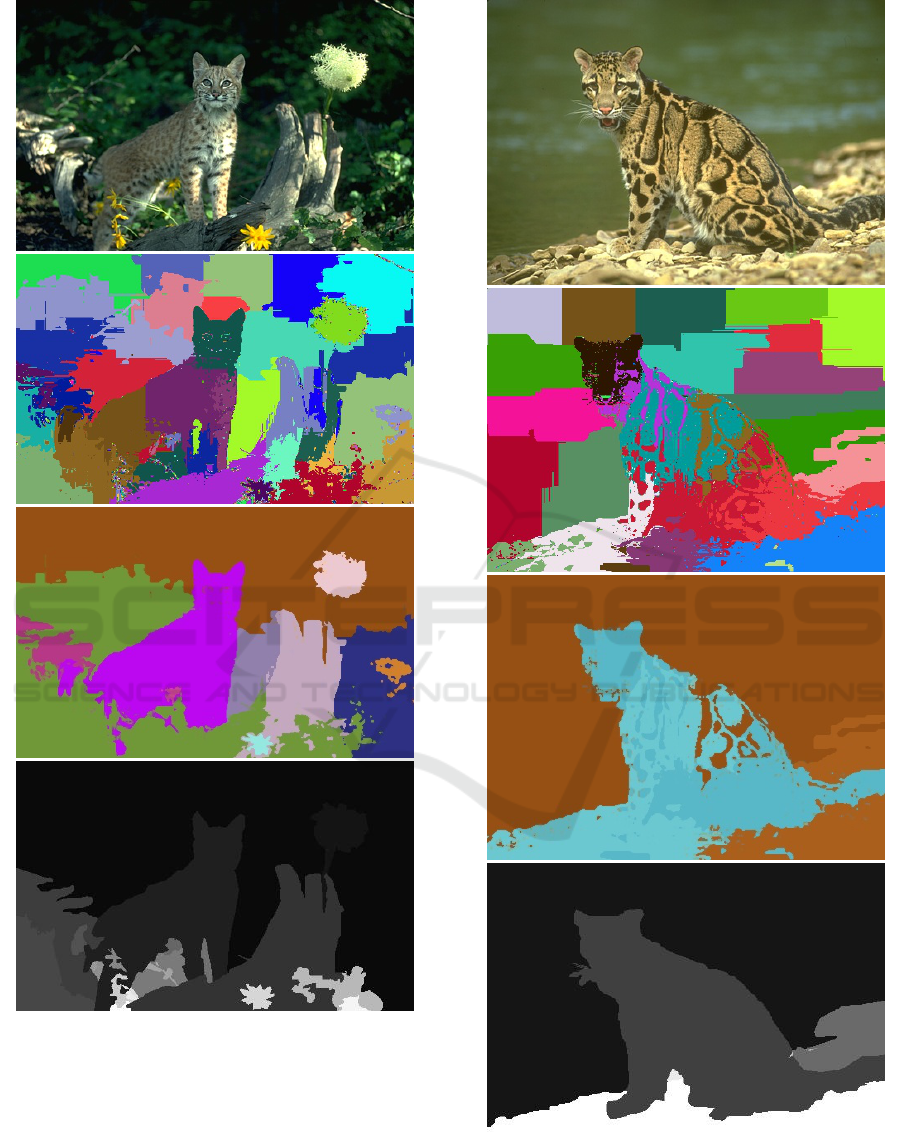
Figure 8: Top: Original images. Second line: Segmentation
results obtained by the Louvain method. Third line: Seg-
mentation results with the proposed algorithm. Fourth line:
Ground-truth.
Figure 9: Top: Original images. Second line: Segmentation
results obtained by the Louvain method. Third line: Seg-
mentation results with the proposed algorithm. Fourth line:
Ground-truth.
A Combination of Histogram of Oriented Gradients and Color Features to Cooperate with Louvain Method based Image Segmentation
289
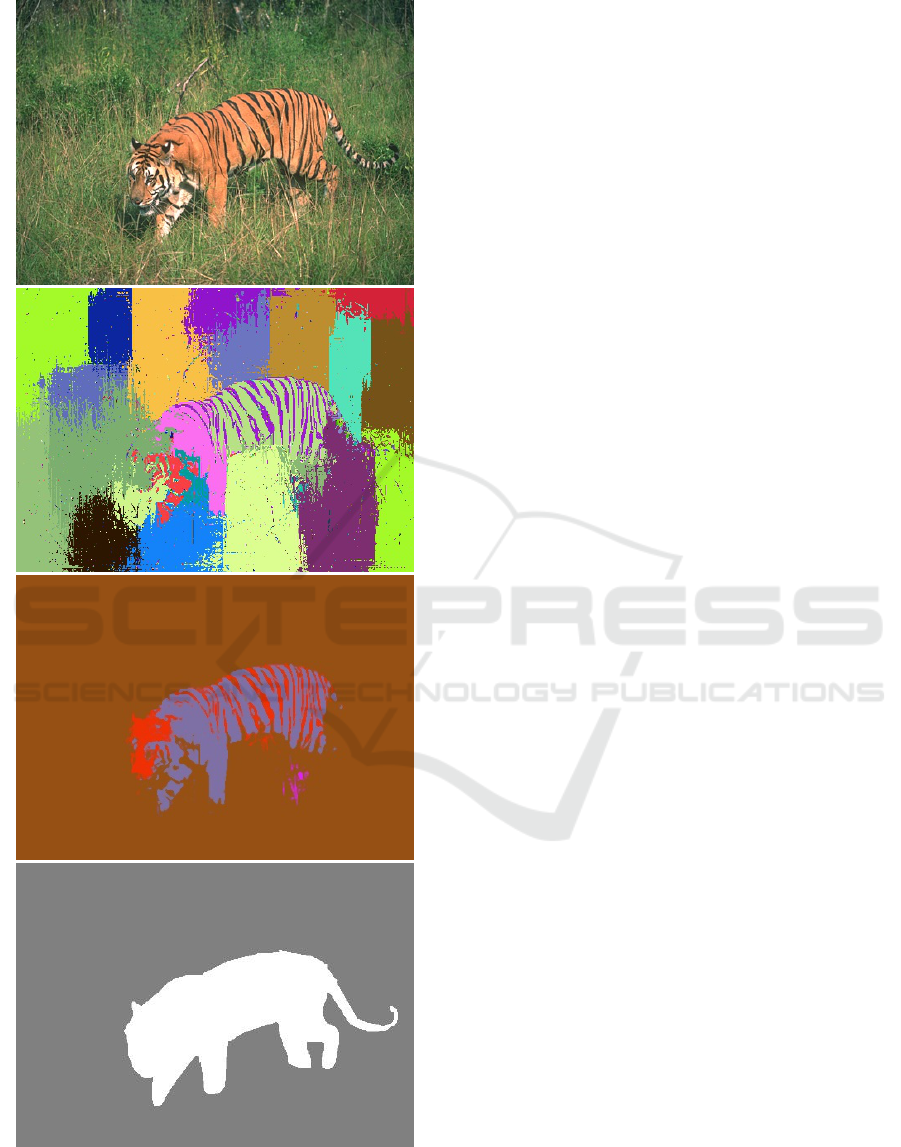
Figure 10: Top: Original images. Second line: Segmen-
tation results obtained by the Louvain method. Third line:
Segmentation results with the proposed algorithm. Fourth
line: Ground-truth.
REFERENCES
Abin, A. A., Mahdisoltani, F., and Beigy, H. (2011). A
new image segmentation algorithm: A community de-
tection approach. In IICAI.
Arbelaez, P., Maire, M., Fowlkes, C., and Malik, J. (2009).
From contours to regions: An empirical evaluation. In
2009 IEEE Conference on Computer Vision and Pat-
tern Recognition, pages 2294–2301.
Arbelaez, P., Maire, M., Fowlkes, C., and Malik, J. (2011).
Contour detection and hierarchical image segmen-
tation. IEEE Trans. Pattern Anal. Mach. Intell.,
33(5):898–916.
Blondel, V. D., Guillaume, J.-L., Lambiotte, R., and Le-
febvre, E. (2008). Fast unfolding of communities
in large networks. Journal of Statistical Mechanics:
Theory and Experiment, 10:10008.
Browet, A., Absil, P. A., and Van Dooren, P. (2011). Com-
munity detection for hierarchical image segmentation.
In Aggarwal, J. K., Barneva, R. P., Brimkov, V. E.,
Koroutchev, K. N., and Korutcheva, E. R., editors,
Combinatorial Image Analysis, pages 358–371, Ber-
lin, Heidelberg. Springer Berlin Heidelberg.
Chen, Y. L., Lin, C. T., Fan, C. J., Hsieh, C. M., and Wu,
B. F. (2008). Vision-based nighttime vehicle detection
and range estimation for driver assistance. In 2008
IEEE International Conference on Systems, Man and
Cybernetics, pages 2988–2993.
Comaniciu, D. and Meer, P. (2002). Mean shift: A robust
approach toward feature space analysis. IEEE Trans.
Pattern Anal. Mach. Intell., 24(5):603–619.
Cour, T., Benezit, F., and Shi, J. (2005). Spectral segmen-
tation with multiscale graph decomposition. In 2005
IEEE Computer Society Conference on Computer Vi-
sion and Pattern Recognition (CVPR’05), volume 2,
pages 1124–1131 vol. 2.
Dalal, N. and Triggs, B. (2005). Histograms of oriented
gradients for human detection. In 2005 IEEE Compu-
ter Society Conference on Computer Vision and Pat-
tern Recognition (CVPR’05), volume 1, pages 886–
893 vol. 1.
Felzenszwalb, P. F. and Huttenlocher, D. P. (2004). Effi-
cient graph-based image segmentation. International
Journal of Computer Vision, 59(2):167–181.
Fortunato, S. (2010). Community detection in graphs. Phy-
sics Reports, 486(35):75 – 174.
Girvan, M. and Newman, M. E. J. (2002). Com-
munity structure in social and biological networks.
Proceedings of the National Academy of Sciences,
99(12):7821–7826.
Junwei, L. and Shaokai, L. (2013). A novel image seg-
mentation technology in intelligent traffic light con-
trol systems. In 2013 3rd International Conference
on Consumer Electronics, Communications and Net-
works, pages 26–29.
Li, S. and Wu, D. O. (2015). Modularity-based image seg-
mentation. IEEE Transactions on Circuits and Sys-
tems for Video Technology, 25(4):570–581.
Li, W. (2013). Modularity segmentation. In Lee, M., Hi-
rose, A., Hou, Z.-G., and Kil, R. M., editors, Neural
VISAPP 2019 - 14th International Conference on Computer Vision Theory and Applications
290

Information Processing, pages 100–107, Berlin, Hei-
delberg. Springer Berlin Heidelberg.
Linares, O. A. C., Botelho, G. M., Rodrigues, F. A., and
Neto, J. B. (2016). Segmentation of large images
based on super-pixels and community detection in
graphs. CoRR, abs/1612.03705.
Liu, D. and Chen, T. (2008). Discov: A framework for
discovering objects in video. IEEE Transactions on
Multimedia, 10(2):200–208.
Martin, D., Fowlkes, C., Tal, D., and Malik, J. (2001).
A database of human segmented natural images and
its application to evaluating segmentation algorithms
and measuring ecological statistics. In Proc. 8th Int’l
Conf. Computer Vision, volume 2, pages 416–423.
Meila, M. (2005). Comparing clusterings: an axiomatic
view. In In ICML 05: Proceedings of the 22nd inter-
national conference on Machine learning, pages 577–
584. ACM Press.
Mourchid, Y., El Hassouni, M., and Cherifi, H. (2017). An
image segmentation algorithm based on community
detection. In Cherifi, H., Gaito, S., Quattrociocchi,
W., and Sala, A., editors, Complex Networks & Their
Applications V, pages 821–830, Cham. Springer Inter-
national Publishing.
Newman, M. E. and Girvan, M. (2004). Finding and evalu-
ating community structure in networks. Physical Re-
view E, 69(2):026113.
Newman, M. E. J. (2004). Detecting community struc-
ture in networks. The European Physical Journal B,
38(2):321–330.
Nguyen, T., Coustaty, M., and Guillaume, J. (2018a). A
new image segmentation approach based on the lou-
vain algorithm. In 2018 International Conference on
Content-Based Multimedia Indexing (CBMI), pages
1–6.
Nguyen, T.-K., Coustaty, M., and Guillaume, J.-L. (2018b).
An efficient agglomerative algorithm cooperating
with louvain method for implementing image segmen-
tation. In Blanc-Talon, J., Helbert, D., Philips, W., Po-
pescu, D., and Scheunders, P., editors, Advanced Con-
cepts for Intelligent Vision Systems, pages 150–162,
Cham. Springer International Publishing.
Pantofaru, C. and Hebert, M. (2005). A comparison
of image segmentation algorithms. Technical Re-
port CMU-RI-TR-05-40, Carnegie Mellon University,
Pittsburgh, PA.
Shi, J. and Malik, J. (2000). Normalized cuts and image
segmentation. IEEE Transactions on Pattern Analysis
and Machine Intelligence, 22(8):888–905.
Shotton, J., Winn, J., Rother, C., and Criminisi, A. (2006).
Textonboost: Joint appearance, shape and context mo-
deling for multi-class object recognition and segmen-
tation. In Leonardis, A., Bischof, H., and Pinz, A.,
editors, Computer Vision – ECCV 2006, pages 1–15,
Berlin, Heidelberg. Springer Berlin Heidelberg.
Youssef Mourchid, Mohammed El Hassouni and Hocine
Cherifi (2015). A new image segmentation approach
using community detection algorithms. In 15th In-
ternational Conference on Intelligent Systems Design
and Applications, Marrakesh, Marocco.
Youssef Mourchild, Mohammed El Hassouni and Hocine
Cherifi (2016). Image segmentation based on com-
munity detection approach. International Journal of
Computer Information Systems and Industrial Mana-
gement Applications, 8:195–204.
Zhou, J. Y., Ong, E. P., and Ko, C. C. (2000). Video ob-
ject segmentation and tracking for content-based vi-
deo coding. In 2000 IEEE International Conference
on Multimedia and Expo. ICME2000. Proceedings.
Latest Advances in the Fast Changing World of Mul-
timedia (Cat. No.00TH8532), volume 3, pages 1555–
1558 vol.3.
A Combination of Histogram of Oriented Gradients and Color Features to Cooperate with Louvain Method based Image Segmentation
291
