
Model-based Region of Interest Segmentation for Remote
Photoplethysmography
Peixi Li
1
, Yannick Benezeth
1
, Keisuke Nakamura
2
, Randy Gomez
2
and Fan Yang
1
1
Le2i EA7508, Arts et M
´
etiers, Univ. Bourgogne Franche-Comt
´
e, Dijon, France
2
Honda Research Institute Japan Co., Ltd., 8-1 Honcho, Wako-shi, Saitama, Japan
Keywords:
Remote Photoplethysmography (rPPG), Heart Rate (HR), Region of Interest Segmentation.
Abstract:
Remote photoplethysmography (rPPG) is a non-contact technique for measuring vital physiological signs,
such as heart rate (HR) and respiratory rate (RR). HR is a medical index which is widely used in health
monitoring and emotion detection applications. Therefore, HR measurement with rPPG methods offers a
convenient and non-invasive method for these applications. The selection of Region Of Interest (ROI) is a
critical first step of many rPPG techniques to obtain reliable pulse signals. The ROI should contain as many
skin pixels as possible with a minimum of non-skin pixels. Moreover, it has been shown that rPPG signal
is not distributed homogeneously on skin. Some skin regions contain more rPPG signal than others, mainly
for physiological reasons. In this paper, we propose to explicitly favor areas where the information is more
predominant using a spatially weighted average of skin pixels based on a trained model. The proposed method
has been compared to several state of the art ROI segmentation methods using a public database, namely the
UBFC-RPPG dataset (Bobbia et al., 2017). We have shown that this modification in how the spatial averaging
of the ROI pixels is calculated can significantly increase the final performance of heart rate estimate.
1 INTRODUCTION
The photoplethysmography (PPG) is an optical
technique to non invasively detect the blood volume
pulse (BVP). PPG sensors have two basic compo-
nents, a LED light source and a photodetector. The
light source illuminates the human tissue and the
photodetector detects the light variation. Since the
amount of light variation is proportional to blood in-
tensity variation, the BVP can be obtained and the HR
is calculated based on BVP.
The PPG is a low-cost and non-invasive techni-
que, however it cannot work when motion and long-
term monitoring are required. Therefore, remote PPG
(rPPG) has been recently developed to address these
drawbacks. The principle of rPPG is very similar with
contact PPG. However, instead of using a LED light
source and a specified photodetector, the rPPG can
simply makes use of a web camera and ambient light.
By detecting the variation of the light reflected by the
face, the BVP and HR can be measured.
According to many previous studies (Sun and
Thakor, 2016; Mcduff et al., 2015), the rPPG methods
for HR measurement share a common pipeline-based
framework: ROI selection for each frame, RGB sig-
nals selection and combination to get the pulse signal,
and finally HR extraction from the filtered pulse sig-
nal. The ROI selection is the first step of the whole
framework. The state of the art methods for ROI se-
lection includes manual selection (Verkruysse et al.,
2008), skin pixel classification (Wang et al., 2015)
and conventional face detection and tracking (Poh
et al., 2011).
Lots of research work has indicated that the ROI
detection has significant effect on the HR measure-
ment (Bousefsaf et al., 2013). This is because the nu-
merical error of the signals will increase if the number
of the effective pixels, i.e. skin pixels, is too small.
Conversely, the number of non-skin pixels also has a
significant negative influence on signal quality. More-
over, it has been shown that rPPG signal is not distri-
buted homogeneously on the face. Some skin regions
contain more rPPG signal than others. For example,
it has been shown that the cheeks and forehead con-
tain much more information than other areas of the
face (Tur et al., 1983). From this premise, some stu-
dies have suggested to simply select the cheeks and/or
forehead as ROI (Scalise et al., 2012; Lewandowska
et al., 2011). This selection has the undeniable ad-
vantage of simplicity but it is also possible to weight
Li, P., Benezeth, Y., Nakamura, K., Gomez, R. and Yang, F.
Model-based Region of Interest Segmentation for Remote Photoplethysmography.
DOI: 10.5220/0007389803830388
In Proceedings of the 14th International Joint Conference on Computer Vision, Imaging and Computer Graphics Theory and Applications (VISIGRAPP 2019), pages 383-388
ISBN: 978-989-758-354-4
Copyright
c
2019 by SCITEPRESS – Science and Technology Publications, Lda. All rights reserved
383

the skin pixels by their relative importance. In doing
so, we explicitly favor areas of the face where there is
more information.
In this paper, we propose a model-based ROI seg-
mentation that explicitly favors the most important fa-
cial regions. The model describing the spatial distri-
bution of rPPG information on the face was trained
with ten videos. This model is then used to weight
the pixels during spatial averaging. This approach
has been validated using our in-house publicly availa-
ble video dataset (Bobbia et al., 2017), called UBFC-
RPPG specifically geared towards research on rPPG
techniques. We have shown that this modification in
how the spatial averaging of the ROI pixels is calcu-
lated can significantly increase the final performance
of heart rate estimate compared with other state of the
art methods such as face detection, skin classification
and landmarks detection.
In section 2, the state of the art methods are briefly
introduced. The proposed ROI segmentation method
is explained in details in section 3. The experiment is
described in section 4. The conclusion is presented in
section 5.
2 STATE OF THE ART OF ROI
SEGMENTATION METHODS
Most ROI segmentation techniques are based on the
result of classical face detection and tracking algo-
rithms. The ROI is then possibly refined with skin
pixel classification or more precise ROI definition ba-
sed on a set of landmarks. In this section we present
several state of the art ROI segmentation techniques.
Since all of the video dataset are the recordings
of heads and faces, the most straightforward method
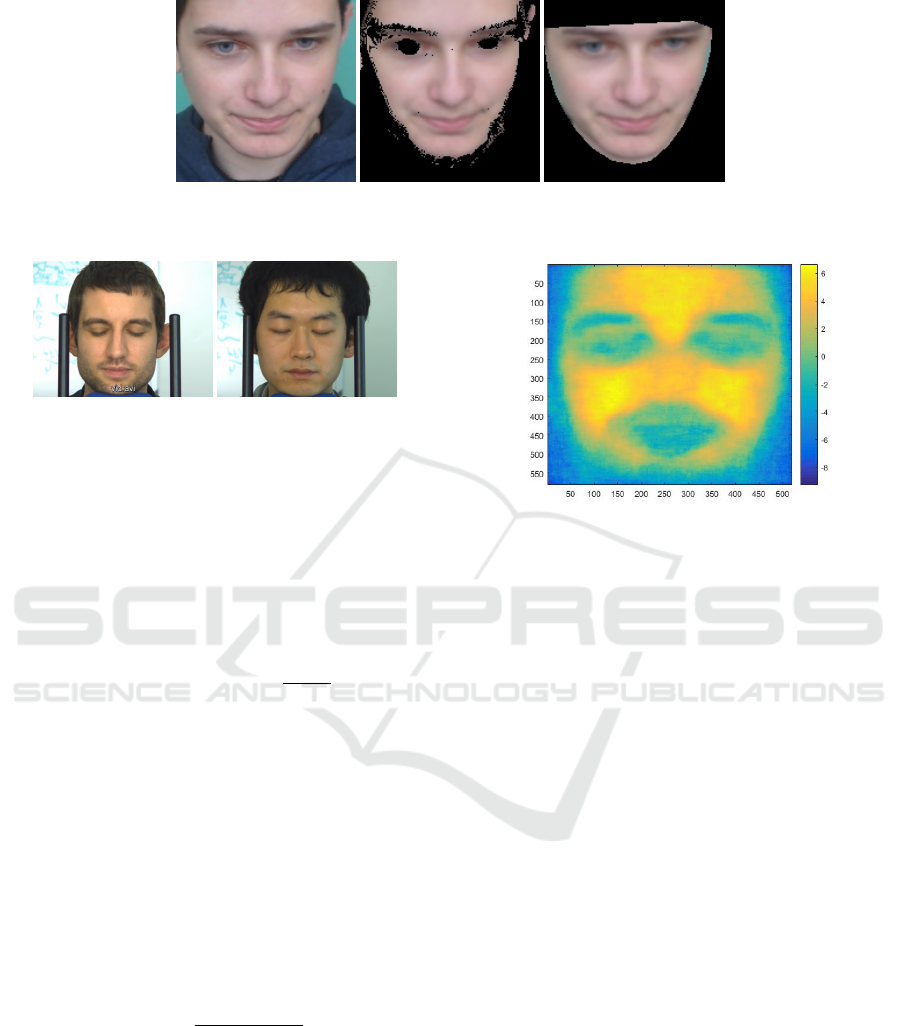
to detect the ROI is to use face detector and tracker
(later called face). For this algorithm, the classical
Viola-Jones face detector (Viola and Jones, 2001) and
Kanade-Lucas-Tomasi tracking (Lucas et al., ) algo-
rithm (cf. Fig 1(a)) can be used for implementation.
Since the rPPG information is only present on skin
pixels, skin/non-skin classification (later called skin)
is a popular improvement over the classical face de-
tection and tracking. For instance, some researchers
(Macwan et al., 2017) used this algorithm (Conaire
et al., 2007) in their rPPG research work. The skin
detection algorithm is achieved by thresholding of a
non-parametric histogram which is trained by manu-
ally classified skin/non-skin pixels. The significant
advantage of this algorithm is that it works very fast
since it is based on a Look-Up-Table (LUT). Fig. 1(b)
is an example of this method.
The ROI detection can also be segmented by de-
fining a facial contour with a set of landmarks (la-
ter called landmarks). For this algorithm the method
proposed by Kazemi can be used for implementation
(Kazemi and Sullivan, 2014). One example is shown
in Fig. 1(c).
The rPPG signal is not distributed homogeneously
on skin. Some skin regions contain more rPPG signal
than others. For example, it has been shown that SNR
of rPPG signals extracted from forehead or cheekbo-
nes are significantly higher than other face regions.
This assertion has already been used by different ROI
segmentation techniques. For example, in some work
only the cheeks and forehead were selected (Lewan-
dowska et al., 2011). In a previous study, ROI seg-
mentation, based on temporal superpixels, implicitly
favors regions of interest where the pulse trace is more
prominent (Bobbia et al., 2017). However, this data-
driven method is very sensitive to motion and errors
in superpixel tracking induce incorrect segmentation.
3 MODEL BASED ROI
SEGMENTATION
In this paper, we propose an effective technique for
explicitly favoring certain areas of the face during the
spatial averaging step of RGB pixels. The model that
encapsulates the spatial distribution of rPPG informa-
tion was trained using an in-house database of 10 vi-
deos recorded under very favorable conditions. For
this experiment, we used a EO-23121C camera re-
cording 1024 × 768 uncompressed images at 30 fps.
The average length of each video is about one minute.
Subjects sat on an chair with back support. To make
sure that the face is fixed in a specified position, we
used a shelf and asked the volunteers to put the heads
onto the shelf. Fig. 2 shows two sample images from
the dataset.
Then, the face sequence is aligned based on the lo-
cation of the eyes. The video frames were filtered by a
25×25 averaging filter to decrease quantization noise.
The rPPG signal is extracted using the chrominance-
based method (De Haan and Jeanne, 2013). This met-
hod is very fast and the computational complexity
is very low. It linearly combined the RGB channels
by projecting them onto two orthogonal chrominance
vectors:
X(t) = 3y
R
(t) − 2y
G
(t),
Y (t) = 1.5y
R
(t) + y
G
(t) − 1.5y
B
(t).
(1)
Where y
c
(t) is the RGB signal after filtering, c ∈
{R,G, B} are the color channels, and X and Y are
VISAPP 2019 - 14th International Conference on Computer Vision Theory and Applications
384
(a) (b) (c)
Figure 1: The State of Art ROI segmentation examples: (a) face (b) skin and (c) landmarks.
Figure 2: The subjects for the model.
two orthogonal chrominance vectors. The pulse sig-
nal S is obtained by S(t) = X(t) − αY (t) where α =
σ(X)/σ(Y ). This σ is the standard deviation calcula-
ted over time.
The SNR for each pixel is then estimated as the
ratio of the area under the power spectrum curve in
a region surrounding the maximum peak in the fre-
quency spectrum, divided by the area under the curve
in the rest of the frequency spectrum:
SNR
(
x,y) = 10 × log
10
(
P
signal
P
noise
)
(2)
Fig. 3 presents the spatial distribution of the SNR
values averaged for all the videos of this dataset. As
expected, we can observe that cheeks and forehead
have in average, higher SNR (about 6 dB) than other
face locations (e.g. 0 dB for the chin).
This spatial map is then used during the spatial
averaging of the pixels of the ROI. Instead of using
equal weights for all pixels in the ROI, we use a weig-
hted average where weights are defined based on our
model.
The weights are calculated as:
ω
(x,y)
=
a
SNR
(x,y)
∑
(x,y)
a
SNR
(x,y)
(3)
where a is a constant. With higher a, the weights of
the region of higher SNR are higher.
The optimal selection of a is done empirically. Ex-
periments and details are given in Section 4.
Eventually, RGB triplet is obtained for each frame
with the following weighted average:
S(t) =
∑
x,y
I
t
(x,y) × ω
(x,y)
(4)
Figure 3: Different SNR in different locations.
Where I
t
(x,y) is the RGB value at time t of a pixel at
location (x, y) and ω
(x,y)
is the corresponding weight
of the pixel.
It is interesting to note that this technique can be
advantageously combined with all the rPPG methods
that perform a spatial average of the ROI pixels.
4 EXPERIMENTS
The proposed model-based ROI segmentation (later
called model) is experimentally compared with the
state of the art methods, namely face detection (face),
skin detection (skin) and landmarks detection (land-
marks). This section presents the details of the ex-
periments. First, we describe the video dataset and
experimental setup. Then, we present the system fra-
mework. Evaluation metrics and experimental results
are finally presented.
4.1 Video Dataset
All of the ROI selection methods were assessed by
the performance of remote HR measurement. For
the experiments, we used our in-house video datasets
UBFC-rPPG (Bobbia et al., 2017) which have 46 vi-
deos. The volunteers were asked to sit at the distance
of one meter from the web camera and were asked to
play a time sensitive video game. Ambient light was
Model-based Region of Interest Segmentation for Remote Photoplethysmography
385
used in the experiment to create diffuse reflections.
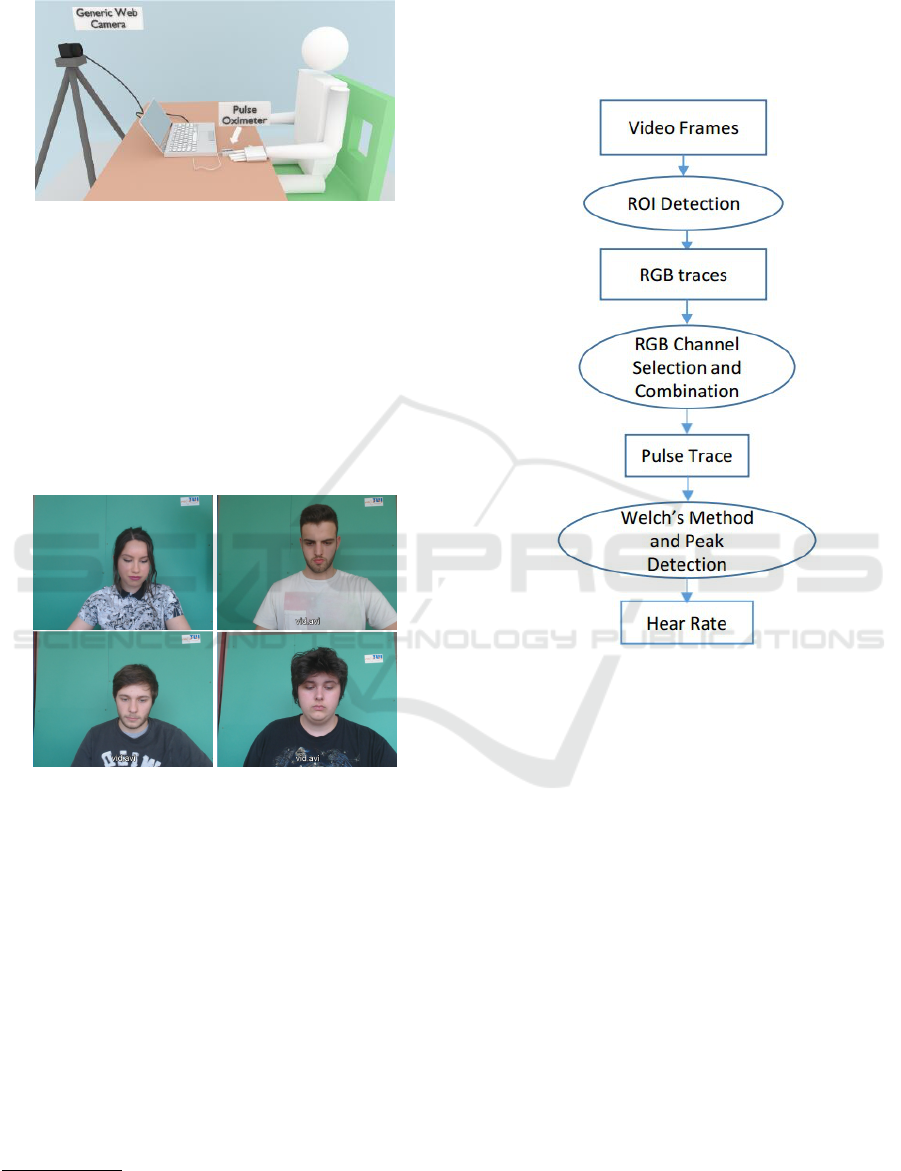
The experimental set up is shown in Fig. 4.
Figure 4: Experimental Setup.
A C++ program was used to record the videos and
synchronize the videos with the signals of the contact
PPG sensor which was used as the ground truth. The
web camera is a Logitech C920. The resolution of the
video frame is 640x480 and the frame rate is 30/se-
cond. The format is 8-bit uncompressed RGB. The
contact PPG sensor is a CMS50E transmissive pulse
oximeter. The experimental dataset with the ground
truth can be downloaded from our project webpage
1
.
Some sample images are shown in Fig. 5.
Figure 5: Experimental sample images from the UBFC-
RPPG database.
4.2 System Framework
As explained previously, most methods share a com-
mon pipeline-based framework where ROI are first
detected and tracked over frames, RGB channels are
then combined to estimate the pulse signal, which is
filtered and analyzed to extract heart rates. In this
study, we used the same procedure to compare our
ROI segmentation method with other segmentation
techniques. First, RGB signals are normalized, de-
trended by smoothness priors approach and filtered by
band-pass Butterworth filter. Then the RGB signal is
selected and combined by chrominance based method
(De Haan and Jeanne, 2013).
1
https://sites.google.com/view/ybenezeth/ubfcrppg
With this pulse signal, we used Welch’s method to
obtain the periodogram with a sliding window of 20
seconds, and step size is one second. Identically, this
process was used on the PPG signal of the contact
sensor, which was utilized as the ground truth. The
system framework is briefly shown in Fig. 6.
Figure 6: System Framework.
4.3 The Evaluation Metrics
Seven metrics were used to assess the performance of
the ROI selection algorithms in the framework of HR
measurements:
• Pearson Correlation Coefficient (R) is used to
evaluate the correlation between the RPPG mea-
surement and contact PPG measurement (ground
truth).
• Mean Absolute Error (MAE) in beats per mi-
nute (bpm) is calculated as the absolute differen-
ces between HR measured from RPPG and HR
measured from contact PPG signals which can be
represented as |HR
rPPG
− HR
PPG
|.
• MAE5 is the MAE which discards all the outliers
with an error larger than 5 bpm.
• Precision5 and Precision2.5 represent the per-
centage of estimations where the absolute errors
is under a threshold (2.5 or 5 bpm).
VISAPP 2019 - 14th International Conference on Computer Vision Theory and Applications
386

Table 1: The evaluation values for different weight calculation methods.
Correlation R Precision 2.5 Precision 5 MAE MAE5 RMSE SNR
a = 10 0.737 0.757 0.874 3.60 1.27 4.84 2.82
a = 5 0.732 0.755 0.873 3.68 1.27 4.93 3.08
a = e 0.728 0.755 0.876 3.68 1.29 4.92 3.31
a = 2 0.695 0.750 0.872 3.99 1.29 5.55 3.35
a =1.5 0.676 0.740 0.862 4.54 1.27 6.23 3.14
a = 1 0.674 0.737 0.861 4.56 1.28 6.25 3.09
Table 2: The average evaluation values for ROI detection.
Correlation R Precision 2.5 Precision 5 MAE MAE5 RMSE SNR
face 0.531 0.612 0.766 8.72 1.50 12.4 0.570
skin 0.683 0.716 0.851 5.10 1.36 6.78 3.21
landmarks 0.649 0.714 0.842 5.24 1.32 7.08 2.83
model 0.695 0.750 0.872 3.99 1.29 5.55 3.35
• Root mean square error (RMSE) is the square
root of the average of squared differences between
HR measured from RPPG and ground truth.
• Signal-to-Noise Ratio (SNR) is calculated as the
ratio of the power of the main pulsatile component
and the power of background noise, computed in
dB due to the wide dynamic range.
4.4 Results
First, we present an experiment to empirically select
the optimal scalar a of equation (3). To do this, several
values for a were tested in the system framework. The
result is shown in table 1. It can be observed that the
ranking is different according to the different metrics.
a = 2 provides a higher SNR while a larger value of a
provides a better HR estimation (given by Correlation
R, MAE and RMSE). For the rest of the experiments,
we chose to favor the quality of the signal (given by
the SNR) and will use a = 2.
Second, the proposed model-based ROI segmen-
tation method is compare with other state of the art
methods. The average results are shown in table 2. It
is obvious that the ROI segmentation algorithms have
significant effects on the results. All the metrics are
very different with different ROI selection methods.
It is also very clear that the proposed algorithm per-
forms much better than all the other algorithms. It has
the lowest MAE5 and RMSE. It has the highest corre-
lation R, which means the RPPG method matches the
ground truth better than other methods. SNR metric
is also the highest which indicates that the method of-
fers the best quality of the signal. The skin method is
actually very good, although it is slightly worse than
the proposed algorithm.
5 CONCLUSION
A good ROI is very important for rPPG algorithms to
work properly. The ROI must contain as much criti-
cally useful information as possible. Most of the state
of the art methods focus on the improvement of the
face and skin detection, and their objectives are mos-
tly to get as many skin pixels as possible and to dis-
card as many non-skin pixels as possible. However,
the rPPG signals are not distributed homogeneously
on the human face, so it is reasonable to consider put-
ting weights on the pixels before other processing. In
this paper, we presented a supervised model based on
SNR weights to improve the ROI segmentation. This
algorithm is compared with other algorithms by eva-
luating the performance of HR measurement. The ex-
periments were done with a low-cost web camera and
a contact PPG sensor as the ground truth. 56 videos
were used in the experiments and 10 of them were
used to create the SNR weight map and the other 46
were tested with this map. The results showed that the
ROI segmentation affects the HR measurement signi-
ficantly and our new algorithm performed better than
all the other state of the art methods.
Since the algorithm is based on a supervised mo-
del, it is important to generate a reliable SNR weight
map. The model may be different in different envi-
ronmental conditions. It may fail if the registration
of the model is imprecise due to the low accuracy of
the landmarks detection. The ROI may have different
ways to be resized or reshaped to fit the model. For
instance, an elliptical model can be generated with the
contour provided by the landmarks detection. These
offer good opportunities to improve this algorithm.
Model-based Region of Interest Segmentation for Remote Photoplethysmography
387

REFERENCES
Bobbia, S., Macwan, R., Benezeth, Y., Mansouri, A., and
Dubois, J. (2017). Unsupervised skin tissue segmen-
tation for remote photoplethysmography. Pattern Re-
cognition Letters.
Bousefsaf, F., Maaoui, C., and Pruski, A. (2013). Conti-
nuous wavelet filtering on webcam photoplethysmo-
graphic signals to remotely assess the instantaneous
heart rate. Biomedical Signal Processing and Control,
8(6):568–574.
Conaire, C. O., O’Connor, N. E., and Smeaton, A. F. (2007).
Detector adaptation by maximising agreement bet-
ween independent data sources. In IEEE Conference
on Computer Vision and Pattern Recognition, pages
1–6.
De Haan, G. and Jeanne, V. (2013). Robust pulse rate from
chrominance-based rppg. IEEE Trans. on Biomedical
Engineering, 60(10):2878–2886.
Kazemi, V. and Sullivan, J. (2014). One millisecond face
alignment with an ensemble of regression trees. In
IEEE Conference on Computer Vision and Pattern Re-
cognition, pages 1867–1874.
Lewandowska, M., Rumi
´
nski, J., Kocejko, T., and No-
wak, J. (2011). Measuring pulse rate with a webcam
a non-contact method for evaluating cardiac activity.
In Computer Science and Information Systems (Fe-
dCSIS), 2011 Federated Conference on, pages 405–
410. IEEE.
Lucas, B. D., Kanade, T., et al. An iterative image regis-
tration technique with an application to stereo vision.
Proceedings DARPA Images Understanding Works-
hop, pages 121–130 (1981).
Macwan, R., Benezeth, Y., Mansouri, A., Nakamura, K.,
and Gomez, R. (2017). Remote photoplethysmo-
graphy measurement using constrained ica. IEEE int.
conf. on E-Health and Bioengineering.
Mcduff, D. J., Estepp, J. R., Piasecki, A. M., and Black-
ford, E. B. (2015). A survey of remote optical photop-
lethysmographic imaging methods. int. conf. of the
IEEE Engineering in Medicine and Biology Society.
Poh, M. Z., McDuff, D. J., and Picard, R. W. (2011). Ad-
vancements in noncontact, multiparameter physiolo-
gical measurements using a webcam. IEEE Trans. on
Biomedical Engineering.
Scalise, L., Bernacchia, N., Ercoli, I., and Marchionni, P.
(2012). Heart rate measurement in neonatal patients
using a webcamera. In Medical Measurements and
Applications Proceedings (MeMeA), 2012 IEEE Inter-
national Symposium on, pages 1–4. IEEE.
Sun, Y. and Thakor, N. (2016). Photoplethysmography
revisited: from contact to noncontact, from point to
imaging. IEEE Trans. on Biomedical Engineering,
63(3):463–477.
Tur, E., Tur, M., Maibach, H. I., and Guy, R. H. (1983). Ba-
sal perfusion of the cutaneous microcirculation: mea-
surements as a function of anatomic position. Journal
of investigative dermatology, 81(5).
Verkruysse, W., Svaasand, L. O., and Nelson, J. S. (2008).
Remote plethysmographic imaging using ambient
light. Optics express, 16(26):21434–21445.
Viola, P. and Jones, M. (2001). Rapid object detection using
a boosted cascade of simple features. In IEEE Confe-
rence on Computer Vision and Pattern Recognition,
volume 1, pages I–I.
Wang, W., Stuijk, S., and De Haan, G. (2015). A novel
algorithm for remote photoplethysmography: Spatial
subspace rotation. IEEE Trans. on Biomedical Engi-
neering.
VISAPP 2019 - 14th International Conference on Computer Vision Theory and Applications
388
