
Quantification of Stromule Frequencies in Microscope Images
of Plastids Combining Ridge Detection and Geometric Criteria
Birgit M
¨
oller
1
and Martin Schattat
2
1
Pattern Recognition and Bioinformatics, Institute of Computer Science, Faculty of Natural Sciences III,
Martin Luther University Halle-Wittenberg, Von-Seckendorff-Platz 1, 06120 Halle (Saale), Germany
2
Plant Organelle Shape and Dynamics Lab, Institute of Plant Physiology, Faculty of Natural Sciences I,
Martin Luther University Halle-Wittenberg, Weinbergweg 10, 06120 Halle (Saale), Germany
Keywords:
Plant Cells, Plastids, Stromules, Quantification, Segmentation, Ridge Detection, Geometric Criteria, ImageJ.
Abstract:
Plastids are involved in many fundamental biochemical pathways in plants. They can produce tubular mem-
brane out-folds from their surface. These so-called stromules have initially been described over a century ago,
but their functional role is still elusive. To identify cellular processes or genetic elements underlying stromule
formation screens of large populations of mutant plants or plants under different treatments are carried out and
stromule frequencies are extracted. Due to a lack of automatic methods, however, this quantification is usually
done manually rendering this step a main bottleneck in stromule research. Here, we present a new approach
for quantification of stromule frequencies. Plastids are extracted from microscope images using local wavelet
analysis over multiple scales combined with statistical hypothesis testing to resolve competing detections from
different scales. Subsequently, for each plastid region evidence for the existence of stromules in its vicinity is
investigated applying ridge detection techniques and geometric criteria. Experimental results prove that our
approach is suitable to properly identify stromules. Even in microscopy images with a high noise level and
distracting signals extracted stromule counts are comparable to those of biological experts.
1 INTRODUCTION
Fluorescent proteins have developed into an impor-
tant cell biological tool. They have delivered evidence
that membrane bound compartments in eukaryotic
cells not only possess specific biochemical proper-
ties, but also specific shapes and numbers, and often
exhibit striking dynamics. Life cell imaging revealed
that these characteristics can drastically change in re-
sponse to stress. Despite these clear and often strong
responses it is still largely unknown how such chan-
ges support compartment function and how they are
integrated into the cellular regulatory network.
Specifically interesting membrane bound com-
partments in this regard are plastids. Plastids are uni-
que to plants and are involved in many fundamental
biochemical pathways such as photosynthetic carbon
fixation, which provides us with oxygen as well as
food. Shapes of plastids vary between different plant
tissues as well as plant species, but range usually from
ellipsoid to almost perfectly spherical (Fig. 1A, B). In
response to stimuli such as stress plastids can form
surface membrane out-folds (Fig. 1C), so-called stro-
mules (K
¨
ohler and Hanson, 2000). Although stromu-
les are known to the scientific community for over a
century and have been intensively studied by the use
of fluorescent proteins for 20 years now, we still can
only speculate about stromule function and regulation
(Hanson and Hines, 2018).
An often used strategy to identify cellular proces-
ses or genetic elements important for stromules are
screens in which larger populations (> 1000) of mu-
tant plants are tested for altered stromule frequencies.
The stromule frequency (or SF%) is defined as the
percentage of plastids carrying at least one stromule
(see also (Schattat and Kl
¨
osgen, 2011)). In addition
to genetic screens, screenings of different chemical
inhibitors, hormones and peptides as well as of bio-
tic or abiotic stresses for their ability to induce chan-
ges to the basic SF% are a common tool to study
stromule regulation (see (Schattat and Kl
¨
osgen, 2011;
Gray et al., 2012) for examples). In order to reliably
assess SF% of a single plant sample, such as a leaf,
three to six randomly chosen spots of the sample are
imaged, capturing up to 1500 plastids (precise num-
ber varies between plant species and tissues) of which
the number of plastids with and without stromule has
to be counted (e.g., (Schattat and Kl
¨
osgen, 2011)).
38
Möller, B. and Schattat, M.
Quantification of Stromule Frequencies in Microscope Images of Plastids Combining Ridge Detection and Geometric Criteria.
DOI: 10.5220/0007390300380048
In Proceedings of the 12th International Joint Conference on Biomedical Engineering Systems and Technologies (BIOSTEC 2019), pages 38-48
ISBN: 978-989-758-353-7
Copyright
c
2019 by SCITEPRESS – Science and Technology Publications, Lda. All rights reserved
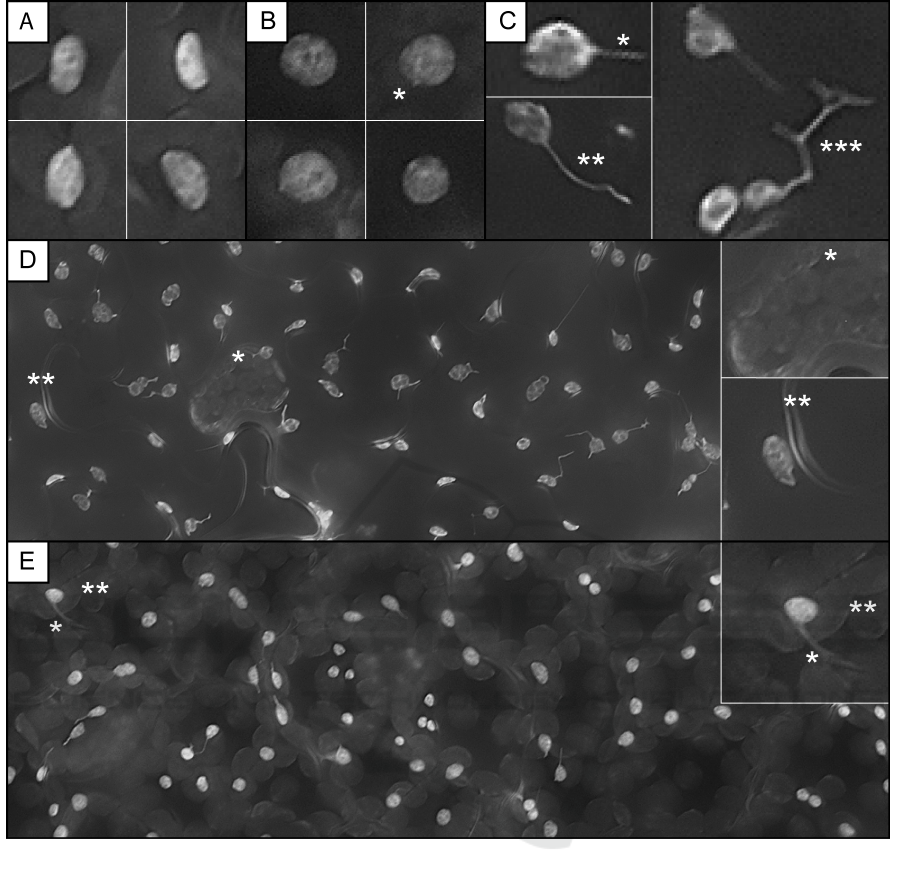
Figure 1: Sample image data: A, B) typical individual plastids lacking any stromules, A) four plastids exhibiting ellipsoid
shapes (origin: upper leaf epidermis of Arabidopsis thaliana), B) four plastids being almost perfectly spherical (origin: lower
leaf epidermis of Nicotiana benthamiana), B*) plastid exhibiting a very short spike-like stromule. C) Plastids exhibiting a
straight (C*), curvilinear (C**) or branched (C***) stromule of intermediate length. D, E) representative sample images of
flattened z-stacks of D) lower leaf epidermis (N. benthamiana) and E) upper leaf epidermis (A. thaliana). Insets (D*, D**, E*
and E**) show details of inhomogeneous image background, spurious fluorescence signals, and reflections.
To record the shape of plastids, fluorescence pro-
teins are targeted to the plastid stroma (K
¨
ohler et al.,
1997; Marques et al., 2004) and imaged by fluores-
cence microscopy. Although automated microscope
setups can easily generate large and representative
image data sets, there is currently no computer-based
tool available, which could assist with stromule quan-
tification. Thus, the extraction of stromule frequen-
cies still mainly relies on visual judgment (Schattat
and Kl
¨
osgen, 2011; Erickson et al., 2017; Kumar
et al., 2018) and makes the assessment the current
bottleneck in many stromule related projects. The-
refore a tool for automated stromule frequency quan-
tification would greatly support the advancement of
stromule related research.
The automatic extraction of stromules from flu-
orescent microscopy images faces great challenges
with regard to morphological properties and the over-
all appearance of stromules, their dynamic nature as
well as concerning 3D image quality. Stromules exhi-
bit a notable morphological diversity. In microscopy
images stromules of medium and large size mostly
Quantification of Stromule Frequencies in Microscope Images of Plastids Combining Ridge Detection and Geometric Criteria
39

appear as long thin structures (Fig. 1C), while short
stromules often subsume only a few pixels in length
and appear as small spikes (Fig. 1B
∗
). In addition,
long stromules can be bent, kinked or even branched
(Fig. 1C). Specifically under conditions inducing stro-
mule formation, stromules can be highly dynamic and
can change their shape as well as position in a matter
of seconds. This can cause problems during z-stack
recording, when stromules have time to move bet-
ween consecutive frames, leading to imaging artefacts
such as duplication of the respective stromule. Howe-
ver, recording of z-stacks spanning the entire cell is
crucial for estimating SF% due to the central vacuole
in plant cells and the rather dispersed nature of plas-
tids and stromules. At the same time it is essential to
image a larger number of cells in a sufficient quality
and resolution, allowing not only to cover many plas-
tids, but simultaneously allowing the detection of thin
stromules reliably. Hence, the analysis of plastids and
stromules demands for relatively fast 3D imaging data
of high resolution.
Standard automated wide field fluorescence
systems meet these necessities and are in some
regards superior to confocal laser scanning setups,
particularly concerning speed at higher image resolu-
tions. However, wide field fluorescence images may
contain distracting intensity signals from out of focus
planes. This prevents the application of standard
3D image analysis strategies to such z-stacks and
necessitates the projection into 2D images. For
creating those projections no standard maximum
projection method seems feasible, instead extending
depth of field software such as CombineZP
1
(as
described in (Schattat and Kl
¨
osgen, 2009)) has to
be used to create flattened 2D images (Fig. 1D, E).
Despite harbouring the biological features of interest
these extended wide field fluorescence images often
suffer from imaging and projection artefacts such
as inhomogeneous background and reflections on
cell walls (Fig. 1D
∗
, D
∗∗
). Moreover, the artefacts
often share significant similarities with stromules
(Fig. 1D
∗
, D
∗∗
, E
∗
, E
∗∗
) and although they render
the task of developing robust and automated image
analysis tools challenging, the benefit of faster
imaging speed at higher resolution makes wide field
fluorescence images still the preferred choice for
high-throughput work.
In this paper, we present a new image analysis
workflow for quantifying stromule frequencies from
wide field microscopy images facing these challen-
ges. Plastids are robustly detected adopting the ap-
1
The CombineZP website is dead since August 2017,
see https://en.wikipedia.org/wiki/CombineZ for details.
proach of (Greß et al., 2010) based on local wavelet
analysis in a multi-scale framework. For localizing
stromules in the vicinity of segmented plastids we ap-
ply ridge detection techniques to extract curvilinear
segments as candidates for stromules. Subsequently,
biological characteristics of stromules are exploited
to define a set of geometric criteria suitable to distin-
guish between curvilinear segments referring to true
stromules and segments originating from distracting
image structures or reflections. Experimental results
on images of different types of plastids prove that our
new workflow is well-suited to ease the assessment
of stromule frequencies even from challenging image
data and marks an important progress towards fully
automatic high-throughput analysis in this field.
The approach has been implemented in Java
as part of MiToBo, a toolbox for processing and
analyzing microscopy images (M
¨
oller et al., 2016),
and the software is publically available. MiToBo
seemlessly integrates into the widely used image
analysis software ImageJ/Fiji (Schindelin et al., 2012;
Rueden et al., 2017) and features its own ImageJ
update site which grants direct access to all functio-
nality and in particular to the new stromule analysis
pipeline. MiToBo is open-source and released under
GPL version 3.0, the source code of MiToBo and
the new analysis pipeline, respectively, are available
from MiToBo’s website
2
and from Github.
The remainder of the paper is organized as fol-
lows. In Section 2 we review common techniques for
the segmentation of cells and nuclei with similar cha-
racteristics like the plastids in our application, and for
the extraction of curvilinear structures showing paral-
lels to stromules. Our approach is outlined in Section
3 focusing on the new stromule detection method, be-
fore results and a conclusion are given in Section 4
and Section 5, respectively.
2 RELATED WORK
The task of segmenting plastid regions from 2D mi-
croscopy images is very specific, hence, establis-
hed techniques for tackling this problem do not ex-
ist. Yet, the visual appearance of plastids in fluores-
cence microscopy images and their shape characteris-
tics (Fig. 1) are comparable to those of small cells and
nuclei. Accordingly, the problem of extracting plas-
tid regions from 2D fluorescence microscope images
is deeply linked to the segmentation of such objects
(Chen et al., 2013; Buggenthin et al., 2013; Xing and
Yang, 2016) as well as to the detection of particles and
2
MiToBo website, http://mitobo.informatik.uni-halle.de
BIOIMAGING 2019 - 6th International Conference on Bioimaging
40

larger spot-like structures on the cellular level (Bas-
set et al., 2015). The variety of techniques applied
for these problems is manifold, ranging from global
or local image binarization in combination with mor-
phological post-processing and often also a watershed
transformation for separation of touching objects, to
elaborate segmentation methods like graph cuts (Qi,
2014), levelsets (Bergeest and Rohr, 2012), and re-
cently also techniques of deep learning (Kraus et al.,
2016). The detection of spot-like structures (Smal
et al., 2010) is often tackled with binarization and sub-
sequent morphological post-processing, specific mor-
phological operators like top hat, or h-dome transfor-
mations. Also frequency-based methods like wavelet
analysis are common (Olivo-Marin, 2002).
Stromules are thin protrusions of varying length
emenating from the surface of plastids. In the ima-
ges of our application domain they appear as small
curvilinear segments. The only published attempts to
detect stromules from microscopy images have focu-
sed on detecting and tracking individual stromules in
confocal microscope time series of individual plastids
with the aim to identify stromule to microtubule inte-
raction events (Kumar et al., 2018). Quantifications of
stromule frequency in the same study were performed
manually highlighting the absence of an available tool
to quantify stromule frequency. In general stromules
show a significant structural similarity to objects like
vessels in retinal images (Fraz et al., 2012), streets in
aerial imagery (Salahat et al., 2015), or roots in mini-
rhizotron images (Zeng et al., 2008). For the segmen-
tation of such structures various model-based approa-
ches have been devised. Most of the time these aim at
enhancing vessel-like structures based on model as-
sumptions about their intensity profiles and structu-
ral appearance in images (Frangi et al., 1998; Staal
et al., 2004; Moghimirad et al., 2012). The met-
hods are often combined with subsequent segmenta-
tion techniques like thresholding. Some approaches
(Steger, 1998) directly extract curvilinear structures
by integrating initial localization of structures on the
pixel level and subsequent linking procedures consi-
dering local neighborhoods.
3 METHODS
The aim of this work is to efficiently extract stromule
frequencies SF% from microscopy images. To this
end we seek to count the total number of plastids in an
image from which at least one stromule emanates and
which yields the basis for determining SF%. Hence,
there is no need for accurately segmenting stromules
in their full length. Rather, we focus on finding lo-
cal evidence of stromules in terms of thin curvilinear
structures with coherent geometric properties in the
vicinity of detected plastid regions.
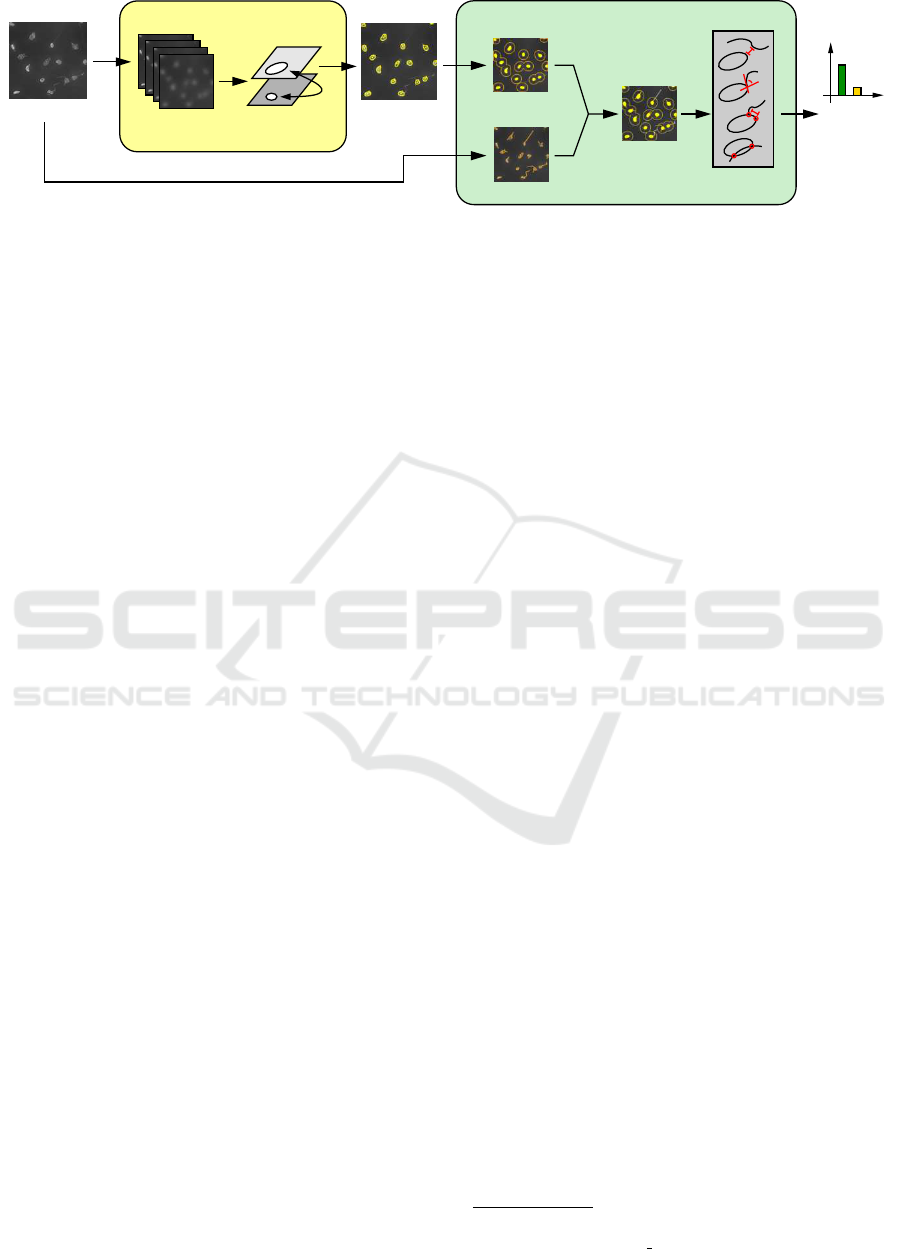
Our workflow (Fig. 2) is separated in two phases
and decouples plastid detection and identification of
stromule parts. In the first phase (yellow box in Fig. 2)
plastid regions are extracted from given input images
adopting the method for robust detection of spot-like
structures using wavelets from (Greß et al., 2010). In
the second phase (green box in Fig. 2) each region is
further examined to determine if there is evidence for
the corresponding plastid to form a stromule or not.
3.1 Plastid Detection
Plastids appear in the flattened 2D images as circu-
lar to elliptical objects which on average show brig-
hter intensities than the local background. For seg-
menting them from a given input image we adopt the
approach of (Greß et al., 2010) aiming to extract spot-
like and salient local regions from fluorescence mi-
croscopy images. The key idea of the method is to
extract candidate regions by calculating and threshol-
ding wavelet coefficients over multiple scales. Com-
peting hypotheses for the same image location from
different scales are resolved by statistical testing. Be-
low we only briefly outline the basics of the method,
for further details refer to (Greß et al., 2010).
Initially, the gray-scale input image is iteratively
smoothed with steadily increasing mask sizes re-
sulting in images of successively decreasing resolu-
tion. Wavelet coefficients are extracted as differences
between pairs of smoothed images of adjacent sca-
les. The coefficient images are thresholded applying
a manually selected threshold, and foreground com-
ponents are extracted from the binary images to iden-
tify locally striking intensity patterns as candidate re-
gions for plastids. Since the thresholding is applied
independently to each coefficient image, for a single
image location competing plastid region hypotheses
from different scales may result.
To select a single region as final segmentation re-
sult from each set of competing candidate regions
statistical testing is used. It evaluates if a region is
more likely related to a real plastid or originating from
image noise. Given the null hypothesis that the local
region originates from noise, this provides us with a
statistical significance, i.e. a p-value, for each candi-
date region. The final detection result for each set
of competing regions is then given by the candidate
region associated with the smallest p-value, i.e. ha-
ving the smallest probability to originate from image
noise. Together with all regions distinctly detected at
an image location this yields the final set of plastid
Quantification of Stromule Frequencies in Microscope Images of Plastids Combining Ridge Detection and Geometric Criteria
41
Input Image
Plastids
Phase I: Plastid Detection Phase II: Stromule Identification
Region Expansion
Ridge Detection
Candidates
Stromule
Geometric
Criteria
Multi−Scale
Wavelets
Binarization &
Statistical Testing
?
Plastid &
Stromule
P
S
Counts,
SF%
Figure 2: Overview of our approach: in the first phase (yellow box) plastid regions are extracted from input images, in the
second phase (green box) curvilinear segments are detected in the vicinity of each plastid region and various geometric criteria
are applied to classify them as referring to a stromule or originating from image artefacts and distracting signals.
regions forming the basis for the second step of stro-
mule identification.
3.2 Stromuli Detection
If a stromule emenates from a plastid a thin and cur-
vilinear structure is supposed to appear in the vicinity
of the plastid region. We use a ridge detection method
to localize candidates for such structures (Sec. 3.2.2).
Due to the noise level in the flattened 2D images,
inhomogeneous image background, spurious signals,
and reflections, the ridge detection often yields a sig-
nificant number of false-positive detections. Hence,
we apply a collection of task-specific geometric cri-
teria (Sec. 3.2.3) to exclude erroneously detected seg-
ments and decide about the presence of at least one
stromule for each plastid region extracted in the first
phase of our pipeline (Sec. 3.1). Since sometimes
outstandingly bright stromule parts are falsely inclu-
ded in a plastid region during plastid detection, a pre-
filtering step (Sec. 3.2.1) identifies such regions and
applies complementary heuristics for stromule vali-
dation to these specific regions.
3.2.1 Pre-filtering of Plastid Regions
The plastid detection usually extracts the outlines of
plastids accurately and yields compact and circular to
elliptical regions. Very bright stromules, however, are
sometimes detected as integral part of a plastid re-
gion. Then the basic assumptions about appearance
and characteristics of stromules as outlined in the in-
troduction and on which our detection methods relies
are no longer valid. To handle such situations we per-
form a pre-filtering to identify detected regions not
adhering to our model. Such regions are separately
checked for the presence of stromules.
We first calculate the solidity of a plastid region as
the ratio of its area and the area of its convex hull. If
this ratio lies below 0.85 both areas significantly dif-
fer and further investigations are required. If parts of
a stromule have accidentally been included in a plas-
tid region the shape of the region is locally thin and
elongated. This property can be used as criterion for
discovering such constellations. We extract the ske-
leton of a region under investigation, identify all end
points and extract the corresponding branches from
the end points up to the next branch or end point. All
branches shorter than 5 pixels or with a distance of
less than half of the total branch length between their
end points are discarded. They are too short or form
a circular structure very unlikely for stromules. Each
of the remaining branches is searched for runs of con-
secutive pixels that have a distance smaller or equal
to 4 pixels to the next background pixel in the binary
region image. If the longest of these runs exceeds a
length of 5 pixels the region is partially thin which is
often a clear indication for the presence of a stromule.
3.2.2 Ridge Detection
For detecting curvilinear segments as candidates for
stromule parts we use the ridge detection approach of
Steger (Steger, 1998) with publically available source
code
3
. Steger proposes models for the profiles of 1D
and 2D curvilinear structures in images. Based on
these models he derives criteria for the directional de-
rivatives of the image function which need to be ful-
filled by pixels along such structures and which serve
as basis for segment extraction. Initially, respective
pixels are found and for each pixel the local orienta-
tion of a potential segment is estimated from the ei-
genvalues and -vectors of the local Hessian matrix.
Individual pixels are then linked to curvilinear seg-
ments considering the consistency of local orientation
and user-defined contrast assumptions. The final re-
sult of the ridge detection is given by all curvilinear
segments exceeding a minimal length threshold.
3
Ridge (Line) Detection Plugin in Fiji by Wagner/Hiner,
https://imagej.net/Ridge Detection, accessed: 12/12/18
BIOIMAGING 2019 - 6th International Conference on Bioimaging
42
plastid
stromule
vertices
ellipse
A) exit angle
B) overall
distance
D) number of intersections
C) point distance
along ellipse
candidates
estimated
direction
~n
d
g
α
d
e
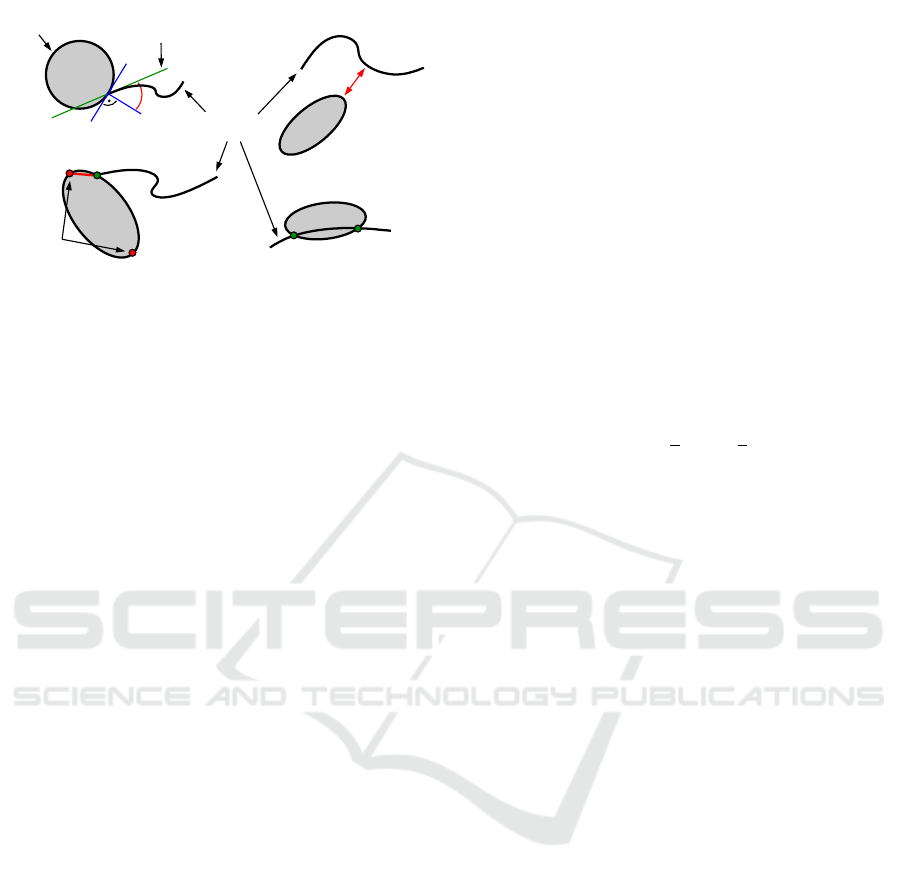
Figure 3: Geometric criteria to filter stromule candidates:
they need to emanate from the surface almost perpendicular
(A) and be located close to the plastid (B). In case of ellip-
tical plastid regions they tend to start off close to the ellipse
vertices (C) and usually do not cut through a region (D).
3.2.3 Geometric Criteria for Stromule Detection
The ridge detection usually yields a significant por-
tion of false-positive stromule candidates, depending
on noise level, image quality and potential artefacts
due to the image acquisition process and the proce-
dure for generating a flattened 2D image. Thus, to
decide if a plastid region forms at least one stromule
we need to further analyze the candidate segments.
According to the findings about the appearance of
plastids and stromules in our application and as outli-
ned in the introduction, we model each plastid region
as an ellipse to enable the identification of stromules
in their vicinity based on geometric criteria (Fig. 3).
Besides general assumptions about the length of a
stromule or its overall distance d
g
to the plastid re-
gion (Fig. 3B), we mainly assume stromules to com-
ply with two basic geometric criteria:
i) the angle α enclosed by the local normal ~n of
the plastid surface and the direction of a po-
tential stromule must not exceed a threshold θ
∆
(Fig. 3A), and
ii) for elliptical plastids the distance between the
point of origin of a stromule and at least one ver-
tex of the ellipse must not exceed a maximum dis-
tance θ
d
(Fig. 3C) .
In addition, stromules usually do not cut through a
plastid region (Fig. 3D) which is a property well-
suited to identify false detections due to reflections at
the cell walls (cf. Fig. 1D
∗∗
).
The different criteria outlined above are imple-
mented in our workflow as follows. First, we select
from the results of the ridge detection for each re-
gion the subset of segments which are located close
enough to the region to be eligible as a potential stro-
mule part. To this end, we define a focus area around
each binary plastid region by iteratively expanding the
region via morphological dilation to a maximal ex-
pansion of 20 pixels. In doing so region identity is
preserved, i.e., dilation locally stops as soon as ot-
her regions are touched. Subsequently, all curvilinear
segments are found which overlap with the expanded
region. Segments can be assigned to multiple regions
since a unique decision is not yet possible.
An ellipse is fit to each region to enable the appli-
cation of the geometric criteria. Each point (x, y) on
an ellipse in normal position, i.e., located in the center
of the coordinate system with major and minor axes
of lengths a and b, respectively, and being oriented
parallel to the x- and y-axes of the coordinate system
fulfills the following condition:
ε(x,y) :=
x
a
2
+
y
b
2
= 0 (1)
For points located inside the ellipse ε(x,y) < 0 and for
points located outside ε(x,y) > 0.
Given these definitions for each plastid region and
each assigned segment we determine the number of
intersections and classify the pixels of the segment
according to their distance and relative location to the
ellipse. Pixels of a segment located inside the ellipse
or having a distance larger than 4 pixels to the ellipse
are ignored in the following. Since the ellipses of
the plastid regions are usually not in normal position
pixels and ellipses are shifted and rotated to normal
position prior to classifying the pixels. In addition, to
account for discretization effects outer points are re-
quired to fulfill ε(x, y) > 1 instead of ε(x, y) > 0. If
there are no such pixels found on a segment it is com-
pletely discarded. Also, if two or more intersections
with the region ellipse are found the curvilinear seg-
ment is no longer considered since stromules usually
do not cross through a plastid region.
For the remaining segments the checks for a small
exit angle of the stromule and a short distance to the
ellipse vertices are applied. To calculate the exit angle
we determine the intersection point of ellipse and seg-
ment. In some cases no intersection point exists, e.g.,
due to discretization or if parts of a stromule could
not be localized by the ridge detection due to a lack
in contrast. Then we find the closest points on the el-
lipse and on the segment, respectively. Subsequently,
we compute the local normal direction of the ellipse
at the corresponding point and estimate the orienta-
tion of the segment by computing the orientation of a
line through the neighboring pixels of the closest seg-
ment point (Fig. 3A). Since stromules usually ema-
nate more or less perpendicular from the plastid sur-
Quantification of Stromule Frequencies in Microscope Images of Plastids Combining Ridge Detection and Geometric Criteria
43

face the angle α between both lines must not exceed
a threshold θ
∆
. Finally, for elliptical plastids the mi-
nimal distance between the intersection point or the
point with minimal distance to the ellipse, respecti-
vely, and any of the two vertices of the ellipse is cal-
culated. If this distance lies below a threshold θ
d
and
there is still a segment part of at least three pixels
length starting from the intersection point which lies
outside of the ellipse a stromule is assumed.
In conclusion, each plastid region for which at le-
ast one of the candidate segments survives all the ge-
ometric checks is assumed to form a stromule. The
stromule frequency (SF%) of an image is finally de-
fined as the ratio of plastids which form at least one
stromule in relation to all plastid regions detected in
the image.
4 RESULTS
The plastid detection has already been publically re-
leased some time ago as integral part of the MTBCel-
lCounter
4
, a semi-automatic tool for counting cells
and sub-cellular structures implemented as plugin in
ImageJ/Fiji (Franke et al., 2015) and based on Mi-
ToBo (M
¨
oller et al., 2016). The stromule detection
has been realized as extension for this tool, hence, is
also publically available. The source code is released
under GPL license and available from Github, additi-
onal documentation can also be found on the MiToBo
website
5
.
We have tested our approach on a set of images
of the leaf epidermis from two different plants, Ara-
bidopsis thaliana (Fig. 4) and Nicotiana benthami-
ana (Fig. 5). The MTBCellCounter was executed in
an up-to-date Fiji installation on a virtual machine
using a single core of an up-to-date desktop CPU and
2GB RAM, and running Windows 8, 64-bit, as opera-
ting system. Given these settings processing a single
image takes on average a few seconds to approxima-
tely half a minute of time, depending on the chosen
parameter settings (see below), the number of plastids
present in the image, and of course the overall image
quality and noise level. In general, the code is not yet
optimized for efficiency and some intermediate steps
might be speeded-up. Also, as each individual plastid
region is processed independent of other regions pa-
rallelization of stromule analysis would be possible.
The MTBCellCounter allows to adjust the para-
meter settings for the plastid detection depending on
4
MTBCellCounter page, http://mitobo.informatik.uni-
halle.de/index.php/Applications/MTBCellCounter
5
MiToBo website, http://mitobo.informatik.uni-halle.de
the concrete images at hand. In addition, the three ge-
ometric criteria applied in stromule validation which
consider the number of intersections, the angle bet-
ween surface normal and segment, and the distance to
the ellipse vertices, can independently be enabled or
disabled according to the type of plastids present in a
specific experiment. Also the thresholds for the max-
imal difference in orientation and the vertex distance
can individually be configured by the user.
We selected the images of our test set for which
we present results here to show a significant variabi-
lity in image characteristics allowing to demonstrate
the general capabilities and flexibility of our appro-
ach. As a consequence the optimal settings for the va-
rious parameters were selected individually for each
image. In common image data sets, however, the vari-
ance among individual images is usually much smal-
ler than in the test data set and the images show more
similar properties. Hence, in a more realistic expe-
rimental setting a common set of parameters for all
images of a data set can be found easier and with mo-
derate effort.
In Fig. 4 results for a section of one of the ima-
ges of the upper epidermis of Arabidopsis thaliana
are shown. In the top row the basis data for stromule
identification, i.e., detected plastids (Fig. 4B) and ex-
tracted stromule candidate segments (Fig. 4D) are de-
picted. In this example all plastids have satisfactorily
been detected. From the initial result of the ridge de-
tection in Fig. 4C the high false-positive rate is obvi-
ous. Particularly in the image background several cur-
vilinear structures have been found which are hard to
distinguish from real stromules considering the local
support of the ridge detection. After filtering out seg-
ments not located close to a plastid, however, many of
the false-positives are already eliminated.
In the bottom row of Fig. 4 the outcomes of the
different checks for geometric consistency are visua-
lized. Plastid regions for which at least one stromule
is hypothesized are shown in green color with the cor-
responding stromule parts being colored in yellow (ir-
relevant pixels inside the ellipse or too far away) and
magenta (relevant pixels), respectively. Four of the
seven plastids in this image form stromules, the three
around the center of the image and the one in the
bottom left corner. By applying just the exit angle cri-
terion with θ
∆
= 30
◦
(Fig. 4E) three of these plastids
are correctly identified, while in the top left corner an
additional plastid is falsely assumed to form a stro-
mule. If in addition also an ellipse distance threshold
of θ
d
= 3.0 is applied (Fig. 4G) this false-positive de-
tection is eliminated. The inset in Fig. 4G visualizes
this criterion in detail for a different plastid. In orange
and marked with white arrows you can see the ellipse
BIOIMAGING 2019 - 6th International Conference on Bioimaging
44
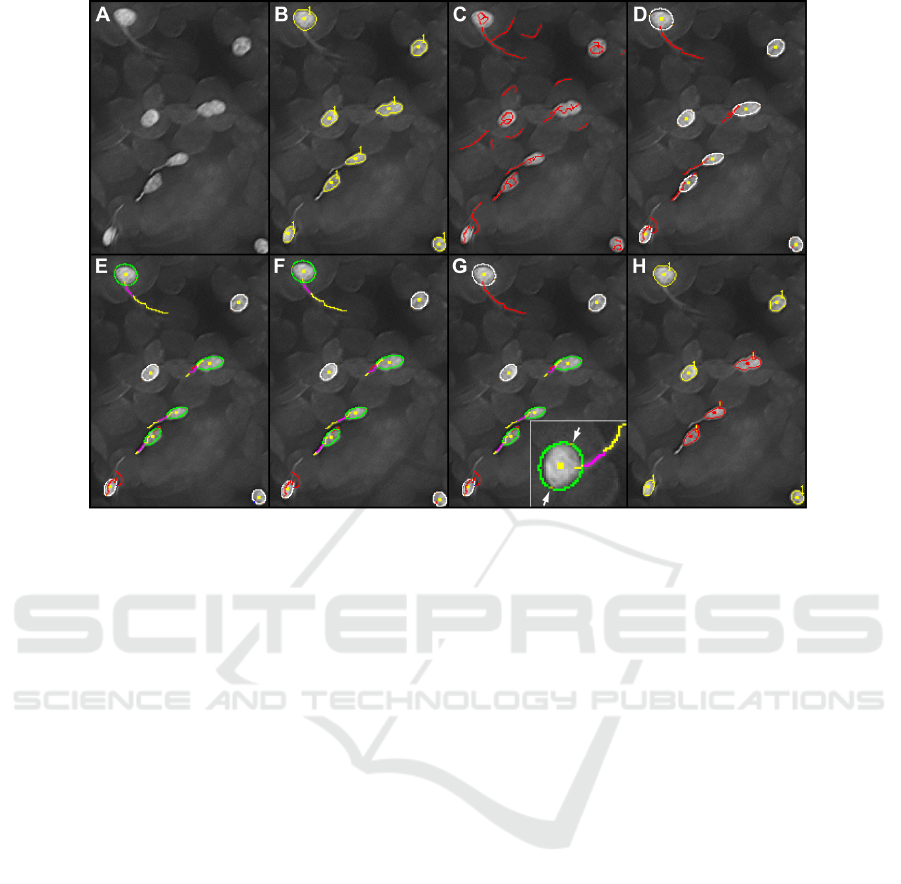
Figure 4: Results for images of A. thaliana: A) part of a typical input image; B) detected plastids; C) result of ridge detection;
D) remaining stromule candidates; E) detected stromules with an exit angle less than 30
◦
; F) result with multi-intersection
check enabled in addition (here no effect); G) same result as in F) with additional ellipse distance threshold applied; H) final
output with plastids (yellow) and plastids with stromules (red). For additional information on color encodings refer to the text.
vertices which in this case are relatively far away from
the exit point of the potential stromule on the right.
The stromule visible in the bottom left corner cannot
be identified in this example due to a lack in contrast
and some blurring around its exit point which already
causes the ridge detection to fail here (Fig. 4C).
In Fig. 5 a sample detection result for an image
clip from one of the images of Nicotiana benthami-
ana is shown. Compared to Arabidopsis thaliana the
plastids in Nicotiana benthamiana are usually more
circular, hence, the distance criterion assuming stro-
mule exit points being located close to the ellipse
vertices does not work well in this case. In addi-
tion, reflections at cell walls occur more frequently in
these images. The plastid detection again detects all
three plastids in this example (Fig. 5B) very accura-
tely. Only the plastid in the bottom left corner forms
a stromule while the one in the center of the image
is located close to a reflection. From the results of
the ridge detection it can be seen that for both, the
reflection and the true stromule, candidate segments
are detected. Without applying the check for multi-
ple intersections both are classified as stromule parts
(Fig. 5D), while enabling the criterion yields the cor-
rect result with only one plastid forming a stromule
here (Fig. 5E, F). The criterion for the distance be-
tween ellipse vertices and exit point could also help
to eliminate the false-positive detection in this speci-
fic case. However, generally enabling the criterion for
images of Nicotiana benthamiana bears the risk to ex-
clude many true stromule candidates due to the shape
characteristics of the plastids.
Our data set of test images subsumes in total 6
images of Arabidopsis thaliana and 6 images of Ni-
cotiana benthamiana. For all 12 images an automa-
tic detection of plastids and stromules was carried out
applying our new workflow. Subsequently, the results
were manually checked and partially corrected by a
biological expert yielding an estimate for the accuracy
of automatic quantification. In Fig. 6 scatter plots of
automatic and manual counts for plastids (at the top)
and stromules (at the bottom) are shown. As can be
seen from the plots our approach tends to slightly lar-
ger counts for plastids and stromules than resulting
from manual annotation, though, the absolute diffe-
rences are usually smaller than 10. For stromules
slightly larger differences can be observed. This is
mainly due to stromules being much more difficult to
detect than plastids. Particularly distracting intensity
signals like reflections or others curvilinear structures
also present in the images may easily result in false
detections. Nonetheless extracted stromule frequen-
cies usually coincide well between manual and auto-
matic counting.
Quantification of Stromule Frequencies in Microscope Images of Plastids Combining Ridge Detection and Geometric Criteria
45
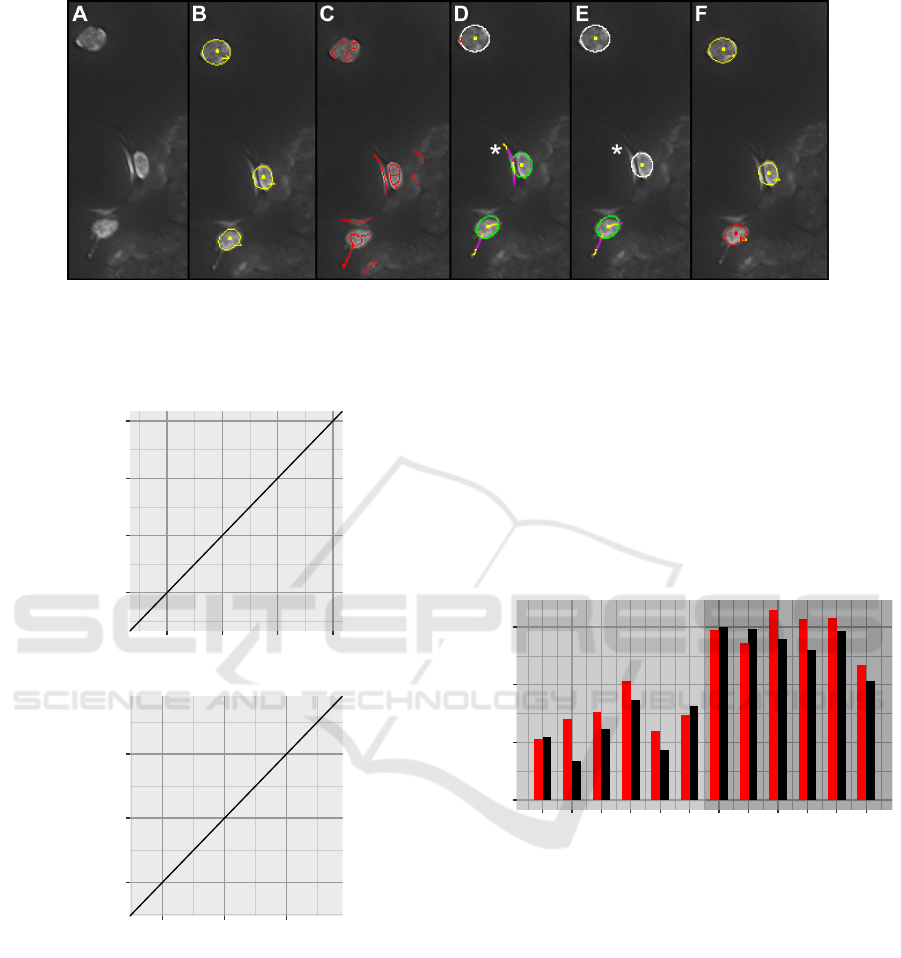
Figure 5: Results for images of N. benthamiana: A) part of a typical input image; B) detected plastid regions; C) result of
the ridge detection; D) detected stromules with one reflection (D
∗
) being erroneously classified as stromule; F) result with
activated multi-intersection criterion which eliminates the false-positive detection (E
∗
); F) final output with detected plastids
(yellow) and plastids forming stromules (red).
●
●
●
●
●
●
●
●
●
●
●
●
150
200
250
300
150 200 250 300
Manual plastid counts
Automatic plastid counts
●
●
●
●
●
●
●
●
●
●
●
40
80
120
40 80 120
Manual stromule counts
Automatic stromule counts
Figure 6: Result counts for the 12 test images (black: A. tha-
liana, red: N. benthamiana), on top plastids and at the
bottom stromules. On the x-axes the counts manually ex-
tracted by a biological expert are shown, on the y-axes the
counts automatically acquired with our new workflow.
In Fig. 7 extracted stromule frequencies for each
of the 12 test images are plotted, the results of the au-
tomatic extraction in red and the ones of the manual
extraction in black. The overall stromule frequen-
cies (SF%) vary significantly between the different
images where in this case images of Nicotiana bent-
hamiana (bars on the right) show larger frequencies
than the images of Arabidopsis thaliana (bars on the
left) due to different treatments. The automatically
and manually extracted stromule frequencies are most
of the time comparable with an average difference of
≈ 0.062. For three images (IDs 2, 9 and 10) the dif-
ferences exceed 0.1 with a maximum of ≈ 0.15. Vice
versa, for five images the difference lies below 0.05.
0.0
0.2
0.4
0.6
1 2 3 4 5 6 7 8 9 10 11 12
Image ID
Stromule frequency SF%
Figure 7: Comparison of automatically (red) and manually
(black) extracted stromule frequencies for the 12 images of
A. thaliana (IDs 1 − 6) and N. benthamiana (IDs 7 − 12).
Given the unquestionable difficulty of the overall
task of stromule identification in wide field fluores-
cence microscopy images, and given the observation
that also within the manual counting results of diffe-
rent human experts usually noticeable variation in the
numbers of plastids and particularly of stromules can
be observed, the results appear very pleasing. Cer-
tainly the quality of the detection depends on the over-
all image characteristics, and large variability within
a set of images renders the task of stromule identifi-
cation harder. Nevertheless, as could be shown by the
experimental results in this study the approach can al-
ready satisfactorily cope with a significant amount of
variation and will allow to extract reasonable stromule
BIOIMAGING 2019 - 6th International Conference on Bioimaging
46

frequencies in many settings. In addition, the overall
time required for checking and post-processing the re-
sults of the new automatic workflow will in almost all
cases be significantly smaller than the time necessary
for fully manual annotation of plastids and stromu-
les. Instead of manually annotating several hundreds
of plastids and stromules by hand, usually only up
to 15% of the plastids and an even smaller fraction
of plastids with stromules per image requires manual
processing. This allows to extract large and repre-
sentative data sets much more efficiently than before
yielding a suitable basis for biological investigations.
5 CONCLUSIONS
The new image analysis workflow for the extraction
of stromule frequencies from wide field microscopy
images is capable of extracting reasonable quantita-
tive data suitable for biological investigations. Its per-
formance is comparable to those of human experts
while greatly reducing the time requirements. The
necessity for manual intervention is significantly re-
duced to a small fraction of the time that would be ne-
cessary for fully manual annotation. Thus, although
the overall workflow is not yet fully automatic and re-
lies on manual parameter tuning as well as on manual
validation and post-processing of results, our appro-
ach marks a significant improvement over the state-
of-the-art in stromule studies.
Future work will aim to further increase the de-
gree of automation and improve overall computatio-
nal efficiency and detection robustness, particularly
with regard to stromules. One possible direction will
be the investigation of machine learning techniques
for robust stromule identification particularly in ima-
ges with a high noise level and low quality.
ACKNOWLEDGEMENTS
This work has been supported by core funding of the
Martin Luther University Halle-Wittenberg, Saxony-
Anhalt, Germany, to B. M. and M. S.
REFERENCES
Basset, A., Boulanger, J., et al. (2015). Adaptive spot de-
tection with optimal scale selection in fluorescence
microscopy images. IEEE Trans. on Image Proc.,
24(11):4512–4527.
Bergeest, J.-P. and Rohr, K. (2012). Efficient globally opti-
mal segmentation of cells in fluorescence microscopy
images using level sets and convex energy functionals.
Medical Image Analysis, 16(7):1436 – 1444.
Buggenthin, F., Marr, C., et al. (2013). An automatic met-
hod for robust and fast cell detection in bright field
images from high-throughput microscopy. BMC Bi-
oinformatics, 14(1):297.
Chen, C., Wang, W., et al. (2013). A flexible and ro-
bust approach for segmenting cell nuclei from 2D mi-
croscopy images using supervised learning and tem-
plate matching. Cytometry Part A, 83A(5):495–507.
Erickson, J. L., Adlung, N., et al. (2017). The Xanthomo-
nas effector XopL uncovers the role of microtubules
in stromule extension and dynamics in nicotiana bent-
hamiana. The Plant Journal, 93(5):856–870.
Frangi, A. F., Niessen, W. J., et al. (1998). Multiscale vessel
enhancement filtering. In Medical Image Computing
and Computer-Assisted Intervention (MICCAI), pages
130–137. Springer Berlin Heidelberg.
Franke, L., Storbeck, B., et al. (2015). The ’MTB Cell
Counter’ a versatile tool for the semi-automated quan-
tification of sub-cellular phenotypes in fluorescence
microscopy images. A case study on plastids, nuclei
and peroxisomes. Journal of Endocytobiosis and Cell
Research, 26:31–42.
Fraz, M., Remagnino, P., et al. (2012). Blood vessel seg-
mentation methodologies in retinal images - a sur-
vey. Computer Methods and Programs in Biomedi-
cine, 108(1):407–433.
Gray, J. C., Hansen, M. R., et al. (2012). Plastid stromules
are induced by stress treatments acting through absci-
sic acid. The Plant Journal, 69(3):387–398.
Greß, O., M
¨
oller, B., et al. (2010). Scale-adaptive wavelet-
based particle detection in microscopy images. In
Meinzer, H.-P., Deserno, T. M., Handels, H., and Tolx-
dorff, T., editors, Bildverarbeitung f
¨
ur die Medizin,
Informatik Aktuell, pages 266–270, Berlin. Springer.
ISBN 978-3-642-11967-5.
Hanson, M. R. and Hines, K. M. (2018). Stromules:
probing formation and function. Plant Physiology,
176(1):128–137.
K
¨
ohler, R. H., Cao, J., et al. (1997). Exchange of protein
molecules through connections between higher plant
plastids. Science, 276(5321):2039–2042.
K
¨
ohler, R. H. and Hanson, M. R. (2000). Plastid tubules of
higher plants are tissue-specific and developmentally
regulated. Journal of Cell Science, 113:81–89.
Kraus, O. Z., Ba, J. L., and Frey, B. J. (2016). Classifying
and segmenting microscopy images with deep multi-
ple instance learning. Bioinformatics, 32(12):i52–i59.
Kumar, A. S., Park, E., et al. (2018). Stromule extension al-
ong microtubules coordinated with actin-mediated an-
choring guides perinuclear chloroplast movement du-
ring innate immunity. eLife, 7:e23625.
Marques, J. P., Schattat, M. H., et al. (2004). In vivo trans-
port of folded EGFP by the DeltapH/TAT-dependent
pathway in chloroplasts of Arabidopsis thaliana. Jour-
nal of Experimental Botany, 55(403):1697–1706.
Moghimirad, E., Rezatofighi, S. H., and Soltanian-Zadeh,
H. (2012). Retinal vessel segmentation using a multi-
Quantification of Stromule Frequencies in Microscope Images of Plastids Combining Ridge Detection and Geometric Criteria
47

scale medialness function. Computers in Biology and
Medicine, 42(1):50–60.
M
¨
oller, B., Glaß, M., et al. (2016). MiToBo - a toolbox
for image processing and analysis. Journal of Open
Research Software, 4(1):e17.
Olivo-Marin, J.-C. (2002). Extraction of spots in biological
images using multiscale products. Pattern Recogni-
tion, 35(9):1989 – 1996.
Qi, J. (2014). Dense nuclei segmentation based on graph
cut and convexity-concavity analysis. Journal of Mi-
croscopy, 253(1):42–53.
Rueden, C. T., Schindelin, J., et al. (2017). ImageJ2: Ima-
geJ for the next generation of scientific image data.
BMC Bioinformatics, 18(1):529.
Salahat, E., Saleh, H., et al. (2015). Novel MSER-
guided street extraction from satellite images. In
IEEE Intern. Geoscience and Remote Sensing
Symp. (IGARSS), pages 1032–1035.
Schattat, M. H. and Kl
¨
osgen, R. B. (2009). Improvement
of plant cell microscope images by use of “depth of
field”-extending software. Journal of Endocytobiosis
and Cell Research, (19):11–19.
Schattat, M. H. and Kl
¨
osgen, R. B. (2011). Induction of
stromule formation by extracellular sucrose and glu-
cose in epidermal leaf tissue of arabidopsis thaliana.
BMC Plant Biology, 11(1):115.
Schindelin, J., Arganda-Carreras, I., et al. (2012). Fiji: an
open-source platform for biological-image analysis.
Nature Methods, 9(7):676.
Smal, I., Loog, M., et al. (2010). Quantitative comparison
of spot detection methods in fluorescence microscopy.
IEEE Trans. on Medical Imaging, 29(2):282–301.
Staal, J., Abr
`
amoff, M. D., et al. (2004). Ridge-based ves-
sel segmentation in color images of the retina. IEEE
Transactions on Medical Imaging, 23:501–509.
Steger, C. (1998). An unbiased detector of curvilinear
structures. IEEE Trans. Pattern Anal. Mach. Intell.,
20(2):113–125.
Xing, F. and Yang, L. (2016). Robust nucleus/cell detection
and segmentation in digital pathology and microscopy
images: a comprehensive review. IEEE Reviews in
Biomedical Engineering, 9:234–263.
Zeng, G., Birchfield, S. T., and Wells, C. E. (2008). Au-
tomatic discrimination of fine roots in minirhizotron
images. New Phytologist, 177(2):549–557.
BIOIMAGING 2019 - 6th International Conference on Bioimaging
48
