
Graph-based Characterisations of Cell Types and Functionally Related
Modules in Promoter Capture Hi-C Data
Lelde Lace, Gatis Melkus, Peteris Rucevskis, Edgars Celms, Karlis Cerans, Paulis Kikusts,
M
¯
artin¸
ˇ
s Opmanis, Darta Rituma and Juris Viksna
Institute of Mathematics and Computer Science, University of Latvia, Rainis Boulevard 29, Riga, Latvia
lelde.lace, gatis.melkus, peteris.rucevskis, edgars.celms, karlis.cerans, paulis.kikusts, martins.opmanis, darta.rituma,
Keywords:
Hi-C Networks, Cell Type Specificity, Graph-Based Metrics, Graph Topology.
Abstract:
Current technologies, noteworthy Hi-C, for chromosome conformation capture allow to understand a broad
spectrum of functional interactions between genome elements. Although significant progress has been made,
there are still a lot of open questions regarding best approaches for analysis of Hi-C data to identify bio-
logically significant features. In this paper we approach this problem by focusing strictly on the topological
properties of Hi-C interaction graphs. Graph topological properties were analysed from the perspective of
two research questions: 1) are topological properties alone able to distinguish between different cell types
and assign biologically meaningful distances between them; 2) what is a typical structure of Hi-C interaction
graphs and can we assign a biological significance to structural elements or features? The analysis was applied
to a set of Hi-C interactions in 17 human haematopoietic cell types. Promising results have been obtained at
answering both questions. Firstly, we propose a concrete set Base11 of 11 topology-based metrics that pro-
vide good discriminatory power between cell types. Secondly, we have explored the topological features
of connected components of Hi-C interaction graphs and demonstrate that such components tend to be well
conserved within particular cell type subgroups and can be well associated with known biological processes.
1 INTRODUCTION
The spatial organization of a genome inside of a liv-
ing cell’s nucleus has long been appreciated as an im-
portant determinant of genomic function. One of the
most important methods for studying this organiza-
tion has been chromosome conformation capture or
3C, in which closely associated genomic fragments
are cross-linked via formaldehyde treatment and then
purified, permitting closer study (Dekker et al., 2002).
Since its inception at the start of the previous decade,
the original 3C protocol has been adapted and com-
bined with other methods, including chromatin im-
munoprecipitation and next-generation sequencing to
assist in broadening the scope and depth of individ-
ual experiments. Particularly noteworthy among these
is Hi-C, which utilises a biotin-streptavidin purifi-
cation method in combination with next-generation
sequencing technology to potentially create a com-
plete, unbiased genomic library of chromatin inter-
actions (Lieberman-Aiden et al., 2009; Belton et al.,
2012). However, in practice Hi-C produces highly
complex datasets that do not lend themselves easily
to the study of genomic contacts below a resolution
of 1 Mb, and to simplify such studies an additional
refinement, capture Hi-C (cHi-C), was invented. In
cHi-C the complex Hi-C library is subjected to an ad-
ditional sequence capture step that obtains a subset
of interactions that occur with a preselected subset of
genomic regions known as ’bait fragments’, simplify-
ing the resulting data sufficiently to allow for statisti-
cally significant results at a high genomic resolution
(Dryden et al., 2014; Mifsud et al., 2015). Capture
Hi-C has subsequently been used in other studies for
varying elements of interest including gene promot-
ers (Mifsud et al., 2015; Javierre et al., 2016), au-
toimmune disease-associated genomic variants (Mar-
tin et al., 2015), colorectal cancer risk loci (J
¨
ager
et al., 2015), cardiovascular disease risk loci (Mon-
tefiori et al., 2018) and more.
The basic analysis of Hi-C datasets is largely es-
tablished and well-documented (Lajoie et al., 2015).
However, the large amount of comprehensive data ob-
tained and the high cost of exhaustive and represen-
tative experiments utilising these methods mean that
it is important to consider how currently published
78
Lace, L., Melkus, G., Rucevskis, P., Celms, E., Cerans, K., Kikusts, P., Opmanis, M., Rituma, D. and Viksna, J.
Graph-based Characterisations of Cell Types and Functionally Related Modules in Promoter Capture Hi-C Data.
DOI: 10.5220/0007390800780089
In Proceedings of the 12th International Joint Conference on Biomedical Engineering Systems and Technologies (BIOSTEC 2019), pages 78-89
ISBN: 978-989-758-353-7
Copyright
c
2019 by SCITEPRESS – Science and Technology Publications, Lda. All rights reserved

datasets could best be mined to answer additional bi-
ological questions. Several methods exist by which
the resolution of a Hi-C dataset can be theoretically
improved through more sophisticated interaction call-
ing algorithms. These include several algorithms with
broadly comparable performances for general Hi-C
data (Forcato et al., 2017) and also more specific tools
such as the CHiCAGO analysis pipeline meant specif-
ically for cHi-C datasets (Cairns et al., 2016), and
these algorithms can involve techniques ranging from
modelling technical biases (Ay et al., 2014) to em-
ploying a deep convolutional neural network (Zhang
et al., 2018). Another set of approaches that are dis-
tinct from these are clustering methods where avail-
able 3C and Hi-C data are analysed in the interest of
discovering functionally related modules of genes and
regulatory elements. These include the use of δ-teams
models for Hi-C data to identify both known and puta-
tive gene clusters (Schulz et al., 2018), hard- and soft-
clustering algorithms that could theoretically assist in
the interpretation of combined metagenomic sequenc-
ing and 3C data (DeMaere and Darling, 2016), and
also spectral clustering-based methods such as the
Arboretum-Hi-C framework that was found to be use-
ful in identifying chromatin features in mammalian
Hi-C datasets at several levels of organization and
pointed to the potential utility of graph-based cluster-
ing in both analysing and comparing Hi-C datasets in
general (Siahpirani et al., 2016).
Although the advantages of analysing Hi-C inter-
action data in graph-related terms are already well ac-
cepted – e.g approaches by (Siahpirani et al., 2016)
or (Cairns et al., 2016) explicitly discuss graph-based
formalisms and their methods have been success-
fully applied when analysing new data sets (Javierre
et al., 2016), only the properties of interaction ma-
trices (which can be considered as weighted graphs)
are mainly taken into account as well as some addi-
tional data (e.g. interaction segment distances and
associations with known gene regulations). Analysis
of topological features of these interaction graphs and
their biological significance, however, remain largely
unexplored. (Although some studies explicitly men-
tion ’topological features’, these are very limited and
usually more related to the topology of chromosomes
rather than interaction graphs – e.g. in (Wang et al.,
2013) these are interpreted as the distributions of in-
teraction endpoints on chromosomes).
In this paper we focus explicitly only on the topo-
logical properties of Hi-C interaction graphs. These
properties were identified and analysed from the per-
spective of two research questions: 1) are topologi-
cal properties of Hi-C interaction graphs alone able
to distinguish between different cell types and assign
biologically meaningful distances between them; 2)
what is a typical structure of Hi-C interaction graphs
and can we assign some biological significance to
structural elements or features of these graphs?
2 DATASET USED FOR THIS
STUDY
For this study we use a dataset of long-range inter-
actions between promoters and other regulatory el-
ements that was generated by The Babraham Insti-
tute and University of Cambridge (Javierre et al.,
2016). The data comprise interactions that were
determined by promoter capture Hi-C in 17 human
primary haematopoietic cell types. The measure-
ments have identified interaction regions of 31253
promoters across all chromosomes; from these high-
confidence PCHi-C interactions have been selected
using CHiCAGO pipeline (Cairns et al., 2016) and se-
lecting interactions with score 5 or more. These data
are available from the Open Science Framework web-
site (Javierre et al., 2016). This data set is still largely
unique because it contains genome-wide data cover-
ing a representative subset of the entire haematopoi-
etic lineage collected using a unified protocol.
From these data we have constructed directed
graphs separately for each chromosome (few inter-
chromosome interactions were rejected and chromo-
some Y was not considered due to a very few interac-
tions) and for each cell type. The vertices of graphs
are chromosome segments that correspond either to
promoters (’baits’) or the detected interaction regions
(’other ends’), the edges correspond to interactions
and are directed from ’baits’ to ’other ends’. Un-
like most other analyses we only consider the topol-
ogy of interaction graphs, without assigning concrete
sets of genes to the vertices. In total we obtained
23 ×17 chromosome and cell type-specific graphs,
each of which can be considered as a subgraph of the
’complete interaction network’ having a total number
of vertices 251209 (with ranges between 2904 and
23079 per chromosome) and 723165 edges. Simi-
larly, each of these graphs can be considered as a sub-
graph of the ’interaction network’ of one of the chro-
mosomes, which is specific for a given cell type.
In a number of computational tests the graphs
were further modified by varying CHiCAGO scores
between thresholds for edge inclusion between 3 and
8. Although no comprehensive analysis was done, in
general such variations had a limited impact on the
stability of the results.
Graph-based Characterisations of Cell Types and Functionally Related Modules in Promoter Capture Hi-C Data
79

3 EXPLAINING DIFFERENCES
BETWEEN CELL TYPES WITH
GRAPH-BASED METRICS
In this section we analyse the possibility to distin-
guish between cell types using sets of metrics that are
based on graph topological structure and propose a
concrete set Base11 of metrics having the largest dis-
criminatory power. The approach is somewhat simi-
lar to graphlet-based methods (Yaveroglu et al., 2015)
that have been successfully used for analysis of differ-
ent types of biological networks and also in our previ-
ous work on protein structure analysis (Viksna et al.,
2004; Celms et al., 2018). The graphlet methods rely
on network sampling for the presence of a predefined
set of small subgraphs, for protein structure analysis
the graphs were derived from typical common sub-
graphs.
Neither of these approaches, however, seem to be
directly applicable to Hi-C interaction graphs due to
lack of well defined common topological substruc-
tures (partially because the presence of edges depends
on weight thresholds, and neither of the aforemen-
tioned methods are well suited to weighted graphs).
Whilst features that are explicitly based on graph
metrics sometimes have been used to analyse certain
types of biomolecular interactions (e.g. in (Quadrini
and Emanuela, 2018) for RNA structure analysis),
such metrics, however, usually are more related to
vertex or edge weights or labels rather than to graph
topological properties.
In our set of proposed metrics we have tried to in-
clude more global graph properties, which are easy to
compute and also remain comparatively stable under
changing weight thresholds (at least for this particular
dataset of Hi-C interaction graphs).
3.1 Graph-based Metrics
The initial set Base57 contains 57 different metrics
characterising graph topology. The selection of these
metrics were based on manual exploration of graphs,
however, short of including all the possible counts of
different small subgraphs (from which only cliques
and cycles of length 2 are considered), they cover
most of usually considered graph topological prop-
erties that can be computed efficiently. The set con-
sists of the following metrics: CCnE – a number of
connected components with n edges, CCnV – a num-
ber of connected components with n vertices, BCnE –
a number of vertex bi-connected components with n
edges, BCnV – a number of vertex bi-connected com-
ponents with n vertices, SCnE – a number of strongly
connected components with n edges, SCnV – a num-
ber of strongly connected components with n vertices
and CLnV – a number of cliques (ignoring edge di-
rections) of size n, with values of n ranging from
3 to 8+ (8 or more). Metrics CCmaxV, CCaverV
denote maximal and average (for cell types) num-
bers of vertices in connected components, and CC-
maxE, CCaverE, BCmaxV, BCaverV, BCmaxE, BCa-
verE, SCmaxV, SCaverV, SCmaxE, SCaverE are de-
fined similarly for numbers of edges and vertices and
bi-connected and strongly connected components. Fi-
nally, CLmaxV and CLaverV denote maximal and av-
erage clique sizes, and antiparallelEdges is number
of cycles of length 2.
Apart from these additional 4 metrics were con-
sidered that are closely related to the sizes of graphs:
V – the number of vertices, E – the number of edges,
E9 – the number of edges, which are not shared by 9
or more (i.e. by no more than 50% of all) cell types
and E17 – the number of edges, which are not shared
by all 17 cell types.
To minimise the effect of the measure of cell type
distances being based simply on different numbers of
particular features (which very likely will be strongly
correlated to the difference in sizes of interaction
graphs) the values of metrics were normalised, i.e.,
for a metric m its value m(i, j) for cell types i and
j was defined as m(i, j) = m
i, j
/
√
m
i
×m
j
, where m
I
and m
j
are the numbers of features in graphs of cell
types i and j and m
i, j
is the number of features in the
largest common subgraph of these graphs. Such val-
ues m(i, j) were computed for all 61 metrics and all
136 distinct tissue pairs i and j.
One clearly expects a high correlation between the
values of metrics V, E, E9 and E17; however, there
are also high correlations between certain pairs from
Base57 set, in particular, between numbers of vertices
and edges in specific types of components. Only one
of the metrics was kept for pairs with correlations of
0.93 and above (after which there is a slight drop, al-
though the main reason for choosing this threshold
was very clear correlations between metrics measur-
ing numbers of vertices and numbers of edges), lead-
ing to the removal of CCnV, BCnV, SCnV for all val-
ues of n and also the removal of CCmaxV, CCaverV,
BCmaxV, BCaverV as well as CLmaxV (strongly cor-
relating with CLmaxV). For the further studies the re-
maining subset Base34 of 34 metrics from Base57
was chosen.
3.2 Cell Type Distances
While the molecular mechanisms underlying
haematopoiesis in humans are incompletely under-
stood, the general pattern of haematopoietic stem
BIOINFORMATICS 2019 - 10th International Conference on Bioinformatics Models, Methods and Algorithms
80
cell differentiation into erythroid, megakaryocytic,
myeloid and lymphoid lineages is generally agreed
upon and commonly represented in haematopoietic
trees (e.g. Robb et al. 2007). Although hierarchical
classification of blood cell types from varying lin-
eages is occasionally performed, e.g. on the basis
of ribosomal protein expression (Guimaraes and
Zavolan, 2016), it is usually done with the intent
of validating results by examining their consistency
with well-known conceptions of haematopoiesis. The
situation is similar with CHiCAGO based clustering
of Hi-C data from (Javierre et al., 2016), however,
this study assigns easily quantifiable distances, and,
since we are working with the same Hi-C dataset,
seems the most appropriate for comparison.
It should be emphasised that our goal is not
to replicate the same results using slightly different
methods. Our approach is distinct from (Javierre
et al., 2016) in that we analyse the interactions not as
a weight matrix, but in graph-topology specific terms.
The question, therefore, is whether there exists a set
of specific topological properties that can be utilized
to distinguish between different forms of chromatin
interactions captured in Hi-C data, and whether these
properties are potentially useful in describing and pre-
dicting coordinated genomic processes.
On basis of these data we consider two distance
measures: Dcont ranging from 0.00 to 1.00 that
are proportional to distances from (Javierre et al.,
2016) and a binarised version Db with values 0 and
1 applying cut-off threshold 0.50 (see Figure 1). We
also consider two distances based only on biologi-
cally well-accepted cell type similarities: Dt that is
equal to 0 for cell types within the same (lymphoid
and myeloid) subgroups and equal to 1 for cells
from different subgroups, and D4 based on their
respective positions in the haematopoietic tree and
(in the case of endothelial precursors EP) functional
similarities. This separates cells into 5 subgroups:
G
1
= {MK,Ery}, G
2,1
= {Mac0,Mac1, Mac2},
G
2,2
= {EP,Mon, Neu}, G
3,1
=
{aCD4,naCD4,tCD4, nCD4, nCD8,tCD8,FoetT}
and G
3,2
= {nB,tB} and assigns distance D4 equal to
0.33 between different members of the same group,
distances 0.67 between pairs from groups G
2,1
, G
2,2
and G
3,1
, G
3,2
and distances 1.0 between pairs from
other groups. For a pair of the same cell types D4 is
0.
In addition we also tested 3 distances DA, DB and
DC to check the possibility to separate some closely
related cell subgroups from the other cell types in the
tree (see Figure 1).
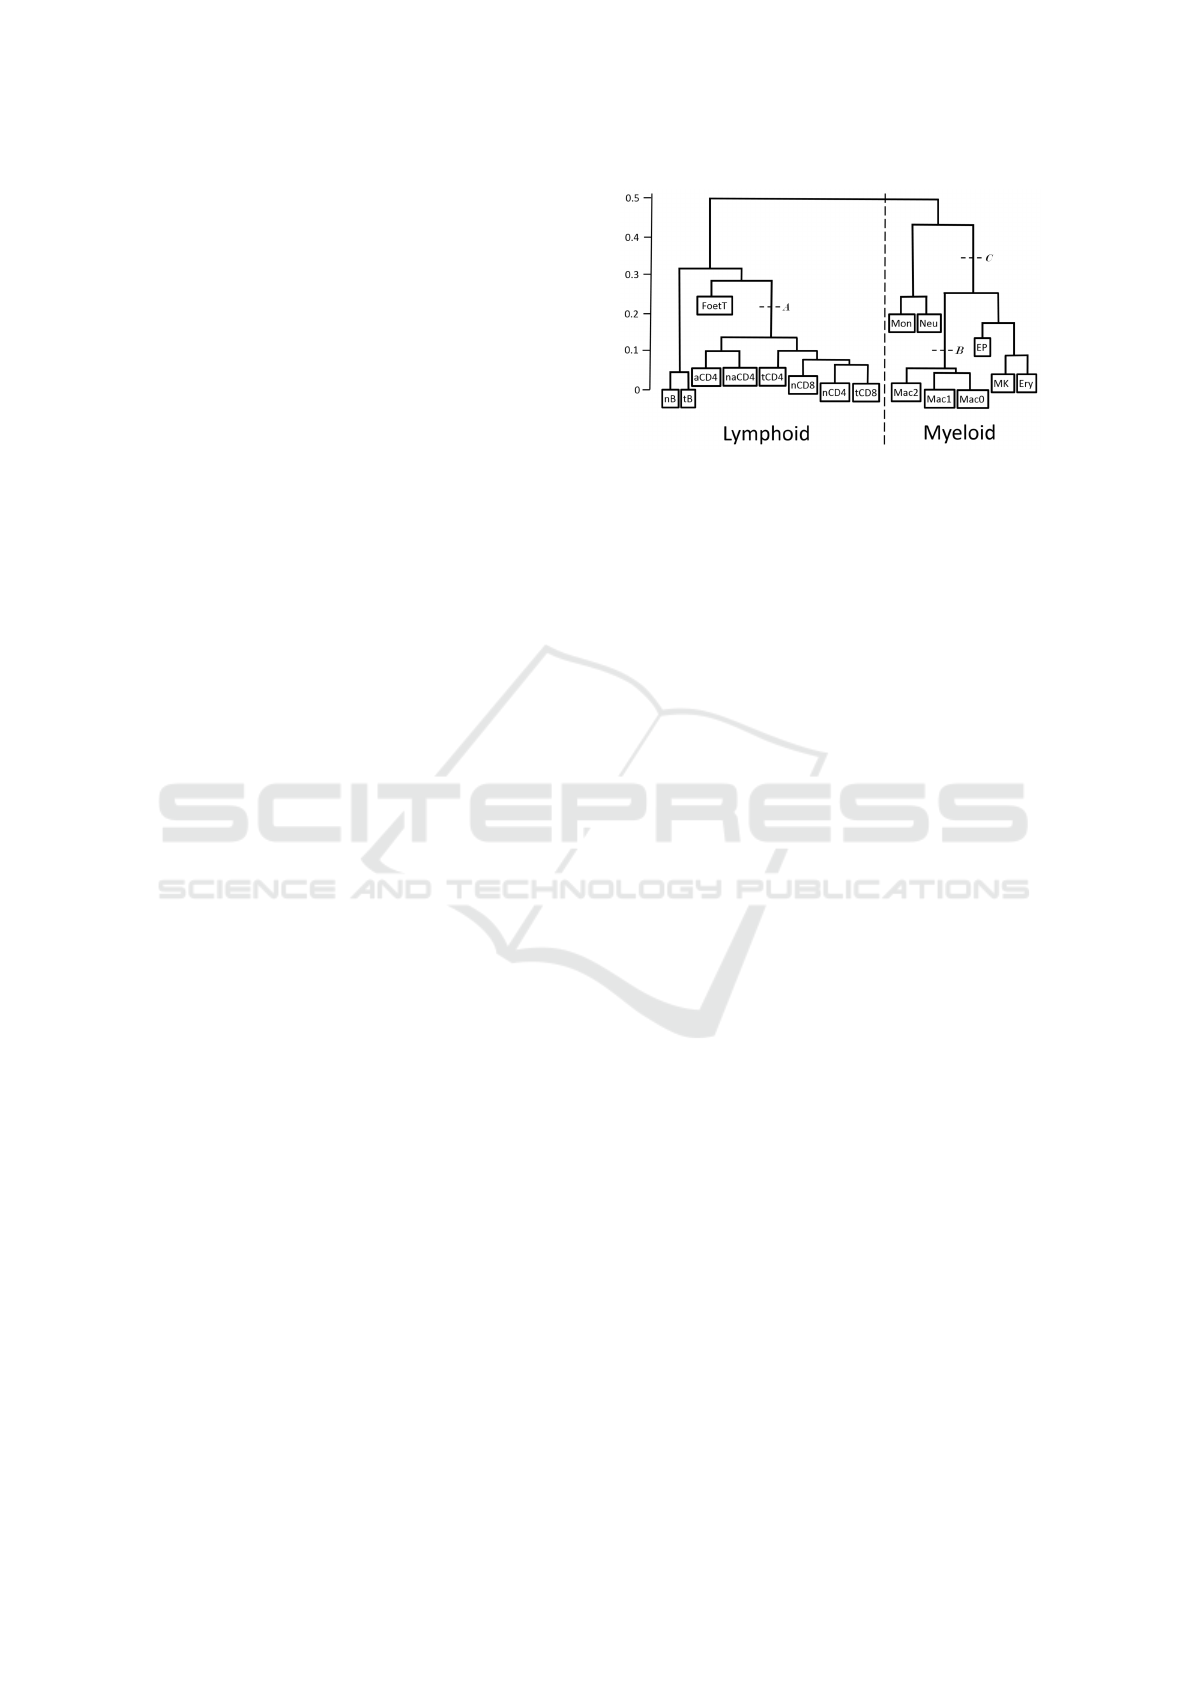
Figure 1: Haematopoietic tree of 17 cell types. The contin-
uous distances Dcont range from 0 to 1 and are proportional
to distances in the tree according to the scale shown. Binary
distances Db are defined to be equal to 0 for Dcont < 0.5
and equal to 1 otherwise. Dt is defined according to cell
subtypes – it is equal to 1 between lymphoid and myeloid
types and equal to 0 between cells of the same subtype. Ad-
ditionally binary distances DA, DB and DC were used to test
separability of subtrees ’cut’ correspondingly at points A, B
and C.
3.3 Discrimination Between Different
Cell Types
To estimate the discriminatory power of metrics
from Base34 and of 4 ’counting’ metrics V, E, E9
and E17 we constructed linear regression models
for the prediction of cell distances on the basis of
the values of these metrics. We also applied step-
wise regression (using Akaike information criterion
(Sakamoto et al., 1986) and its implementation in AIC
function, which is available in language R core li-
brary) to select the most discriminatory metrics from
Base34. As statistically significant were identified
11 metrics: CC8+E, antiparallelEdges, CCaverE,
CCmaxE, BCaverE, SCmaxE, CL3V, CL4V, CL5V,
SC4E, BC8+E with the first 7 being significant for all
four distances Dcont, Db, Dt and D4 (see Figures 2
and 3). The set of these 11 metrics is called Base11.
Some interesting features of this set are the fact
that sizes of connected components have compara-
tively high significance, high significance has also the
number of components of size 8 or more (this is also
partially implied by results from Section 4). The num-
ber of cliques is also important, the dominance of
CL3V could be explained by the overall larger num-
ber of them. The importance of antiparallelEdges
probably could be explained by its ’counting’ char-
acter, but potentially might be related also to gene
regulation, since such interactions are possible only
between ’bait’ regions, which, by definition, are asso-
ciated with genes.
The correlations between predictions of regres-
sion models and the actual distances are summarised
Graph-based Characterisations of Cell Types and Functionally Related Modules in Promoter Capture Hi-C Data
81
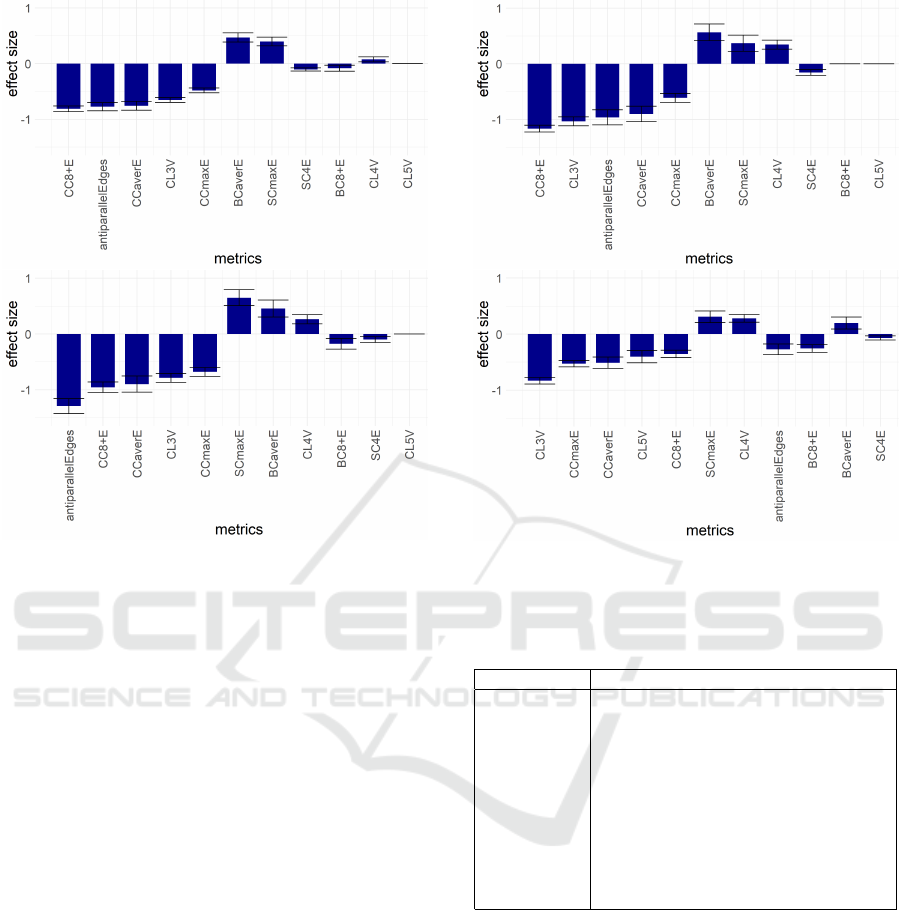
Figure 2: The most discriminating metrics for cell type dis-
tances Dcont (top) and Db (bottom). The relative discrimi-
natory power of any pair of metrics is proportional to the ra-
tio of their absolute values of ”effect size” shown on y axis.
The exact ranges of ”effect size” are data-dependent and
are not directly comparable between different cell type dis-
tances, and (even more notably) between full genome and
single chromosome metrics data.
in Table 1. To some extent, it shows the suitability
of different metrics for discrimination between cell
types, although the obtained correlation values are
likely influenced by over-fitting and should be treated
with caution (although the results are very stable –
10 repeated bootstrapping tests with training sets con-
taining 75% of data produced at most 2% deviations).
Of larger interest is the comparative performance of
different metrics in cell type differentiation. Good
performance of ’counting’ metrics V, E, E9 and E17
is not surprising, since one should expect that more
closely related cell types will share more common Hi-
C interactions. Nevertheless, they alone do not out-
perform sets of Base metrics (apart from E9, which
counts the interactions that are common to no more
than 50% of cell types, and thus is dataset depen-
dent). Surprising, however, is the low performance
of these metrics for identification of select clusters
of closely related cell types (distances DA, DB and
DC). Overall, however, these results confirm that the
Base topology-based metrics, particularly the Base11
subset, perform well in lineage-based identification of
blood cell types in chromatin interaction data.
Figure 3: The most discriminating for cell type distances Dt
(top) and D4 (bottom).
Table 1: Pearson correlations between cell type distances
and predictions of their values.
Dcont Db Dt D4 DA D8 DC
Base57 0.79 0.68 0.67 0.72 0.77 0.44 0.63
Base34 0.78 0.67 0.66 0.71 0.76 0.42 0.62
Base11 0.78 0.67 0.66 0.70 0.74 0.40 0.58
Base11 + V 0.81 0.69 0.67 0.73 0.75 0.46 0.62
Base11 + E 0.80 0.68 0.67 0.72 0.75 0.45 0.61
Base11 + E17 0.80 0.68 0.67 0.72 0.75 0.45 0.61
Base11 + E9 0.87 0.72 0.73 0.76 0.75 0.55 0.71
V 0.67 0.57 0.56 0.55 0.47 0.36 0.45
E 0.78 0.66 0.65 0.70 0.68 0.29 0.25
E17 0.78 0.66 0.65 0.70 0.68 0.29 0.25
E9 0.86 0.71 0.72 0.75 0.69 0.33 0.31
An interesting feature can be observed from com-
paring the performance of Base11 on different chro-
mosomes (shown by heatmaps in Figure 4). The chro-
mosomes are grouped in a number of similarity clus-
ters, which is not the case for randomised data. The
clusters, however, strongly depend on the used cell
type distance (although there are few stably related
pairs of chromosomes as well as few persistent out-
liers).
For Dcont distance Figure 5 shows the statistical
significance of Base11 metrics for which it correlates
well with metrics significance for the whole chromo-
some set.
BIOINFORMATICS 2019 - 10th International Conference on Bioinformatics Models, Methods and Algorithms
82
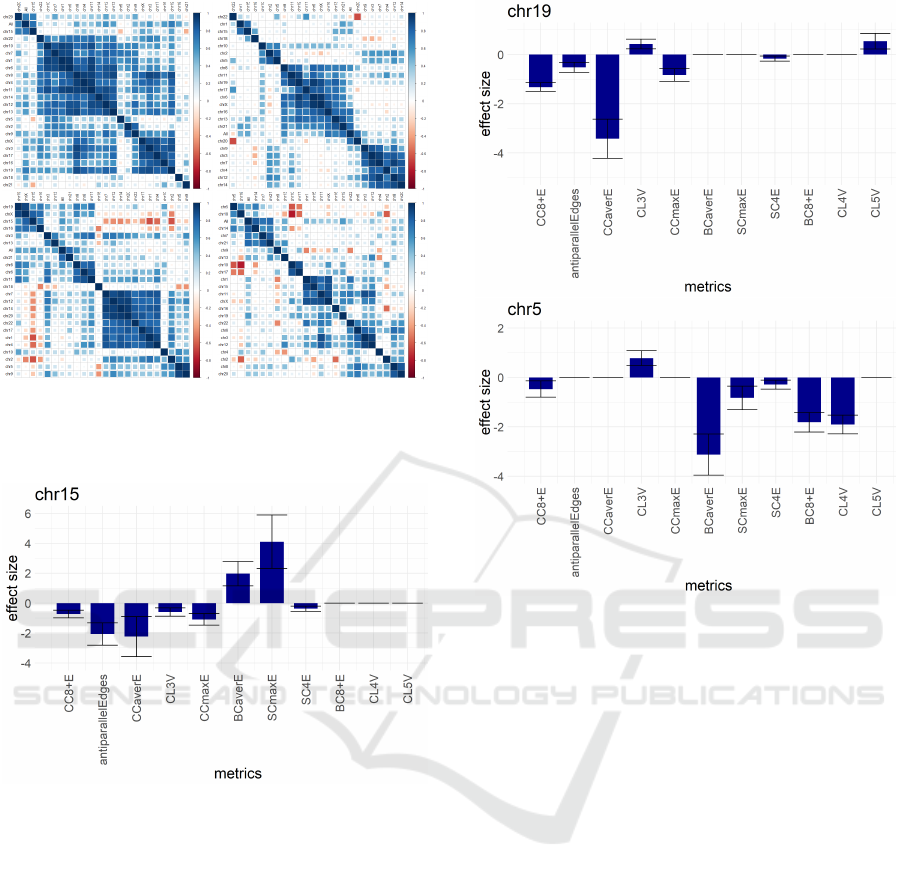
Figure 4: Heatmaps of similarity between pairs of chromo-
somes using the four metrics giving the best predictions of
cell type distances Dcont (top left), Db (top right), Dt (bot-
tom left) and D4 (bottom right).
Figure 5: Statistical significance of metrics for Dcont dis-
tance and chromosome 15, which well correlate with met-
rics for the whole chromosome set.
Figure 6 illustrates examples of metrics statistical
significance of chromosome 19 (belonging to another
well correlating group) and chromosome 5 (an ’out-
lier’). Notably that Base11 predictions for Dcont dis-
tance based solely on data from chromosomes 15, 19
and 5 gives correspondingly correlations 0.85, 0.88
and 0.91. The fact that these values exceed overall
value of 0.78 is the most likely result of larger over-
fitting effect due to smaller datasets; however, these
numbers indicate that there are no strictly ’dominant’
chromosomes that could be used for cell type differ-
entiation. The exact reasons why such clusters of
chromosomes are formed remain unclear, but might
be the result of some more complex dependencies be-
tween Base11 metrics, which can not be detected by
regression models.
Figure 6: Statistical significance of metrics for Dcont dis-
tance and chromosomes 19 (belongs to a block of 6 corre-
lating chromosomes), and an ’outlier’ chromosome 5.
4 THE STRUCTURE OF HI-C
INTERACTION GRAPHS
In this section we more closely explore the struc-
ture of graphs describing Hi-C interactions. The ini-
tial graphs (see Section 2) are defined separately for
each of the 23 chromosomes (chromosome Y is omit-
ted due to a very low number of interactions) and
for each of the 17 cell types. Each of these graphs
can be considered as a subgraph of a ’complete net-
work’ for a specific chromosome, with vertices cor-
responding to chromosome segments between which
interactions have been measured and (for simplicity)
with isolated (non-interacting) vertices removed for
a graph corresponding to a specific cell type. The
number of vertices for chromosome and cell type spe-
cific graphs ranges between 773 (chromosome 22)
and 11118 (chromosome 1) and the number of edges
on average is slightly less than the number of vertices
multiplied by 2. The vertices are denoted by the mid-
dle genomic coordinate of their respective segment
mapped on a specific chromosome, and the gene an-
notations used are from the original data.
Graph-based Characterisations of Cell Types and Functionally Related Modules in Promoter Capture Hi-C Data
83
The questions we are trying to answer here are: 1)
what is a ’typical structure’ of Hi-C interaction graph?
2) how do the structures of graphs change if we con-
sider common subgraphs for given sets of cell types?
3) can we assign some biological significance to the
structural elements or features of these graphs?
4.1 General Topological Properties of
Interaction Graphs
Since the data that we have used are focused par-
ticularly on small-scale interactions, it is not unex-
pected that our interaction graphs separate easily into
connected components. Approximately 29% of these
contain just 2 vertices (isolated edges or cycles of
length 2), there are comparatively few components of
size 3-7 (29%) and the remaining 45% contain 8 or
more vertices. Very few of them are comparatively
large (up to 150 vertices), with a typical range be-
ing 10-70 vertices and an average size being 32 ver-
tices. A sample distribution of connected compo-
nent sizes is shown in Figure 7. To investigate how
these components change for different cell types we
further consider components of 10 or more vertices
(although chosen somewhat arbitrary, this threshold
seems well suited to largely reduce random ’noise’
in graphs). The average number of such components
in each chromosome and cell type-specific graph is
around 50.
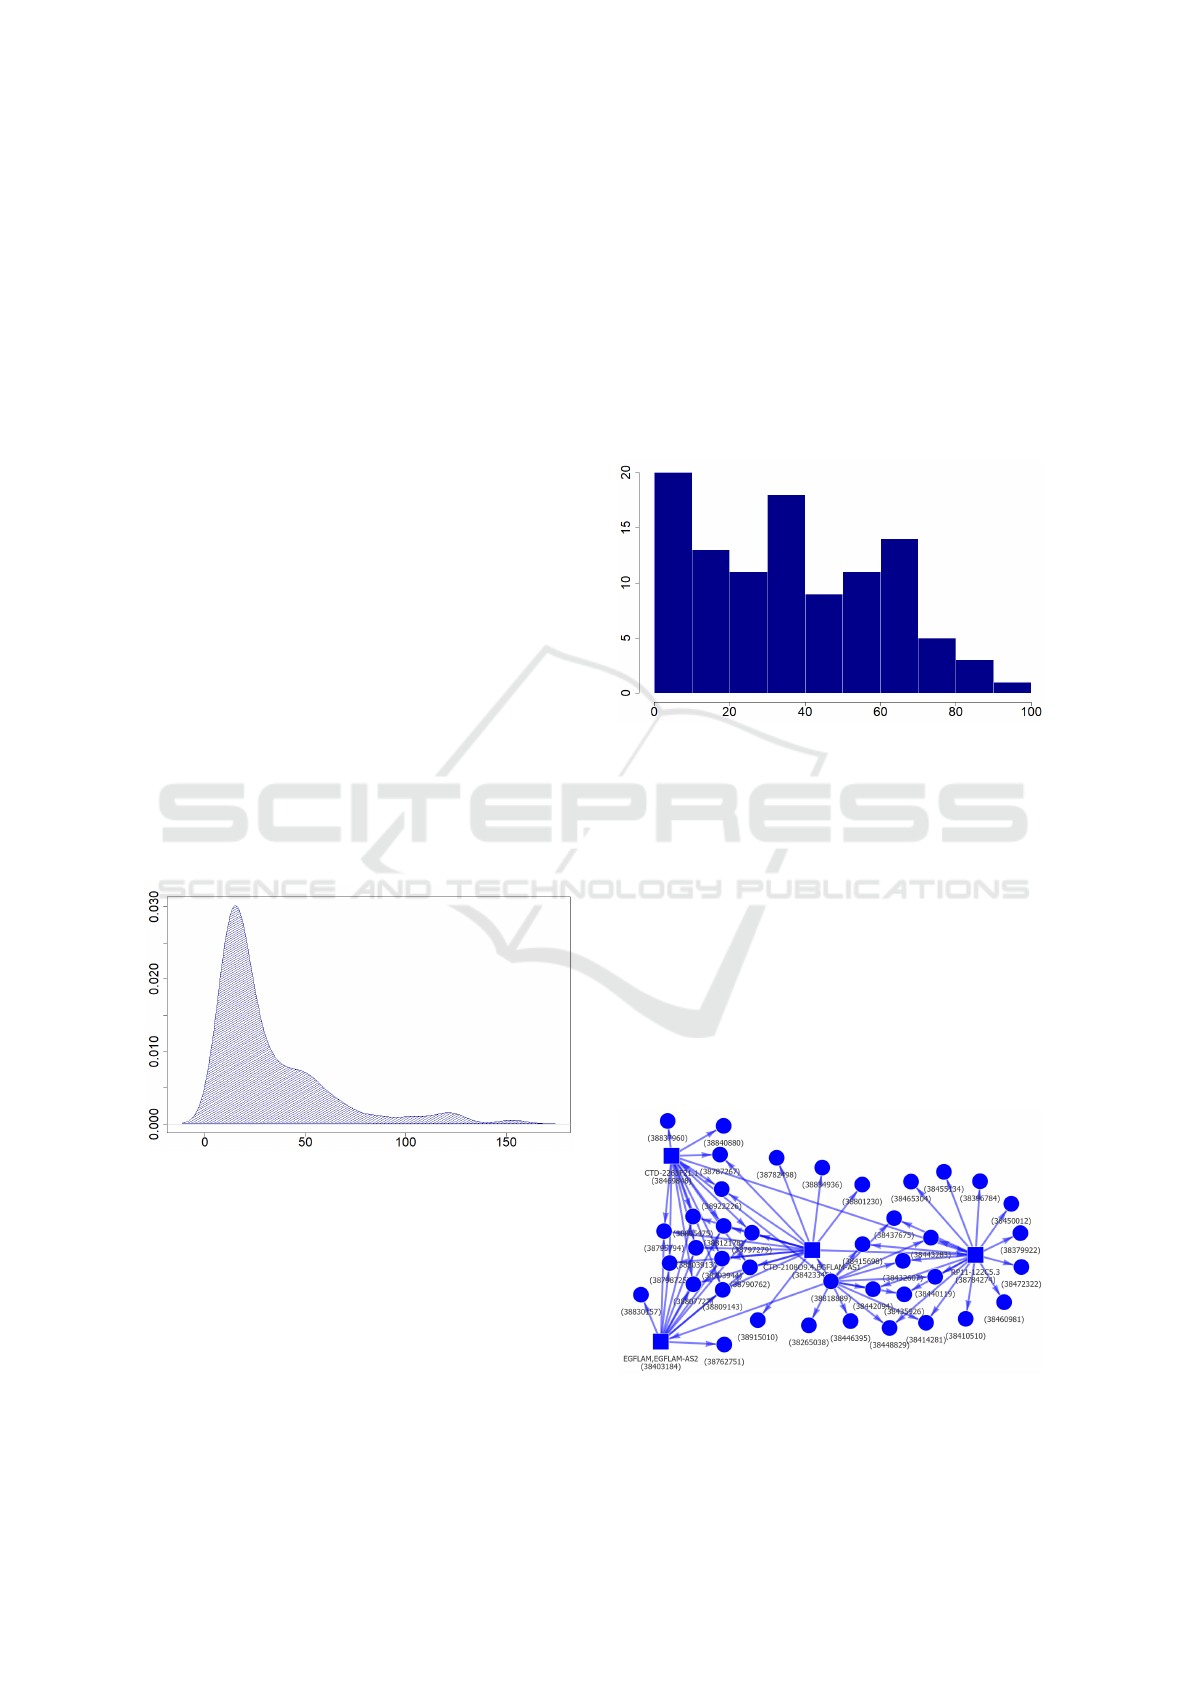
Figure 7: The distribution of sizes of connected components
for chromosome 1. Component size is shown on the hori-
zontal axis.
More interesting is the fact that connected com-
ponents have a tendency to remain largely unchanged
when shared by a number of different (component-
specific) cell types and to be largely (or completely)
absent in others. A typical reduction of sizes of com-
ponents for chromosome and cell type-specific graph,
when only parts of components shared by all cell
types are considered, is shown in Figure 8 for chro-
mosome 5 and Mon cell type. The proportion of com-
ponents that are shared by Mon and at least one other
cell type and that are almost absent in at least one
other cell type is around 25%. Comparatively few
(around 5%) components remain little changed in all
of the cell types. The remaining 70% could be further
subdivided in not very strictly separated subclasses,
ranging from ones for which part of the component
shows good cell type specificity, to quite noisy ones
(full statistics is lacking, but manual inspections indi-
cate that the first of these behaviours tends to be more
common).
Figure 8: The reduction of sizes of connected components
(with 10 or more vertices) for chromosome 5 and Mon cell
type when the component is replaced by a subgraph shared
by all 17 cell types. The remaining component size (in %)
is shown on the horizontal axis and the percentage of com-
ponents on the vertical axis.
As an example, the following figures illustrate a
connected component of chromosome 5 and cell type
EP. The complete initial component is shown in Fig-
ure 9. Figure 9 shows the parts of the component that
are shared by Mac0, Mac1 and Mac2 – although a
number of interactions and nodes are lost the topo-
logical structure remains mostly preserved; and also
additionally is shared by cell type tCD8, in which case
only a few vertices and interactions remain. The com-
ponent is completely absent in cell type Neu.
Figure 9: A connected component of Hi-C interactions in
chromosome 5 and cell type EP.
BIOINFORMATICS 2019 - 10th International Conference on Bioinformatics Models, Methods and Algorithms
84
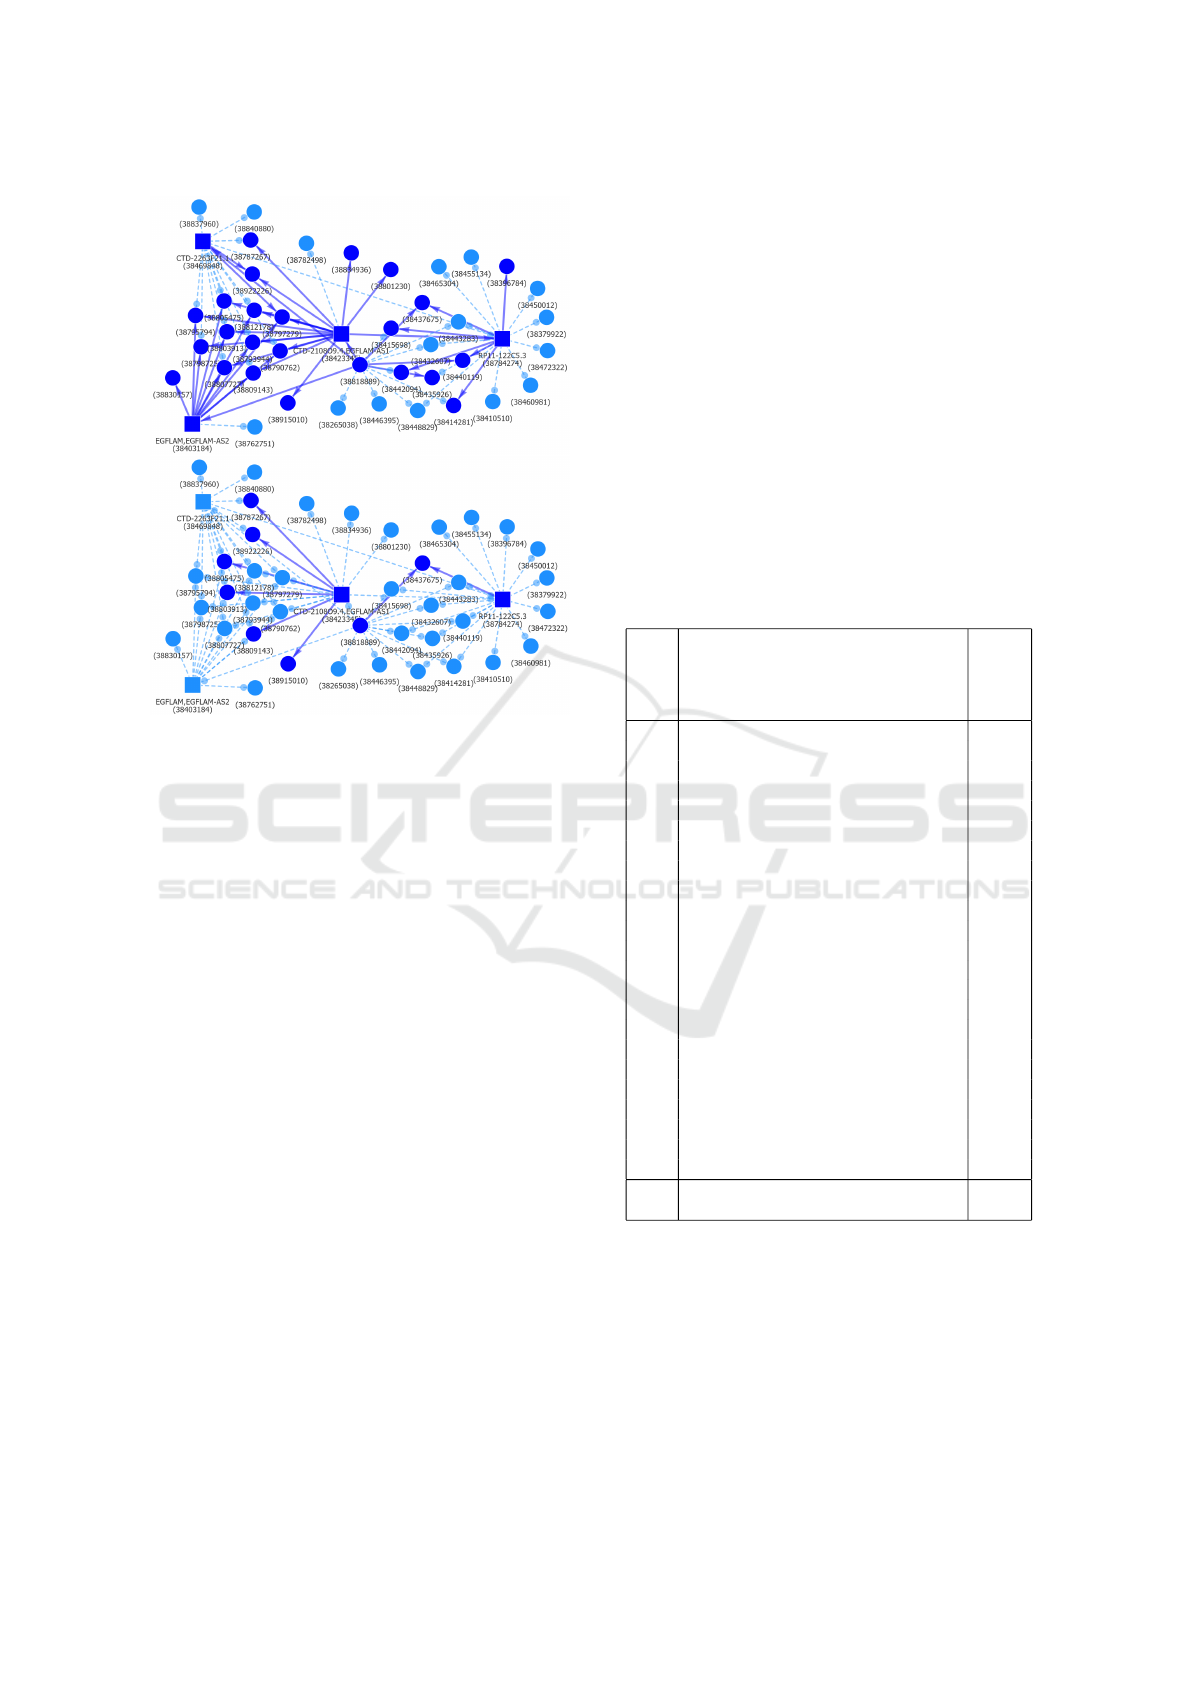
Figure 10: The parts of EP Hi-C interactions component
shared with cell types Mac0, Mac1 and Mac2 (top) and ad-
ditionally with tCD8 (bottom). There are no common inter-
actions shared with cell type Neu.
4.2 Biological Interpretation of Hi-C
Interaction Components
The observation that connected components in Hi-C
interaction graphs are either largely shared by two
cell types, or are present in one of them and largely
absent in another strongly suggest that they have bi-
ological roles. These, however, might differ between
the components and the very large number of these
make comprehensive analysis practically infeasible.
Still, we have performed limited analyses that con-
firm a strong relation of a component structure with
known biological interactions and we have explored
several illustrative components in more detail.
In order to ascertain whether the clusters previ-
ously obtained by linking bait-to-bait and bait-to-end
interactions contained likely candidates for function-
ally related gene modules we first chose a sequence
of related cell types from the myeloid haematopoietic
lineage to examine for cell type-specific chromatin
architecture. Starting from a large pool of common
connected components for resting Mac0 and inflam-
matory macrophages Mac1, we sequentially added
more cell types to the selection criteria – alternatively
activated macrophages Mac2, monocytes Mon, neu-
trophils Neu and endothelial precursors EP – to nar-
row the range of clusters and establish the specificity
of graph components lost at each step.
The connected components were then assessed for
the proportion of nodes lost and grouped according
to their degree of preservation along the course of
cell type addition, from well-preserved (75-100% of
nodes in common between all cell types) to entirely
lost (no nodes in common between all cell types) with
several groups in between (Table 2). The majority of
components found tended to be highly specific, show-
ing 0-25% retention in the final set of linked nodes
and edges – however, the most specific components
also tended to have the smallest number of nodes.
Table 2: Macrophage-specific graph component retention
in myeloid cells and endothelial progenitors after sequential
addition of cell types. n – a number of graph components, n
e
- a number of graph components containing over 20 nodes
initially.
Chr
75% −100%
retained, n(n
e
)
50% −75%
retained, n(n
e
)
25% −50%
retained, n(n
e
)
0% −25%
retained, n(n
e
)
0%
retained, n(n
e
)
Total, n(n
e
)
1 23(5) 15(10) 45(36) 39(29) 111(14) 233(94)
2 14(1) 12(10) 36(31) 38(29) 96(17) 196(88)
3 13(1) 9(4) 34(24) 29(26) 83(11) 168(66)
4 7(3) 10(5) 15(11) 24(17) 80(14) 136(50)
5 9(3) 11(5) 30(25) 17(15) 80(8) 147(56)
6 7(2) 16(10) 26(22) 20(15) 79(8) 148(57)
7 11(3) 13(6) 20(16) 22(21) 84(10) 150(56)
8 6(0) 13(4) 14(10) 15(12) 73(13) 121(39)
9 7(0) 13(7) 16(12) 19(16) 65(8) 120(43)
10 17(3) 9(5) 15(12) 26(24) 65(10) 132(54)
11 11(2) 18(8) 29(19) 28(22) 67(3) 153(54)
12 8(0) 13(7) 24(17) 12(11) 87(13) 144(48)
13 7(0) 3(1) 11(8) 13(11) 31(5) 65(25)
14 9(2) 8(4) 12(9) 12(5) 62(9) 103(29)
15 11(0) 8(5) 19(9) 17(13) 68(3) 123(30)
16 7(1) 9(8) 18(6) 8(5) 47(4) 89(24)
17 10(1) 18(6) 24(18) 21(19) 67(3) 140(47)
18 2(0) 5(1) 13(9) 10(4) 38(9) 68(23)
19 18(1) 16(7) 18(7) 6(2) 48(0) 106(17)
20 10(1) 8(4) 12(10) 7(5) 38(5) 75(25)
21 4(0) 2(1) 5(4) 5(3) 24(4) 40(12)
22 6(0) 5(3) 9(4) 11(7) 34(3) 65(17)
X 4(1) 16(7) 20(13) 14(11) 66(2) 120(34)
Total 221
(30)
250
(128)
465
(332)
413
(322)
1493
(176)
2842
(988)
After collecting data about node retention, the
largest components showing high (75-100%) or low
(0-25%) retention in chromosomes of interest ac-
cording to our previous graph analysis (chromosomes
5, 9, 14, 15 and 19) were analysed for enrichment
with registered transcription factor protein-protein in-
teractions, known transcription factor binding sites,
co-expressed transcription factors and binding mo-
tifs with the Enrichr web tool (Chen et al., 2013;
Graph-based Characterisations of Cell Types and Functionally Related Modules in Promoter Capture Hi-C Data
85
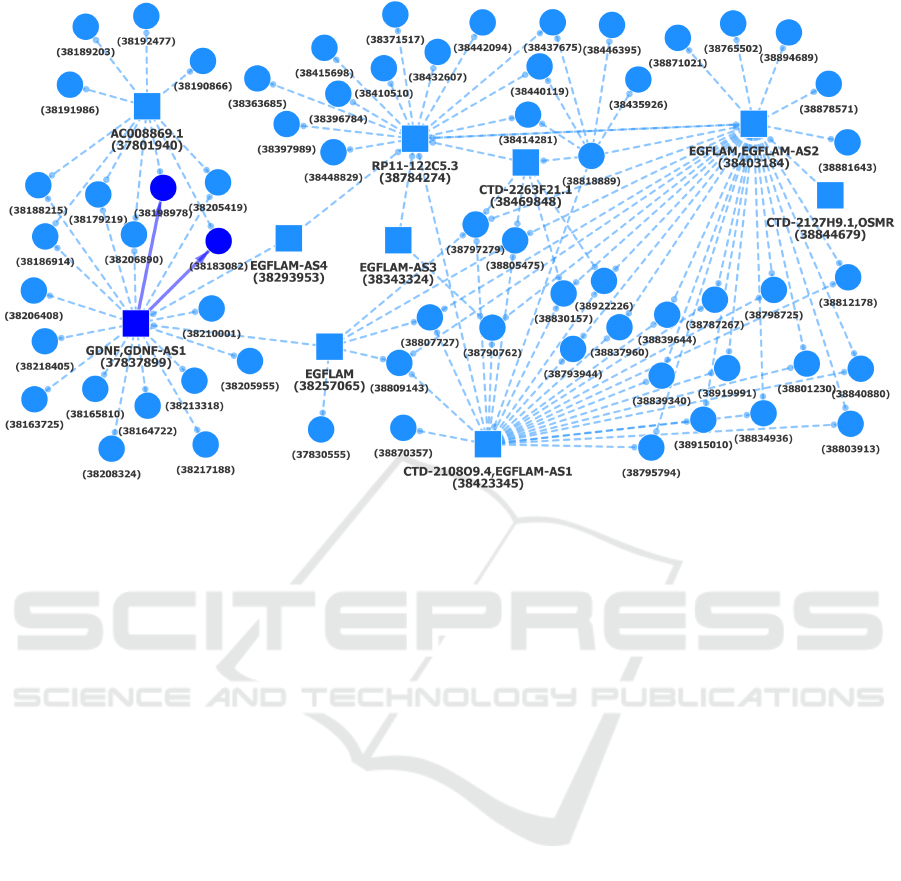
Figure 11: A component of Hi-C interactions shared by cell types Mac0, Mac1 and Mac2, Mon, Neu and EP. The initial larger
component, shown with dashed lines, is present in Mac0.
Kuleshow et al., 2016).
The analysed lists featured between 6 and 200
genes depending on component size. The analy-
sis uncovered a variety of transcription factors that
associated with different components, including an
array of broadly tissue macrophage-associated fac-
tors such as STAT5, GATA6, PPARγ and MAF
(Lavin et al., 2016) as well as more specific factors
found primarily in monocyte-derived macrophages
– JUN, JUNB, MAFK, EGR3 and others (Ramirez
et al., 2017), and even lipopolysaccharide treatment-
induced transcription factors including BCL3, USF1
and SREBF2 signifying inflammatory macrophage
activity or interleukin-4 and 13 activated factors such
as MITF (Das et al., 2018). These specific factors
were primarily, but not exclusively found in compo-
nents with very little retention across all cell types
analysed, such as one particular component which
showed a particular enrichment for STAT5 binding
during analysis and was completely lost when search-
ing for common chromatin conformations with en-
dothelial precursors (Figure 11).
The pattern previously described partly holds for
better-retained components as well, which contain
genes associated with transcription factors significant
for other cell types, notably monocytes with GATA2,
CEBPB and KLF4, or more basal hematopoietic tran-
scription factors like RUNX1 (Zhu et al., 2016), or
even FLI1 which is known to negatively regulate
myeloid differentiation and function as a master con-
troller transcription factor in endothelial cells (Zhu
et al., 2016; Kanki et al., 2017). These compo-
nents particularly tend to taper off sharply in node
count when neutrophils and endothelial precursors
are included, such as one component associated with
GATA2 and CEBPB as well as less specific tran-
scription factors like CTCF and SIN3A, the for-
mer of which is a well-known insulator in vertebrate
genomes (Ong and Corces, 2014) and the latter an im-
portant factor in stem cell proliferation (Figure 11)
(McDonel et al., 2012).
Altogether the gene set enrichment analysis sup-
ports the hypothesis that the genes we have linked
together into connected components may form func-
tionally related modules, broadly fitting a loose model
of specificity applied through examining the overlap
between chromatin architectures of diverse cell types.
4.3 Software Availability
Web-based software components, developed
by the authors, for visualisation and explo-
ration of Hi-C interaction graphs is avail-
able at GitHub: https://github.com/IMCS-
Bioinformatics/HiCGraphAnalysis. It includes
the datasets of graphs used in this study, which
the users can replace with their own. The current
functionality is limited to the exploration of changes
in graph components being shared between different
subsets of cell types.
BIOINFORMATICS 2019 - 10th International Conference on Bioinformatics Models, Methods and Algorithms
86
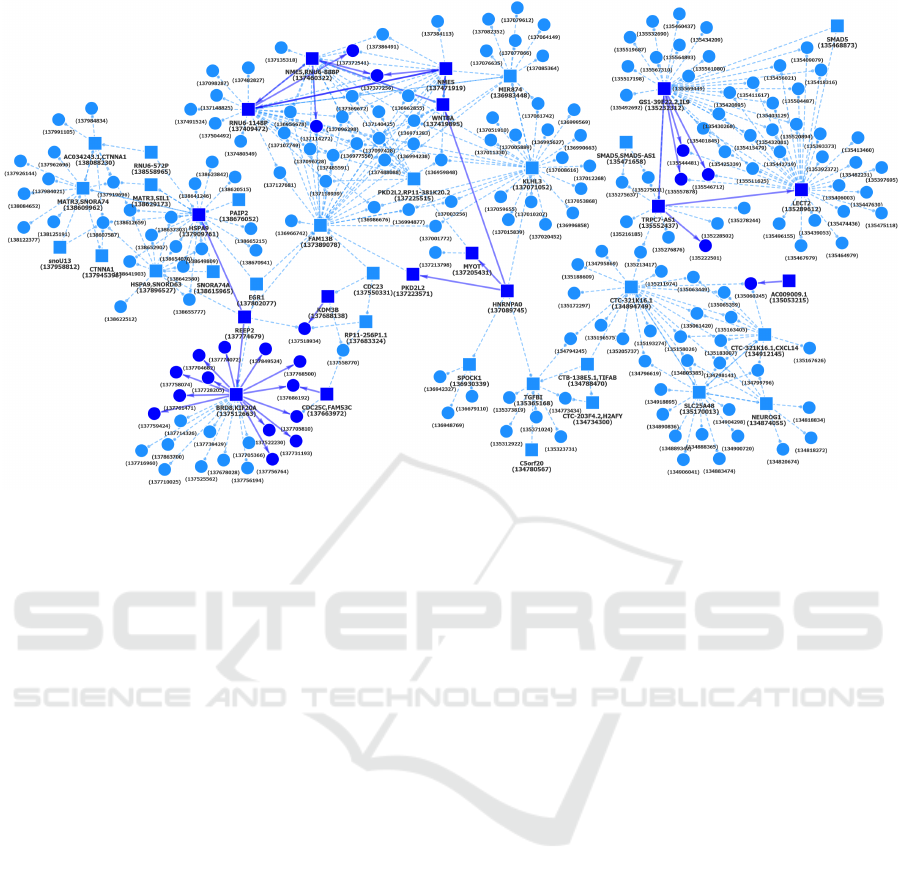
Figure 12: Another chromosome 5 component of Hi-C interactions shared by cell types Mac0, Mac1 and Mac2, Mon, Neu
and EP. The initial larger component, shown with dashed lines, is present in Mac0.
5 CONCLUSIONS
In this paper we have analysed the topological prop-
erties of Hi-C interaction graphs from two related,
but somewhat different perspectives: 1) are topo-
logical properties of these graphs alone able to dis-
tinguish between different haematopoietic cell types
and assign biologically meaningful distances between
them; 2) what is a typical structure of Hi-C interac-
tion graphs and can we assign some biological sig-
nificance to structural elements or features of these
graphs?
In general, we think that we have obtained af-
firmative answers to both these questions. Regard-
ing characterisation of interactions graphs in terms of
their topological properties we propose a set Base11
of 11 metrics based on graph topological features
that can be used to distinguish between different cell
types for 7 different distance measures that we have
tested. Although the Base11 metrics are related to
graph properties, which unlikely could be directly as-
sociated with concrete biological mechanisms, they
seem very appropriate for characterisation of interac-
tions that are specific for a particular cell type. If dis-
crimination between the cell types is the main priority
then Base11 can be used in combination with ’count-
ing metrics’ V, E, E9 and E17 to obtain correlations
between the distance-defined and predicted values of
up to 0.87. Although the usefulness of these ’counting
metrics’ can be anticipated since one should expect
that more closely related cell types will share more
common interactions, they perform much better when
used in combination with Base11, and an interesting
non-obvious feature is their linearity, i.e. the fact that
they perform well in linear regression models.
The observed clustering of chromosomes accord-
ing to regression coefficients that are assigned to dif-
ferent Base11 metrics is an interesting feature, in par-
ticular since such clustering is observed for different
cell type distances D, but the clusters are different
for different distances D. The exact reasons why such
clusters of chromosomes are formed remain unclear,
but a probable explanation is that they could be the re-
sult of some complex (interaction graph-specific) de-
pendencies between Base11 metrics, or biological re-
lations between graph components (which is not taken
into account by the current topological approach).
The analysis of topology of Hi-C interaction
graphs showed that they decompose in comparatively
small connected components, which can be either par-
tially shared by all cell types, or can be pronouncedly
cell type-specific – largely conserved in a specific set
of cell types and practically absent in others. A de-
tailed inspection of two of such components showed
that they can be well explained by biological fac-
tors/properties that are shared by some of the cell
types, but not all of them.
Regarding further developments, it would be very
Graph-based Characterisations of Cell Types and Functionally Related Modules in Promoter Capture Hi-C Data
87

interesting to test our approach on another genome-
wide PCHi-C interaction dataset, in order to assess
both: 1) the applicability of Base11 metrics for dis-
crimination between cell types, other than blood cells
studied here; and 2) to analyse the similarity of topo-
logical structure and component behaviour of interac-
tion graphs in order to assess how the properties ob-
served for haematopoietic cells generalises to other
cell types. Unfortunately, as far as we know, an-
other appropriate PCHi-C dataset covering multiple
cell types has yet to become available.
There is also a good potential to further extend
the graph topology based approach that we have used
here. It has been quite successful to show that topo-
logical properties alone could be quite informative
for discrimination between different cell types and
also for assigning biological meaning to specific com-
ponents on interaction graphs. At the same time
some useful information in the current graph repre-
sentation is absent, notably, an edge in an interac-
tion graph might represent an interaction that forms
a well-defined loop on a chromosome (if the distance
between interaction segments is limited and there are
no intermediate interactions between them), or it can
represent a long range interaction with a far less ob-
vious biological role. We have plans to further de-
velop the mathematical formalism for description of
interaction graphs in order to incorporate and analyse
such features, although additional studies are needed
to determine the best way to achieve this.
ACKNOWLEDGEMENTS
The research was supported by ERDF project
1.1.1.1/16/A/135.
REFERENCES
Ay, F., Bailey, T., and Noble, W. (2014). Statistical con-
fidence estimation for Hi-C data reveals regulatory
chromatin contacts. Genome Research, 24(6):999–
1011.
Belton, J., McCord, R., et al. (2012). Hi-C: A com-
prehensive technique to capture the conformation of
genomes. Methods, 58(3):268–276. 3D chromatin ar-
chitecture.
Cairns, J., Freire-Pritchett, P., et al. (2016). CHiCAGO: ro-
bust detection of DNA looping interactions in capture
Hi-C data. Genome Biol, 17:127.
Celms, E., Cerans, K., et al. (2018). Application of graph
clustering and visualisation methods to analysis of
biomolecular data. Communications in Computer and
Information Science, 838:243–257.
Chen, E., Tan, C., et al. (2013). Enrichr: interactive and
collaborative html5 gene list enrichment analysis tool.
BMC Bioinformatics, 14:128.
Das, A., Yang, C., et al. (2018). High-resolution map-
ping and dynamics of the transcriptome, transcription
factors, and transcription co-factor networks in classi-
cally and alternatively activated macrophages. Front.
Immunol., 9:22.
Dekker, J., Rippe, K., et al. (2002). Capturing chromosome
conformation. Science, 295(5558):1306–1311.
DeMaere, M. and Darling, A. (2016). Deconvoluting sim-
ulated metagenomes: the performance of hard- and
soft- clustering algorithms applied to metagenomic
chromosome conformation capture (3C). PeerJ,
4:e2676.
Dryden, N., Broome, L., et al. (2014). Unbiased analysis of
potential targets of breast cancer susceptibility loci by
capture Hi-C. Genome Research, 24:1854–1868.
Forcato, M., Nicoletti, C., et al. (2017). Comparison of
computational methods for Hi-C data analysis. Nature
Methods, 14:679–685.
Guimaraes, J. and Zavolan, M. (2016). Patterns of riboso-
mal protein expression specify normal and malignant
human cells. Genome Biology, 17:236.
J
¨
ager, R., Migliorini, G., et al. (2015). Capture Hi-C iden-
tifies the chromatin interactome of colorectal cancer
risk loci. Nature Communications, 6(6178).
Javierre, B., Burren, O., et al. (2016). Lineage-specific
genome architecture links enhancers and non-coding
disease variants to target gene promoters. Cell,
167(5):1369–1384.
Kanki, Y., Nakaki, R., et al. (2017). Dynamically and epige-
netically coordinated GATA/ETS/SOX transcription
factor expression is indispensable for endothelial cell
differentiation. Nucleic Acids Research, 45(8):4344–
4358.
Kuleshow, M., Jones, M., et al. (2016). Enrichr: a compre-
hensive gene set enrichment analysis web server 2016
update. Nucleic Acids Research, 44:W90–W97.
Lajoie, B., Dekker, J., and Kaplan, N. (2015). The hitch-
hiker’s guide to Hi-C analysis: Practical guidelines.
Methods, 72:65–75.
Lavin, Y., Mortha, A., et al. (2016). Regulation of
macrophage development and function in peripheral
tissues. Nature Reviews Immunology, 15(12):731–
744.
Lieberman-Aiden, E. van Berkum, E. et al. (2009). Com-
prehensive mapping of long-range interactions reveals
folding principles of the human genome. Science,
326(5950):289–293.
Martin, P., McGovern, A., et al. (2015). Capture Hi-C re-
veals novel candidate genes and complex long-range
interactions with related autoimmune risk loci. Nature
Communications, 6(10069).
McDonel, P., Demmers, J., et al. (2012). Sin3a is essential
for the genome integrity and viability of pluripotent
cells. Dev. Biol., 363(1):62–73.
Mifsud, B., Tavares-Cadete, F., et al. (2015). Mapping long-
range promoter contacts in human cells with high-
BIOINFORMATICS 2019 - 10th International Conference on Bioinformatics Models, Methods and Algorithms
88

resolution capture Hi-C. Nature Genetics, 47:598–
606.
Montefiori, L., Sobreira, D., et al. (2018). A promoter inter-
action map for cardiovascular disease genetics. Elife,
7(e35788).
Ong, C. and Corces, V. (2014). CTCF: An architectural
protein bridging genome topology and function. Nat.
Rev. Genet., 15(4):234–246.
Quadrini, R. and Emanuela, M. (2018). Loop-loop interac-
tion metrics on RNA secondary structures with pseu-
doknots. In Proceedings of the 11th International
Joint Conference on Biomedical Engineering Systems
and Technologies - Volume 3: BIOINFORMATICS,
(BIOSTEC 2018), pages 29–37.
Ramirez, R., Al-Ali, N., et al. (2017). Dynamic gene regula-
tory networks of human myeloid differentiation. Cell
Systems, 4:416–429.
Sakamoto, Y., Ishiguro, M., and Kitagawa, G. (1986).
Akaike Information Criterion Statistics. D. Reidel
Publishing Company.
Schulz, T., Stoye, J., and Doerr, D. (2018). GraphTeams:
a method for discovering spatial gene clusters in Hi-C
sequencing data. BMC Genomics, 19(5):308.
Siahpirani, A., Ay, F., and Roy, S. (2016). A multi-task
graph-clustering approach for chromosome conforma-
tion capture data sets identifies conserved modules of
chromosomal interactions. Genome Biol., 17:114.
Viksna, J., Gilbert, D., and Torrance, G. (2004). Domain
discovery method for topological profile searches in
protein structures. Genome Informatics, 15:72–81.
Wang, H., Duggal, G., et al. (2013). Topological proper-
ties of chromosome conformation graphs reflect spa-
tial proximities within chromatin. In Proceedings of
the International Conference on Bioinformatics, Com-
putational Biology and Biomedical Informatics, pages
306–315.
Yaveroglu, O., Milenkovic, T., and Przulj, N. (2015).
Proper evaluation of alignment-free network compar-
ison methods. Bioinformatics, 31(16):2697–2704.
Zhang, Y., An, L., et al. (2018). Enhancing Hi-C data res-
olution with deep convolutional neural network HiC-
Plus. Nature Communications, 9(1):750.
Zhu, Y., Thomas, G., and Hedrick, C. (2016). Transcrip-
tional control of monocyte development. Arterioscler.
Thromb. Vasc. Biol., 36:1722–1733.
Graph-based Characterisations of Cell Types and Functionally Related Modules in Promoter Capture Hi-C Data
89
