
Usability Study of a Tool for Patients’ Access Control to Their Health
Data
Sandra Reis
1,2
, Ana Ferreira
1,3
, Pedro Vieira-Marques
1,3
and Ricardo Cruz-Correia
1,2,3
1
Faculdade de Medicina da Universidade do Porto – FMUP, Porto, Portugal
2
HealthySystems - HLTSYS, Lda, Porto, Portugal
3
Center for Research in Health Technologies and Information Systems – CINTESIS, Porto, Portugal
Keywords:
Patient Empowerment, Access Control, Audit Trail, GDPR, Prototype, Usability, SUS.
Abstract:
Considering the need that is expected for the institutions to be compliant with the new legislation we intended
to create a tool (MyRegister) that will allow patients to know which professionals accessed their health data
in healthcare institutions where they have had previous contact. Before development we decided to create
a functional prototype to validate the user interface of the tool with real users. We created an evaluation
instrument consisting of 4 tasks and a SUS questionnaire that allowed us to evaluate the MyRegister interface
of the prototype by the participants. The results of the evaluation of the prototype allowed us to identify
some of the major usability problems of the interface, while the SUS score of 79.5 in 100 is a result that
shows good usability. Regarding the performed tasks, all were completed by the participants but not all of
them answered correctly to the questions asked. After correcting the problems found and implementing the
suggestions of the participants that we consider permissible to include, we intend to continue this project with
the development of the tool and test its usability as well as user experience in real environments with a wider
and more heterogeneous sample.
1 INTRODUCTION
Every day health professionals are in contact with the
information systems that keep the personal informa-
tion of each of the patients of the health institution.
Personal Health Information (PHI) of patients can be
viewed, created, edited and even eliminated without
the patient’s knowledge and the disclosing of purpose
of that access by the professional. Data protection
legislation and health data such as Health Insurance
Portability and Accountability (HIPAA), the United
States of America legislation and more recently Gen-
eral Data Protection Regulation (GDPR), the Euro-
pean Union legislation are intended to ensure that pa-
tients have access to information about who accesses
their PHI because it is a patient’s right (Tovino, 2016;
Jornal Oficial da Uni
˜
ao Europeia, 2016). However
nowadays it is very difficult for the patient to have ac-
cess to this information, it is a time consuming and
complicated process and is often difficult to obtain
due to the lack of proper control mechanisms. In order
to comply with the European requirements of the leg-
islation in force, GDPR, institutions have to change
some of their usual behavior, namely auditing require-
ments (Gonc¸alves-Ferreira et al., 2018).
1.1 Audit Trails
The records that show who accessed, what, when
and what operations were made are called audit-trails
(Cruz-Correia et al., 2013). Knowing what health pro-
fessionals have accessed regarding the health data of
patients may be challenging, even when institutions’
systems keep the access logs of health professionals.
According to (Gonc¸alves-Ferreira et al., 2018) Por-
tuguese hospitals rely on different systems, promot-
ing a huge heterogeneity, and often the access logs
are kept in each system and not in one single sys-
tem, making it difficult for institutions to integrate
and show this information. Audit trail systems can
help institutions to be compliant with GDPR (Cruz-
Correia et al., 2013).
1.2 Patient Empowerment
When empowerment is in the health environment,
it focus on patient empowerment, and can be in-
terpreted as the activity of including the patient as
94
Reis, S., Ferreira, A., Vieira-Marques, P. and Cruz-Correia, R.
Usability Study of a Tool for Patients’ Access Control to Their Health Data.
DOI: 10.5220/0007391200940102
In Proceedings of the 12th International Joint Conference on Biomedical Engineering Systems and Technologies (BIOSTEC 2019), pages 94-102
ISBN: 978-989-758-353-7
Copyright
c
2019 by SCITEPRESS – Science and Technology Publications, Lda. All rights reserved
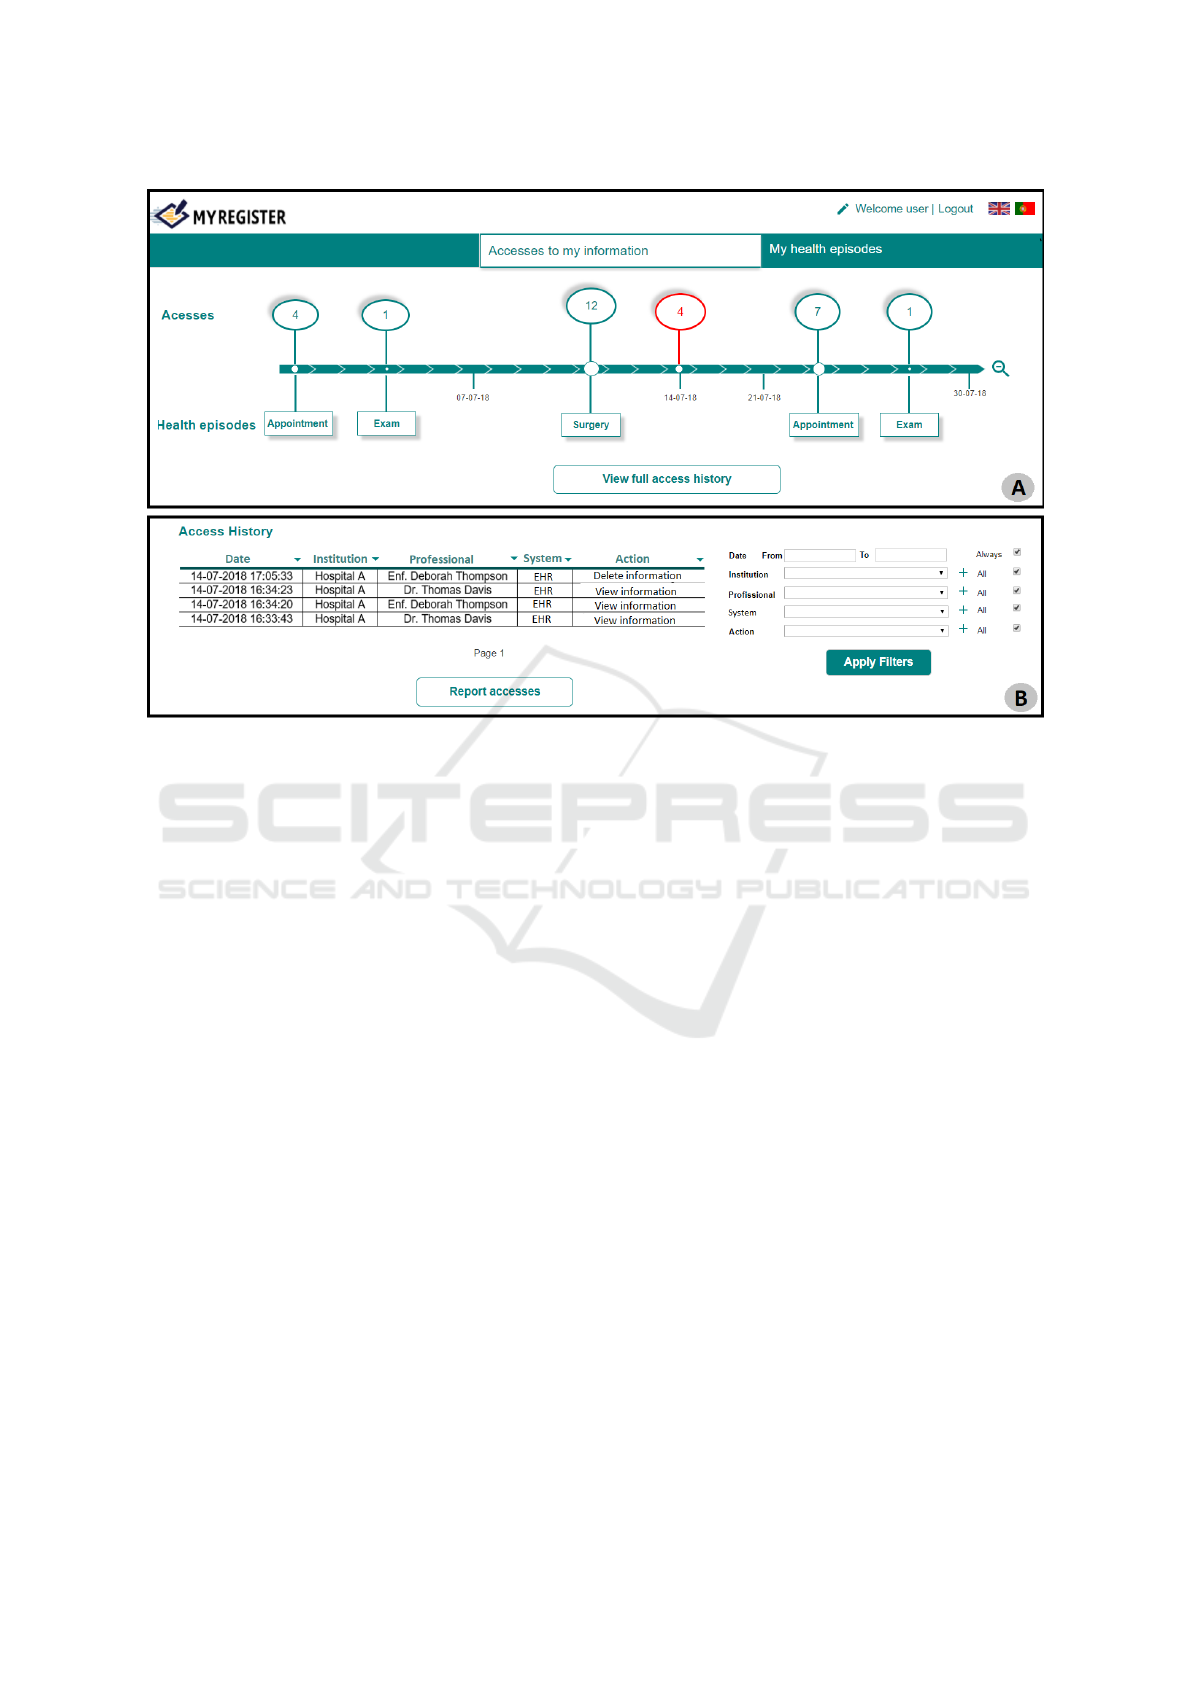
Figure 1: Prototype images: A: Homepage that allows the user to view the accesses made in the last month, year etc.; B:
Detailed page of accesses made on a specific day.
an autonomous and informed individual with cer-
tain responsibilities that allows him/her to participate
in his/her health decisions (Schulz and Nakamoto,
2013). According to (Schulz and Nakamoto, 2013)
when empowering a patient it is important also to take
into account their health literacy, if empowerment is
given to a patient with low health literacy their health
management can be detrimental to him/her. However
if this management is not given to the patient when
he/she is an individual with high health literacy the
result is a patient dependent on health professionals
when he/she could participate in his/her clinical deci-
sions and improve their healthcare outcomes. GDPR
is aligned with the idea of patient empowerment as
that it allows patients to access their health data and
to know which health professionals also accessed it
(Jornal Oficial da Uni
˜
ao Europeia, 2016).
1.3 MyRegister
Considering the need that is expected for the insti-
tutions to be compliant with the new legislation in
force and the results obtained in the questionnaire car-
ried out in (Reis et al., 2018) where was shown that
90.7% of the 589 participants recognized that a tool
to control healthcare providers accesses would be im-
portant, and 71.5% of them agreed that they would
use that tool, we intended to create a tool that com-
plies with both. The tool we intended to create will
allow patients to know which professionals accessed
their health data in institutions where they have had
previous contact. We intend to base our tool on the
information gathered by the HS.Register audit trail
(Gonc¸alves-Ferreira et al., 2018). HS.Register is an
audit trail that collects events, logs and HL7 messages
from hospital information systems. We intend to col-
lect in our tool (MyRegister) the information from the
repository of HS.Register (where all the information
is stored) and present clearly and structurally useful
information to the patient through a web page. We
will only collect information from the patients who
agree to use and enroll in our tool.
The main features of MyRegister are:
• present the health professionals who accessed the
patient’s health information, the date of access,
the system in which it was accessed and the ac-
tion taken (visualization, edition, elimination or
creation);
• present the health events performed by the patient
(consultations, exams, surgeries, etc.);
• present scheduled future patient health events;
• allow to report to the health institution accesses
that are suspected to be undue;
• provide alarmistic to alert the patient when an ac-
cess to patient’s information is made;
Usability Study of a Tool for Patients’ Access Control to Their Health Data
95

• provide alarmistic to alert the patient that he/she
has scheduled a health episode;
MyRegister will be possible to use by any patient
of the Portuguese national health system (NHS) and
therefore needs a greater focus on usability of the tool.
Before development we decided to create a functional
prototype, Figure 1, to validate the user interface of
the tool with real users. Figure 1 represents 2 distinct
pages of the tool, the one marked with the letter A
shows the homepage that consists of a timeline where
it is possible to visualize the accesses made. In red
are marked the accesses that are outside a context of
health episode and possibly are undue. The second
page, marked with the letter B, shows a detailed page
of the accesses of a specific day where it is possible
to see the information of each access. It is also possi-
ble to filter the access information through the boxes
on the right side of the page, and report the accesses
through the ”report accesses” button.
1.4 Usability Evaluation
We consider the importance that is prototyping a tool
that is intuitive and provides the user with a pleas-
ant experience. We consider important to evaluate the
functional prototype with real users before starting the
development of the tool to try to avoid, to the max-
imum, serious usability problems that require many
modifications during the development phase.
Usability aims to guarantee the quality of the in-
terface, allowing the user an easy, pleasant and trans-
parent interaction, and transmitting the sensation of
the user having control over the use of the system. In
addition, usability can influence the use of the tool
and make users more interested in using it and using
it more frequently. We can not assume that following
good design practices is enough to please users, eval-
uation is necessary to ensure that the system can be
used and users like it (Rogers et al., 2011).
In order to take into account the needs of the users
during the design and development phases, it is im-
portant to evaluate the application at various stages
to correct the problems encountered, as soon as pos-
sible. Deficiencies detected can and should be solved
during system development. If those are discovered at
the end of the development process it can be problem-
atic as correcting a problem identified at an advanced
stage can result in high costs due to the need to make
changes to the entire system. Such changes may lead
to delaying the final development deadlines.Therefore
it is essential to start evaluating as soon as possi-
ble, preferably in the system’s design phase (Santos,
2015).
Efficiency, efficacy and satisfaction are three im-
portant points to consider in the usability of a system.
Usability tests need to measure the performance of
usual users to perform usual tasks. Through question-
naires and interviews it is also possible to measure
users’ satisfaction (Rogers et al., 2011).
For the evaluation of usability validated question-
naires are often used all over the world. As an ex-
ample the SUS questionnaire was used in (Konstan-
tinidis et al., 2016) and (Triantafyllidis et al., 2014)
as a usability evaluation tool. The SUS questionnaire
is translated into Portuguese and validated by (Mar-
tins et al., 2015) and is composed by 10 statements
about the user opinion of the product use. Each state-
ment is associated by the user to a level of agreement,
based on a likert scale. To calculate the final score
of the SUS each level of agreement is assigned to a
value. According to (Martins et al., 2015) a product
is considered above average, and therefore with good
usability, if it obtains a SUS score above 68.
With all these important issues in view, the aim
of this study is to evaluate the usability of a tool in
which patients will be able to monitor health profes-
sionals accesses to their health data in healthcare in-
stitutions. We intended to collect feedback from user
tests to optimize our tool (MyRegister) according to
the obtained results and understand if it is possible to
create a tool usable and user-friendly to the patients
where they can understand easily the information that
is given to them.
2 METHODOLOGY
In order to evaluate the functional prototype we de-
cided to present the study participants with four tasks
to accomplish. These tasks were triggered by four
main questions corresponding to the main features of
the tool.
Participants had the functional prototype created
through the Justinmind software, which allows inter-
actions between the pages through clicks simulating a
real web page. At the beginning of the activity it was
given a brief explanation of what MyRegister is and
what the users could expect from this tool, namely
that it allows to know which health professional saw
the patient’s health information as well as access their
health episodes. For this usability test we asked the
participants to use the prototype in order to answer
the presented four questions:
Q1: How many abnormal accesses were made in
July 2018 and what were the names of the health pro-
fessionals who did them?
Q2: How many accesses were made where infor-
mation was eliminated in Hospital B?
HEALTHINF 2019 - 12th International Conference on Health Informatics
96
Table 1: Participants’ Demographic Information.
G Age
Academic
Qualifications
Occup.
Pers.
PC
Use the
PC
Use bank
webpage
Use finance
webpage
Use PDS
webpage
1.A F 18-30 Master/PhD Worker Yes Always Frequently Never Sometimes
2.A M 30-50 Master/PhD Worker Yes Always Sometimes Frequently Never
3.A M 18-30 Master/PhD Worker Yes Always Always Frequently Rarely
1.B F 18-30 Secondary Student Yes Frequently Never Never Rarely
2.B F 18-30 Secondary Student Yes Always Rarely Never Never
3.B F 18-30 Secondary Student Yes Always Rarely Never Sometimes
1.C F 30-50 Post-grad Worker Yes Frequently Always Always Sometimes
2.C F 30-50 Bachelor’s Worker Yes Always Always Always Sometimes
1.D F 50-60 Secondary Worker Yes Rarely Never Never Never
2.D M 50-60 Secondary Worker Yes Frequently Never Never Never
Q3: At what time was the doctor appointment on
01-07-2018?
Q4: Knowing that on 14-07-2018 Dr. Thomas
Davis, your surgeon, needed to access your health in-
formation to add a report of a surgery, find the ac-
cesses on the 14-07-2018 and report those which you
consider suspicious/abnormal.
We asked them to speak out loud and explain the
difficulties they were encountered while we were tak-
ing notes of the use of the prototype and the timing of
each task completion. No instructions were given to
the participants on how to carry out the tasks nor was
there a time limit for doing them.
After completing the tasks we provided the user
with the SUS questionnaire to respond according to
the use of the functional prototype. We also gave
the participants the possibility of continuing to ex-
plore the prototype to respond more accurately to the
questionnaire. We added an open question for sug-
gestions, this was for the user to leave recommenda-
tions or improvements in any part of the prototype,
including design and/or content. At the end of the
SUS we asked the participants to fill out a question-
naire with sociodemographic information. This infor-
mation allows us to characterize the population that
was evaluating our prototype (age, academic quali-
fications, technical habits, use of similar webpages
etc.).
2.1 Study Participants
We used a non-probabilistic method of convenience,
because we selected the most easily accessible people
that met the inclusion and exclusion criteria.
Inclusion criteria:
• Older than 18 years;
• Fluent in Portuguese.
Exclusion criteria:
• Can not read and/or write;
• Have any motor deficiencies that prevent the use
of the computer.
According to (Virzi, 1992) only 5 participants are
enough to find 80% of usability problems, because the
first participants usually find the most serious prob-
lems. Less new usability problems are found by the
following participants. From the social demographic
questionnaire analysis we decided to create 4 different
groups, each group had between 2 and 3 participants.
Group A consisted of 3 individuals under 50 years
of age, with masters or PhD degrees, who always use
the computer and who have in common the use habits
of similar web pages. Group B is composed entirely
of students who frequently use the computer but not
as frequently use similar webpages to our prototype.
Group C consists of participants with a higher aca-
demic degree with a high frequency in the use of com-
puters and webpages similar to the prototype. Finally,
the last group, the group D is composed by 2 partic-
ipants with secondary education who use the com-
puter but never used similar webpages as the ones
presented. The characterization of each participant is
presented in Table 1. Groups are presented in table 2.
Table 2: Evaluation Groups.
Group Description n
A
Expert participants (in software
development, medical informatics
and data protection)
3
B Young participants ([18, 30[ years) 3
C Adult participants ([30, 50[ years) 2
D Older participants (>50 years) 2
3 RESULTS
3.1 Results of the Performed Tasks
During the accomplishment of tasks notes were taken
regarding the behavior of the participants with the
Usability Study of a Tool for Patients’ Access Control to Their Health Data
97

prototype. After the evaluation of the prototype with
the first 4 participants (participants 1.B; 2.B; 3.B;
1.C), we immediately identified 3 major problems:
• difficulty in returning to the home page;
• lack of use of the filter functionality;
• difficulty in understanding the difference between
access and health episode.
From the previous three problems we consider that
the first two were easily solved unlike the last one that
would require a reconstruction of the prototype. In
order to avoid that the remaining participants were af-
fected by the problems already identified we chose to
solve the first two. We introduce a back button on
every page of the prototype and to solve the second
problem we chose to include a title for the filters func-
tionality in order to draw attention and explain their
existence. The prototype with the changes was pre-
sented to the remaining of the participants.
The major problems found in the remaining of
participants’ evaluation (participants 1.A; 2.A; 3.A;
2.C; 1.D; 2.D) were:
• difficulty in understanding the difference between
access and health episode;
• difficulty in interpreting the dates in the timeline;
• difficulty finding the ”report accesses” button.
From the previously identified problems we ver-
ified that the two problems identified and changed
in the prototype in the first 4 participants’ evaluation
(difficulty in returning to the home page and lack of
use of the filter functionality) were solved. The prob-
lem of the difficulty in understanding the difference
between accesses and health episodes occurred still
remained with this participants that also identified two
new problems.
Each of the questions asked had an associated so-
lution, some of the questions would have different
ways of achieving the result but all the participants
should be able to give the correct answer. All partici-
pants in all questions asked were able to complete the
task required to give the answer, however the answers
given were not always correct.
In table 3 we present the answers where C= cor-
rect answer and I= incorrect answer for each partici-
pant, the percentage of correct answers of each group
and we also present the percentage of correct answers
for the total of participants. We can verify that ques-
tions 2 and 3 were answered correctly by all partici-
pants. Question 1 was answered correctly by all par-
ticipants in group A and question 4 by all participants
in group C. 4 of the participants answered all of the
questions correctly, 2 of whom were in group A, 1
in group C and one in group D. We can assume that
question 4 was the one that created more difficulties
in the participants (with 60% of correct answers) fol-
lowed by the first question (with 70% of correct an-
swers). The changes made in the prototype after eval-
uation of the first 4 participants did not show evidence
of having interfered with the answers given by the
participants.
Table 3: Results: task answers.
Participant Q1 Q2 Q3 Q4
1.A C C C I
2.A C C C C
3.A C C C C
Group A 100% 100% 100% 66%
1.B C C C I
2.B I C C C
3.B C C C I
Group B 66% 100% 100% 33%
1.C C C C C
2.C I C C C
Group C 50% 100% 100% 100%
1.D I C C I
2.D C C C C
Group D 50% 100% 100% 50%
Total 70% 100% 100% 60%
Table 4: Results: task time (seconds).
Participant Q1 Q2 Q3 Q4
1.A 78 47 29 83
2.A 48 63 41 73
3.A 45 46 50 92
Group A
Median
57 52 40 83
1.B 99 95 97 200
2.B 59 128 48 199
3.B 35 133 128 175
Group B
Median
64 119 91 191
1.C 61 86 102 204
2.C 99 94 69 189
Group C
Median
80 90 86 197
1.D 167 84 154 203
2.D 78 73 65 129
Group D
Median
123 79 110 166
Total Groups
Median
77 85 78 155
In table 4 we present the time (in seconds) that
each participant took to complete the tasks to answer
the questions. It is important to note that the times
presented are counted from the moment the partici-
HEALTHINF 2019 - 12th International Conference on Health Informatics
98

pant starts reading the question until a final answer
to the question is given. Considering that all ques-
tions were answered by the participants, even if they
were answered wrongly we chose to count all re-
sponse times. Also as shown in table 4, we can verify
that in all the questions, group A (experts) obtained a
mean time of resolution of the tasks much lower than
the other groups. With special focus on the last ques-
tion that was resolved much faster by group A than
the other groups. Comparing groups B, C and D, we
realized that the results are not so distant from each
other. Although it is possible to verify that group D,
older than 50 years, has a mean time superior to the
remaining groups, between group B and C the values
are lower in one or the other depending on the ques-
tions. Contrary to the task answers, the task execution
time may have been influenced by the changes made
in the prototype after the evaluation of the first 4 par-
ticipants (participants 1.B; 2.B; 3.B; 1.C). The first 4
participants, as shown in table 4, showed that they had
a longer response time essentially in questions 2 and
3, which, considering the notes taken during the eval-
uation, allows us to say that these results were based
on the difficulties inherent in returning to the home
page and the use of the filters, problems solved for
the remaining participants.
3.2 Results of the SUS
To calculate the SUS score to the answers of ”strongly
disagree ” is assigned the value 1, to ”disagree in part”
the value 2, for the ”not agree or disagree” is assigned
the value 3, for the ”agree in part” the value 4 and for
the ”strongly agree” the value 5. For each participant
the calculated score will allow us to measure the level
of usability of the product. The score ranges from 0
to 100 and is calculated by summing the results of
each statement multiplied by 2,5 (Brooke et al., 1996;
Martins et al., 2015). The result of each statement is
calculated by:
• For the statements 1, 3, 5, 7, and 9: assigned value
(1 to 5 according o the answer) minus 1;
• For the statements 2, 4, 6, 8 and 10: 5 minus value
assigned (1 to 5 according o the answer).
In table 5 we present each participant’s SUS score,
we can verify that only 2 participants obtained a re-
sult inferior to 68, one of group A and one of group
B. The mean scores of the groups were all higher than
68, with the highest mean in group C and lowest in
group B. The changes made in the prototype after the
evaluation of the first 4 participants showed no evi-
dence of interfering with the results of the SUS score.
The median of the SUS score of all the participants
is 79.5, that is above the average and reveals a good
usability of the prototype MyRegister.
Table 5: Results: SUS.
Participant SUS Score
1.A 87,5
2.A 65
3.A 85
Group A 79,17
1.B 55
2.B 75
3.B 80
Group B 70
1.C 92,5
2.C 95
Group C 93,75
1.D 70
2.D 90
Group D Score 80
Total Score 79,5
Below we present the suggestions left by the par-
ticipants at the end of the questionnaire:
• Add ”Back” button (suggestion before prototype
changes);
• Add title to filters (suggestion before prototype
changes);
• Add information on the timeline for the month
in question and add indication of the days on the
line;
• Add a filter to access only out-of-context ac-
cesses;
• Add a signalization in the total access history for
the accesses that are out of context;
• Add information explaining the action that is trig-
gered when a button is clicked (hover the button
to see more information);
• Add information in the timeline about the ac-
cesses, namely the institution where they were
made (hover the button);
• Change the ”Report Accesses” and ”Access His-
tory” buttons to give more prominence;
• Add checkboxes in each access to be able to report
more easily;
• When a health episode of the timeline is selected,
only the episode in question should be presented
or be marked with a different color to give more
prominence;
• Add an area with the description of the most tech-
nical/specific vocabulary of the tool giving con-
text and examples.
Usability Study of a Tool for Patients’ Access Control to Their Health Data
99

4 DISCUSSION
This study aimed to evaluate the created functional
prototype of MyRegister and collect feedback from
user tests to optimize the tool according to the ob-
tained results. From the results presented previously
we can verify that the prototype had in general posi-
tive results when used by the study participants.
Regarding the answers to the questions presented,
the answers were mostly correct. Those that were
not correct were due to difficulties in interpreting the
question or the topic that is addressed in MyRegis-
ter and not because of difficulties in using the proto-
type. We can then ensure that the study population
was able to use the prototype to answer the questions.
The answers to the only questions that obtained in-
correct answers (Question 1 and Question 4) can be
justified. Question 1 was the first question and there-
fore the first contact the participant had with the pro-
totype. In this first phase the participant was trying to
understand what was presented in the prototype and
could not be able to easily interpret the information
presented leading to incorrect answers. Question 4
was a question with an associated difficulty. It was
expected that the participant would have knowledge
about what an abnormal access by a health profes-
sional would be and required knowledge of the legis-
lation and interpretation of the text provided as con-
text for the question. In this question the incorrect an-
swers were always referring to the access where the
deleted information was. We understand that there is
a perception of the participants that no information
should be eliminated independently of the healthcare
professional who does it. The intent of this question
was to see if the participants understood what an ab-
normal access was and that it should be reported. Al-
though 4 of the 10 answers were wrong, we did not
consider that these participants would report in a real
situation only all accesses with information deleted.
We believe that the problem in this question was the
difficulty that existed in interpreting the context and
therefore understanding what would be a suspicious
access or not. We believe that if the participants saw
real information from their health professionals, ac-
tions taken etc. would have been easier to report cor-
rectly.
About the time the participants took to complete
the tasks we can say that for a first use of the proto-
type, in our opinion, we have had positive results. The
execution time of all tasks was between 29 seconds
and 204 seconds (3 min 24 sec). Being that the ques-
tion with superior times was the question 4 that as re-
ferred it demanded a greater knowledge on the part of
the user. We can verify that the smaller average times
were observed in group A, which is expected consid-
ering that the population in question would dominate
both the technological environment and MyRegister
topic. In groups B and C the average times are similar
and show that there were no difficulties that delayed
the execution of tasks. Group D obtained the highest
mean values on some questions. Considering the age
of the participants in this group and the technological
habits presented in the socio demographic results it is
expected that, in comparison with the other groups,
they take more time to perform the tasks.
In the usability evaluation, the SUS results were
positive, showing that the prototype provided users
with good usability. Comparing with the results of
the SUS applied in other studies we consider that our
result was very good. In (Konstantinidis et al., 2016),
the SUS score for a platform to assist in the physical
practice of the elderly was 76.3 and in (Triantafyllidis
et al., 2014) the SUS score was 73 for a mobile health
platform. The score that our study obtained was 79,5
showing that users had a pleasant experience in using
the prototype.
Two of the problems found in the first 4 partici-
pants were the need for a back button and a need to
give greater focus to the filters. After being solved
for the remaining participants it was possible for us
to identify other problems. One of the biggest prob-
lems found in most of the participants was the dif-
ficulty they had in distinguishing what are accesses
and what are health episodes. One solution to this
problem would be to restructure the entire prototype
in order to group each type of information to allow the
user to more easily understand and separate it. An-
other hypothesis that was also suggested by the par-
ticipants would be to create an area of clarification
of the terms used in MyRegister, with associated ex-
amples to facilitate the user’s understanding. Another
problem found was the difficulty that the user had in
finding the secondary buttons, namely the button to
report the accesses. As a solution to this problem the
button colors can be changed to draw more attention
to the user. Other suggestions that were given by the
participants, would not interfere with the ability to
perform the tasks but would provide the user with a
more enjoyable experience. In this way, we intend to
reformulate the mockups to apply them and promote
the greatest usability possible.
5 LIMITATIONS
The major limitation of the study was that we did not
have the opportunity and time to validate the usability
assessment task script presented to the participants.
HEALTHINF 2019 - 12th International Conference on Health Informatics
100

The validation of the questions and the answers given
would be essential to ensure that it would be easy for
users to interpret the given questions, as well as to be
sure that the answers considered by us as correct did
not raise any doubts that those would be the correct
ones. Some of the answers given by the users were
not considered for us initially as being possible cor-
rect answers, but we equate the hypothesis of these
answers being considered as correct. Another limita-
tion of this study is the chosen population that besides
being constituted by a low number of participants
those were chosen for convenience. A recognized
limitation was that changes were made to the proto-
type during the course of the evaluation. Although
we consider it important to solve the problems found
to not affect all the participants, these changes have
prevented us from making a comparison between the
different groups with certainties. We consider it nec-
essary to make an evaluation with more participants
and with a random sample of the Portuguese popu-
lation. Another limitation is the evaluation method
chosen, SUS and the interviews (through the accom-
plishment of tasks) although used successfully are not
detailed enough to say with certainty that the proto-
type has a good usability. Besides that the SUS test is
most often applied after frequent use of the tool by the
user, which did not happen in our study since we used
a prototype for evaluation. To evaluate the usability
of the tool other methods such as a First Click Testing
or Eye Tracking can be added.
6 CONCLUSIONS
We conclude that it is possible to create a usable and
user-friendly tool that allows patients to monitor the
access that is made to their health information. With
the increasing demand for the use of safe systems that
promote patient empowerment, a tool to monitor ac-
cess to patient health information that is a growing
need in health institutions, is essential and should be
used by all patients. With this study we realized the
major problems in our prototype and we also collect
suggestions from the users to move forward into cre-
ating the tool with a more solid baseline.
ACKNOWLEDGEMENTS
This work is supported by the MSc in Medi-
cal Informatics of the University of Porto, Por-
tugal (http://mim.med.up.pt). The authors would
also like to acknowledge the project Demonstrador
HS.REGISTER, supported by Norte Portugal Re-
gional Operational Programme (NORTE 2020), un-
der the PORTUGAL 2020 Partnership Agreement,
through the European Regional Development Fund
(ERDF).
REFERENCES
Brooke, J. et al. (1996). Sus-a quick and dirty usability
scale. Usability evaluation in industry, 189(194):4–7.
Cruz-Correia, R., Boldt, I., Lap
˜
ao, L., Santos-Pereira, C.,
Rodrigues, P. P., Ferreira, A. M., and Freitas, A.
(2013). Analysis of the quality of hospital informa-
tion systems audit trails. BMC Medical Informatics
and Decision Making, 13:84.
Gonc¸alves-Ferreira, D., Leite, M., Santos-Pereira, C., Cor-
reia, M. E., Antunes, L., and Cruz-Correia, R. (2018).
Hs. register-an audit-trail tool to respond to the gen-
eral data protection regulation (gdpr). Studies in
health technology and informatics, 247:81–85.
Jornal Oficial da Uni
˜
ao Europeia (2016). Regulamento
(UE) 2016/679 Parlamento Europeu e do Conselho da
Uni
˜
ao Europeia, S
´
erie L, N
o
119. Jornal Oficial da
Uni
˜
ao Europeia.
Konstantinidis, E. I., Billis, A. S., Mouzakidis, C. A., Zili-
dou, V. I., Antoniou, P. E., and Bamidis, P. D. (2016).
Design, Implementation, and Wide Pilot Deployment
of FitForAll: An Easy to use Exergaming Platform
Improving Physical Fitness and Life Quality of Senior
Citizens. IEEE Journal of Biomedical and Health In-
formatics, 20(1):189–200.
Martins, A. I., Rosa, A. F., Queir
´
os, A., Silva, A., and
Rocha, N. P. (2015). European Portuguese Validation
of the System Usability Scale (SUS). Procedia Com-
puter Science, 67:293–300.
Reis, S., Ferreira, A., Vieira-Marques, P., Santos-Pereira,
C., and Cruz-Correia, R. (2018). Do patients want
to know who accesses their personal health informa-
tion?: A questionnaire to university students. In 2018
13th Iberian Conference on Information Systems and
Technologies (CISTI), pages 1–6.
Rogers, Y., Sharp, H., and Preece, J. (2011). Interaction de-
sign: beyond human-computer interaction. John Wi-
ley & Sons.
Santos, L. (2015). Teste e avaliac¸
˜
ao de usabilidade de app
para gest
˜
ao de diabetes em Android. PhD thesis.
Schulz, P. J. and Nakamoto, K. (2013). Health literacy and
patient empowerment in health communication: The
importance of separating conjoined twins. Patient Ed-
ucation and Counseling, 90(1):4–11.
Tovino, S. A. (2016). The hipaa privacy rule and the eu
gdpr: Illustrative comparisons. Seton Hall L. Rev.,
47:973.
Triantafyllidis, A. K., Koutkias, V. G., Chouvarda, I., and
Maglaveras, N. (2014). Development and usability
of a personalized sensor-based system for pervasive
healthcare. In 2014 36th Annual International Con-
Usability Study of a Tool for Patients’ Access Control to Their Health Data
101

ference of the IEEE Engineering in Medicine and Bi-
ology Society, pages 6623–6626.
Virzi, R. A. (1992). Refining the Test Phase of Usability
Evaluation: How Many Subjects Is Enough? Human
Factors, 34(4):457–468.
HEALTHINF 2019 - 12th International Conference on Health Informatics
102
