
Data Multiplexing Through Animated Texture Orientation and Color
Maria-Jesus Lobo and Christophe Hurter
ENAC, Toulouse, France
Keywords:
Information Visualization, Multivariate Visualization, Animated Representations.
Abstract:
Multidimensional data visualization is still a challenge for complex data exploration. Usually, each data
dimension might be mapped to one available visual variable such as position, shape or color. While spatial
and color data mappings have been previously intensively explored, animated encodings have been far less
investigated. However, such techniques are widely used in existing visualizations. In this paper, we propose to
assess the visual assets of direction and orientation of directed animated textures to encode data. We present
a user study that compares three animated textures and a static representation. The results suggest that the
animated techniques can be as effective as the static representation in terms of accuracy and data retrieval
time. Finally, we present some design guidelines to efficiently use animated particle visualizations .
1 INTRODUCTION
Minard’s visualization of Napoleon’s march shows
one of the most relevant data representation where
multiple data dimensions are presented at the same
time. Such an astute image is difficult to generalize
and multidimensional data visualization is still today
a challenge. If we consider a 2D surface composed
of two axes (i.e. a screen), it offers two available data
mappings (X and Y coordinate system which can be
mapped to two data dimensions). In addition, other
data dimensions can be mapped with other available
visual variables such as size, color, and shape (Berlin
and Barbut, 1968). These visual variables can also be
animated across time to depict dynamic phenomena,
as in some cartographic applications (DiBiase et al.,
1992; Lobo et al., 2018). However, while spatial and
color data mappings perception have previously been
intensively explored, the perception of animated visu-
alizations have been far less investigated.
This is especially the case with techniques
using directional animated particles (Wegenkittl
et al., 1997; van Wijk, 2002; Scheepens et al.,
2016). These techniques are widely used in
many engaging and pleasing animations to dis-
play flow information. For example, global
wind visualizations (https://earth.nullschool.net/,
https://www.windy.com/ ) show color streams that
represent the strength and direction of the wind.
Other types of visualizations use a color scale
to display temperature data on top of the stream
visualization (https://www.ventusky.com/). The
TV show from the BBC, “Britain from above”
(https://www.bbc.co.uk/programmes/b00d23yx)
shows many instances of animated flows with various
designs. Some examples are depicted in Figure 1.
Figure 1: Example animated particle system to
show flow directions.(https://earth.nullschool.net/,
https://www.windy.com/, https://www.ventusky.com/).
All of these techniques offer the capability to vi-
sually represent two data dimensions. First, the di-
rection of the flow codes one data dimension. Sec-
ond, the color of the flow or the background codes
another data dimension (i.e. stream intensity). While
these techniques are currently used in many applica-
tions and research domains, we still do not know how
efficient at representing these two dimensions simul-
taneously the different representation techniques are.
In this paper, we propose to assess the visual as-
sets of such techniques. We conducted a user study
where we show colored animated particles to visu-
ally map two data dimensions. The results suggest
that techniques based on animated textures can per-
form as well as a static data representation in terms
of accuracy and data retrieval time. Furthermore, we
show that the orientation difference has an influence
on the color retrieval. Finally, we summarize our find-
Lobo, M. and Hurter, C.
Data Multiplexing Through Animated Texture Orientation and Color.
DOI: 10.5220/0007391602890296
In Proceedings of the 14th International Joint Conference on Computer Vision, Imaging and Computer Graphics Theory and Applications (VISIGRAPP 2019), pages 289-296
ISBN: 978-989-758-354-4
Copyright
c
2019 by SCITEPRESS – Science and Technology Publications, Lda. All rights reserved
289

ings with design guidelines to efficiently use animated
particle visualizations.
2 RELATED WORK
2.1 Textures for Multivariate
Visualizations
The use of textures for multivariate visualization has
been explored through different techniques such as
brush strokes (Kirby et al., 1999), quantitative tex-
tons (Ware, 2009), contour maps (van Wijk and Telea,
2001) and more recently decal maps (Rocha et al.,
2017). Other techniques, such as the circular dataim-
age (Morphet and Symanzik, 2010) focus specifically
in displaying angles. These techniques seem to be ef-
fective to depict multiple data attributes for a region,
as textures enable to separate different scalar values.
For example, Ware (2009) compares quantitative tex-
tons to bivariate color maps, and find they produce
lower error rates when reading values.
However, all these studies focus on static tech-
niques, and do not explore animated techniques. Fur-
thermore, they compare techniques that are very dif-
ferent from each other, whereas in this study we aim at
comparing only techniques that depict color and ori-
entation
2.2 Textured-based Flow Visualization
The field of flow visualization has a long history of
using animated textures to visualize flow character-
istics. Flow visualization techniques are categorized
as direct, texture-based, geometric, and feature-based
(Laramee et al., 2003; McLoughlin et al., 2013). We
review the most relevant existing work to our study
on texture-based flow visualization techniques. For a
more detailed review, we refer the readers to the sur-
veys presented in (Laramee et al., 2003; McLoughlin
et al., 2013).
Laramee et al. (2003) classify texture-based tech-
niques as Spot Noise Techniques, LIC techniques, Tex-
ture advection and GPU-based techniques. LIC tech-
niques apply a convolution to a noise texture that
follows the direction of the vector field, resulting in
a dense visualization. Texture advection and GPU-
based techniques distort existing textures along the
direction of the vector field using a predefined mesh.
These techniques can be further extended to dis-
play multivariate data through weaving (Urness et al.,
2003), contrast variation (Sanna et al., 2002) or vari-
ations of the initial noise textures (Kiu and Banks,
1996). Several variations and optimizations of these
techniques exist (Stalling and Hege, 1995; Wegenkittl
et al., 1997; Laramee et al., 2003) and it is now possi-
ble to achieve efficient rendering. However, it is still
unclear how these different techniques are perceived
and which one might be more efficient to understand
the characteristics of the depicted flow such as its ori-
entation and direction.
2.3 User Studies
Existing studies (Laidlaw et al., 2005; Moorhead
et al., 2012) comparing static flow visualization tech-
niques suggest that the more visually explicit meth-
ods (showing integral curves, critical points, and flow
directionality) are more effective. Ware et al (2016)
compare animated to static representations to visual-
ize steady flow patterns. The results suggest that an-
imated streamlets are faster and more accurate than
static arrow grids, static streamlets and animated or-
thogonal particles for a pattern detection task. These
studies only consider the flow representation through
animated textures, but do not evaluate the simultane-
ous readability of flow animated direction and color.
Ware et al. (2013) present new designs for a multi-
variate weather display, and evaluate their readability
in a user study. Their results suggest that a map that
combines animated particles, color and texture can be
more readable than the traditional design that uses a
static depiction. Their results suggest that users can
read multiple variables on a weather display, but they
only evaluate one technique of animated particles.
Our study aims at comparing animated texture-
based flow visualization techniques to a static repre-
sentation in both color and direction encoding. As op-
posed to the existing studies, we do not focus specif-
ically on flow data and rather try to evaluate which
technique is better to represent color and orientation
simultaneously.
3 TECHNIQUES
We chose our techniques by reviewing the existing
literature and visualizations used in websites. We
tuned each technique iteratively to achieve the ren-
dering that enabled us to depict the biggest range of
orientation and color values.
3.1 IBFV
Image Based Flow Visualization (van Wijk, 2002) is
a technique for visualizing flows. It is based on im-
age wrapping and blending. For each frame, a white
IVAPP 2019 - 10th International Conference on Information Visualization Theory and Applications
290
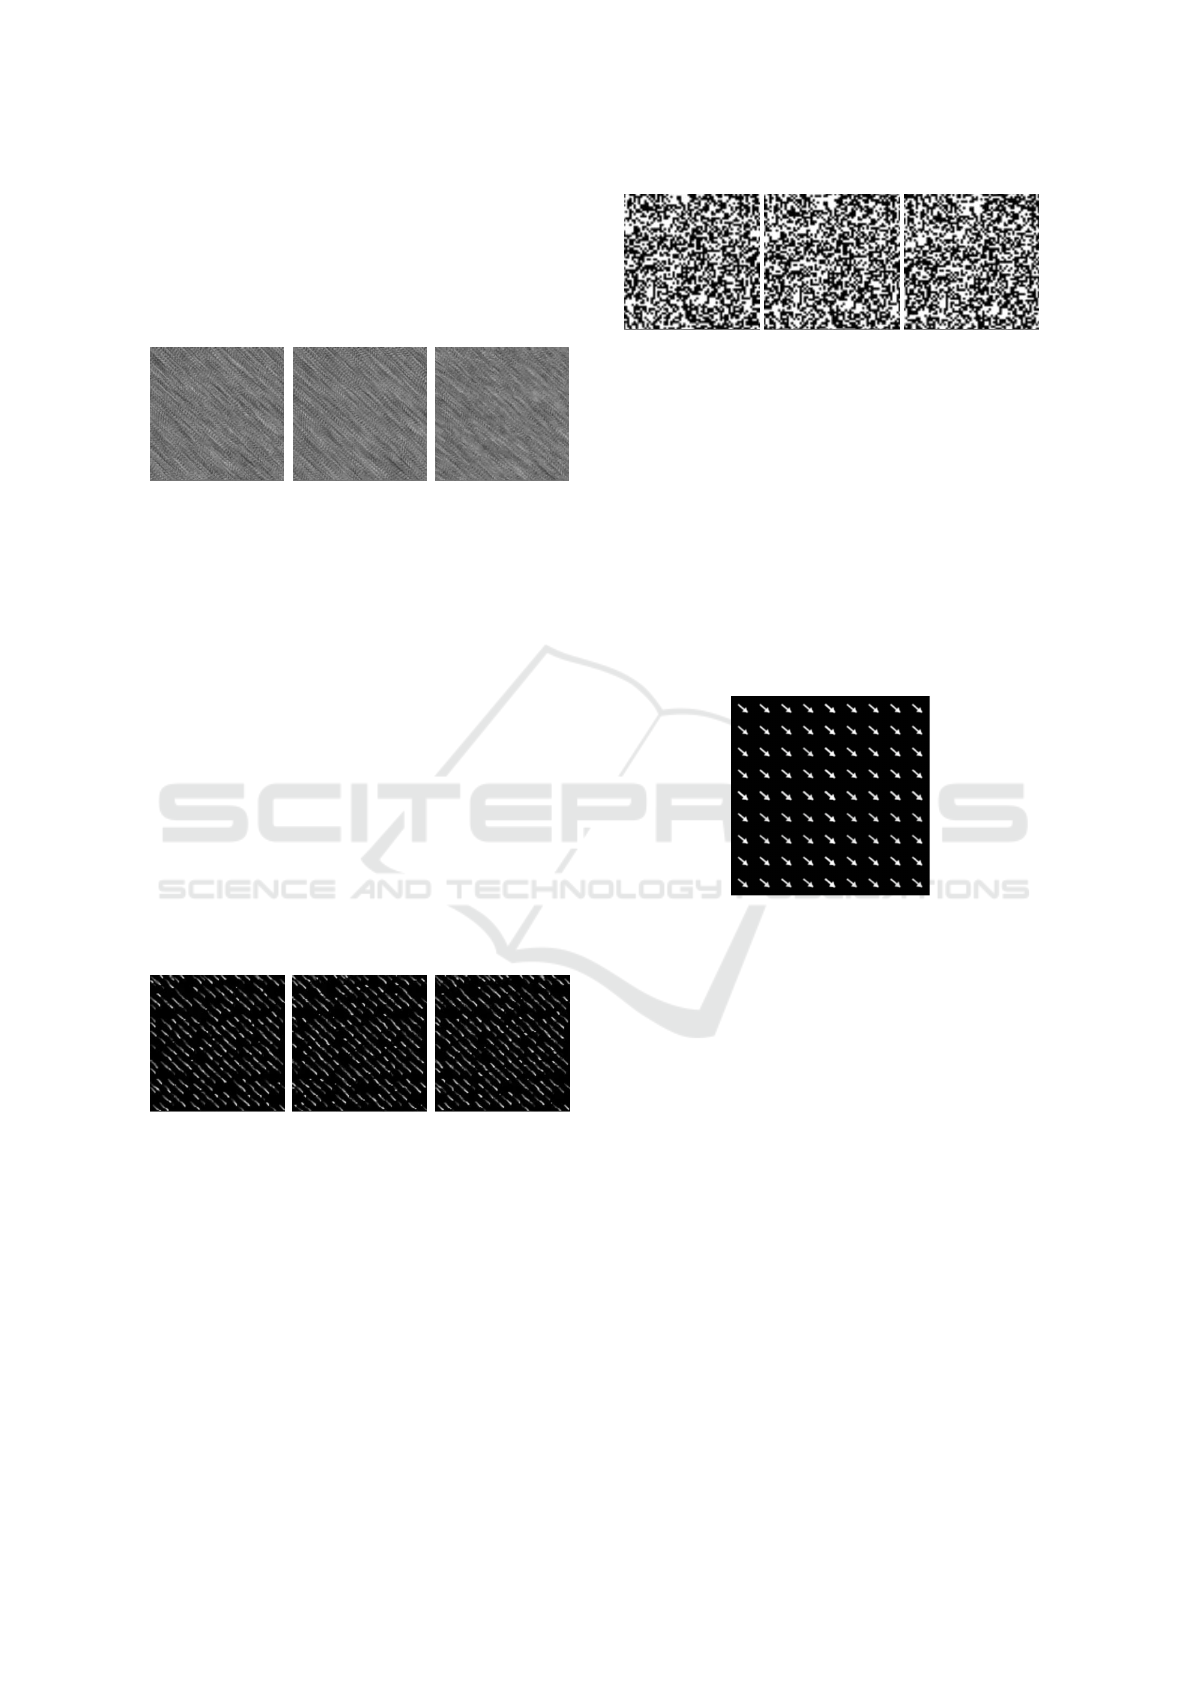
noise image is wrapped in the direction of the flow
and then blended with another white noise image, as
depicted in Figure 2. We implemented IBFV as de-
scribed in (van Wijk, 2002). We rendered 60 frames
per second and used a pattern resolution of 128 pixels
with a speed of 110 pixels per second.
t=0s
t=0.2s
t=0.4s
t=0s
t=0.2s
t=0.4s
t=0s
t=0.2s
t=0.4s
Figure 2: Example of IBFV animation depicting 40 de-
grees.
3.2 OLIC
Oriented Line Integral Convolution (Wegenkittl et al.,
1997) encodes both direction and orientation, by dis-
tributing some random droplets and using a ramp-like
convolution kernel, as depicted in Figure 3. This re-
sults in droplets that present a lighter color in the di-
rection of the flow. If animated, each lighter point will
move in the flow direction. This technique is the most
used on existing web visualizations. We implemented
OLIC as described in (Wegenkittl et al., 1997), but
to make it more efficient, we pre-calculate the images
corresponding to a complete phase shift of the kernel.
We use droplets of length 20 pixels and a speed of 40
pixels per second, meaning that each droplet will be
animated twice every second.
t=0s
t=0.2s
t=0.4s
t=0s
t=0.2s
t=0.4s
t=0s
t=0.2s
t=0.4s
Figure 3: Example of OLIC animation depicting 40 de-
grees.
3.3 Drifting Texture
As we would use only linear speeds (to represent
angle and direction) we also added a technique that
scrolls across a static texture, that does not depict nei-
ther orientation nor direction statically, and only uses
dynamics. Figure 4 depicts three frames of a drifting
texture animation. For this technique, we used a speed
of 20 pixels per second and a white noise texture.
t=0s
t=0.2s
t=0.4s
t=0s
t=0.2s
t=0.4s
t=0s
t=0.2s
t=0.4s
Figure 4: Example of DT animation depicting 40 degrees.
3.4 Static Representation
Previous studies suggest that animation might not be
always beneficial (Tversky et al., 2002). Thus we
added a technique that depicts both orientation and di-
rection statically as the baseline. This technique does
not distort colors in any way. We chose to use an ar-
row field, as arrows are commonly used to encode di-
rection (Ware et al., 2016), and they are always com-
pletely opaque, so they do not introduce any interfer-
ence with the color we want to represent, as depicted
in Figure 5.
Figure 5: Example of STATIC depicting 40 degrees.
4 USER STUDY
Several studies attempt to understand which color
scale is better for data visualization such as the Color
Brewer tool (Harrower and Brewer, 2003) that helps
mapmakers choose the most suitable color scale to
their data. Our design study is inspired by the more
recent study presented by Liu et al. (2018). In it,
participants were asked to compare color distance,
by choosing the closest color among two options to
a reference color. Their results suggest that multi-
hue color scales perform better than single-hue color
scales and they find that the recent color scale Viridis
perform especially well.
Our study uses the same structure, but besides ask-
ing participants to compare colors, we asked them to
compare orientations. In each trial, participants are
asked to choose the closest value among two alterna-
tives to a reference value. We use the same method-
ology to select the reference colors that the one pre-
Data Multiplexing Through Animated Texture Orientation and Color
291

sented by Liu et al. (2018), we consider that the color
scale spans from 0 to 100 and choose 8 equally spaced
color values from 20 to 80. For the angles, we use 36
equally spaced angles between 0 and 360. The two
other values are then selected according to spans as in
(Liu and Heer, 2018). For example, if we use a span
of 20, the closest value will be at a difference of 5
of the reference and the farthest at a difference of 10.
Then, if the reference value is 20, the comparison val-
ues will be either 15 and 30 or 10 and 25. A pretest
with two color spans and three angle spans resulted
in a too long study and as the study presented by (Liu
and Heer, 2018) already studies the color comparison,
we decided to only vary the angle span. Therefore,
we always use a color span of 15 and three different
ANGLE SPAN values: 15, 30, and 45. We chose to
not use smaller ANGLE SPAN values because humans
performance when comparing angles is poor (Cleve-
land and McGill, 1985). Furthermore, following the
suggestions presented by the results of the study, we
chose to use the Viridis color scale, displayed in the
bottom of Figure 7.
As the goal of this techniques is to represent mul-
tiple data dimensions in visualizations that have also
space constraints, such as heat maps, we wanted to
also study the impact of the size of the animated re-
gion on the color and orientation perception for each
technique. So, our user study also considers three val-
ues for the size of the animated patches.
4.1 Hypothesis
We propose a characterization of the techniques
according to the information they encode in their
graphic depiction, if they encode information dynam-
ically and their color density, depicted in Figure 6.
Considering this, we draw two main hypotheses:
• H1: As previous studies suggest that techniques
that present explicitly the attributes of the vector
field perform better that techniques than don’t, the
first hypothesis is that OLIC and STATIC as they
present both the direction and orientation in the
graphic representation will be more accurate than
the other dynamic techniques for orientation com-
parison. As IBFV and DT require participants
to see the direction of the animation, they should
be particularly inefficient for smaller sizes when
comparing orientations.
• H2: Increasing distance and decreasing
sizes seem to make distinguishing colors
harder(Brychtov
´
a and C¸
¨
oltekin, 2017). As the
colored area of IBFV and DT is bigger than
the colored area with the other techniques, our
second hypothesis is that these two techniques
Colored Area
No dynamic!
information
Dynamic
orientation +!
direction
No static!
depiction
Static!
orientation +!
direction
DT
OLIC
IBFV
STATIC
Small
Big
Figure 6: Classification of the techniques according to the
information encoded dynamically and statically, and the
colored area.
will be more effective to compare colors, but that
the difference will decrease for smaller sizes.
4.2 Participants and Apparatus
Sixteen unpaid volunteers (2 females), daily computer
users, aged 22 to 56-year-old (average 37.3, median
42) participated in the experiment. All had normal
or corrected-to-normal vision and did not suffer from
color blindness. The experiment was implemented
using WebGL in Javascript, and ran on a Laptop Dell
15” Retina (1600x900, 122 dpi) running Windows 10,
equipped with a 2.30 GHz Intel Core CPU, 16 GB
RAM and an NVIDIA GeForce GT 750M graphics.
Participants were asked to seat at approximately 60
cm from the screen. Each participant completed 288
trials and the study lasted about 20 minutes per par-
ticipant.
4.3 Procedure
We followed a 4x3x3 within-subject design with 3
factors: TECHNIQUE, SIZE and ANGLE SPAN. TECH-
NIQUE corresponds to one of the four techniques de-
scribed earlier. To choose the SIZE values, we took as
reference the size of an icon (16 pixels), and we mul-
tiplied it by 2 and 4. The ANGLE SPAN value corre-
sponds to the span between the lower and upper value
of the two comparison values, as mentioned before.
The experiment was organized in technique
blocks, the order of the techniques was counterbal-
anced across participants using a latin square. For the
other factors, we generated a random order for each
participant. For each technique, participants did 36
trials where they compared colors and 36 trials com-
paring orientations. For each technique, we had 3 AN-
GLE SPAN and 3 SIZE. Each SIZE x ANGLE SPAN
combination was used in four trials, where we varied
if the upper or the lower value was the closest angle
or color. For example, for the ANGLE SPAN 30 and a
reference angle of a, if the closest value is the lower
IVAPP 2019 - 10th International Conference on Information Visualization Theory and Applications
292
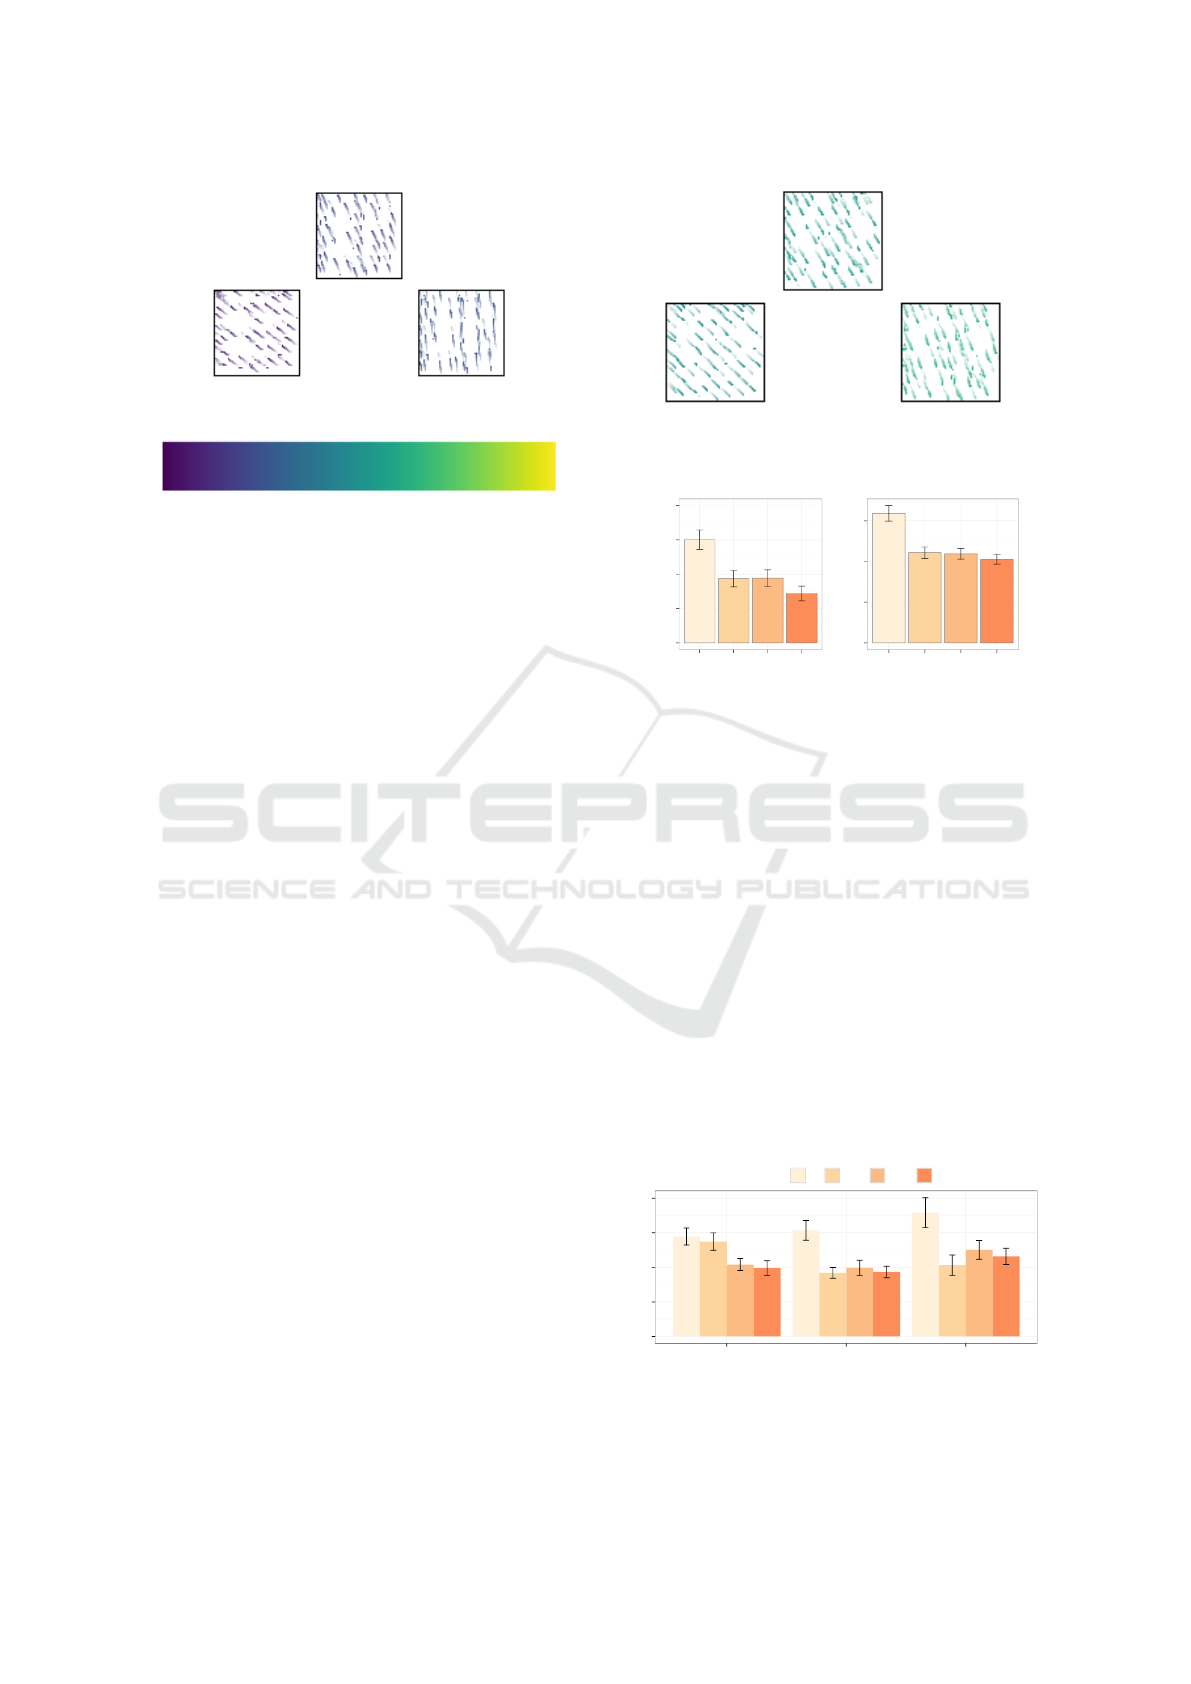
Figure 7: Example of a COLOR trial for OLIC technique.
The participant is asked to chose the closest color to the ref-
erence value (on the top). The Viridis (bottom) color scale
is only visible for these trials.
one, we would display the orientations a-10 and a+20.
This results in 75 trials per block. We generated a
random order of all the combinations of reference an-
gles and colors, and then used the same order for each
participant, as all the other conditions are randomized
between participants.
Participants started each technique block with a
training trial, that used both a color span and an AN-
GLE SPAN that was not used in the experiment. For
each trial, participants first read a set of instructions
explaining the study. They then were asked to select
the closest color or angle. Figure 7 depicts a trial of
color comparison and 8 depicts a trial of orientation
comparison. The trials were grouped by comparison
target, and participants either always started by com-
paring colors or orientations in each technique block.
If comparing colors, the trial was complemented by a
depiction of the Viridis color scale.
4.4 Results
4.4.1 Orientations
We used the Aligned Rank Transform (Wobbrock
et al., 2011) procedure for non-parametric data to an-
alyze the ERROR RATE. As Figure 9-(a) illustrates,
TECHNIQUE has a significant effect on ERROR RATE
(F
3,525
= 16.17, p < 0.0001). A pairwise post hoc com-
parison revealed a difference between DT and all
other techniques , but no difference between the other
three techniques. ANGLE SPAN has also a significant
effect on ERROR RATE(F
2,525
= 35, p < 0.0001), trials
where the angle span was 15 presented a higher error
rate than trials where the angle span was 30 that pre-
sented a higher ERROR RATE than trials where the an-
gle span was 45 (Cohen’s d between 30 and 45: 0.5,
Figure 8: Example of a ORIENTATION trial for OLIC tech-
nique. The participant is asked to chose the closest orienta-
tion to the reference orientation (on the top).
0.0
0.1
0.2
0.3
0.4
DT IBFV OLIC STATIC
Technique
Error Rate
0
2
4
6
DT IBFV OLIC STATIC
Technique
Time (s)
(a) (b)
Figure 9: (a)Average ERROR RATE per TECHNIQUE for
ORIENTATION. (b)Average TIME per TECHNIQUE for ORI-
ENTATION. Error bars represent the 95% confidence inter-
vals.
between 15 and 45: 0.85). Finally, SIZE does also
have an effect on the error rate F
2,525
= 4.8, p < 0.0001.
Both smaller sizes present significantly a bigger er-
ror rate than the SIZE = 64. There are no effects due
to the interaction between the factors (TECHNIQUE x
SIZE: F
6,525
= 0.56, p = 0.5, TECHNIQUE x ANGLE
SPAN: F
6,525
= 1.86, p = 0.08, SIZE x ANGLE SPAN:
F
4,525
= 0.92, p = 0.45, TECHNIQUE xSIZE x ANGLE
SPAN: F
12,525
= 0.88, p = 0.56).
TECHNIQUE has also a significant effect on TIME
(F
3,45
= 6.95, p < 0.0001, η
2
G
= 0.14) as depicted in
Figure 9-(b). DT is significantly slower than all the
other techniques, that present no significant differ-
ence in between them. The SIZE also has an effect on
TIME (F
2,30
= 5.62, p < 0.0001, η
2
G
= 0.02). SIZE=16
0
2
4
6
8
16 32 64
Size
Time (s)
Technique
DT IBFV OLIC STATIC
Figure 10: Average TIME per SIZE and TECHNIQUE for
ORIENTATION. Error bars represent the 95% confidence in-
tervals.
Data Multiplexing Through Animated Texture Orientation and Color
293
0.0
0.1
0.2
0.3
0.4
DT IBFV OLIC STATIC
Technique
Error rate
0
1
2
3
DT IBFV OLIC STATIC
Technique
Time (s)
(a) (b)
Figure 11: (a) Average ERROR RATE per TECHNIQUE for
COLOR. (b) Average TIME per TECHNIQUE for COLOR. Er-
ror bars represent the 95% confidence intervals.
0
1
2
3
4
16 32 64
Size
Time (s)
Technique
DT IBFV OLIC STATIC
Figure 12: Average TIME per SIZE per TECHNIQUE for
COLOR. Error bars represent the 95% confidence intervals.
takes longer than SIZE = 32, and SIZE = 64 takes
longer than SIZE = 32. The ANOVA reveals a signifi-
cant TECHNIQUE x SIZE interaction effect (F
6,90
= 3.9,
p < 0.0001, η
2
G
= 0.02) on TIME, ad depicted in Figure
10. For the SIZE = 16, IBFV and DT are significantly
slower than OLIC and STATIC, but for SIZE = 32
and SIZE = 64, there is no significant difference for
IBFV, OLIC and STATIC, and all of them are faster
than DT.
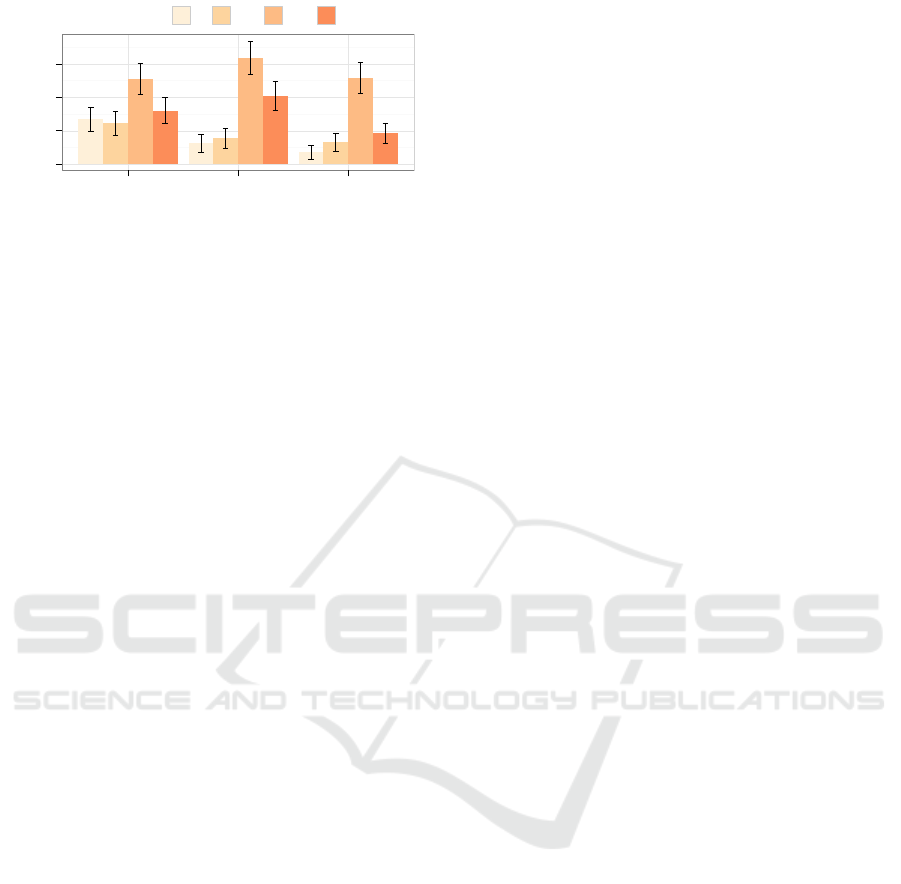
4.4.2 Colors
As for ORIENTATION we used the Aligned Rank
Transform procedure for non-parametric data to an-
alyze the ERROR RATE. TECHNIQUE also has a sig-
nificant effect here on ERROR RATE (F
3,525
= 46.7,
p < 0.0001), as depicted in Figure 11-(a). A pairwise
post hoc comparison reveals that OLIC is the more
error-prone technique, followed by STATIC. DT and
IBFV present the lowest error rates and present no
significant difference between them. The ANOVA
also reveals an effect of SIZE(F
2,525
= 11.6, p < 0.0001).
The condition were SIZE = 64 was less error-prone,
than SIZE = 16 and SIZE = 32. There is also an ef-
fect of the interaction SIZExTECHNIQUE(F
6,525
= 2.9,
p < 0.0001), as depicted in Figure 13. When SIZE
= 16, there is only a significant difference between
OLIC and IBFV. But when SIZE = 32 and SIZE = 64,
DT and IBFV are no different but are different from
OLIC and STATIC, the last one being significantly
less error-prone than OLIC. The ANOVA also reveals
an effect of ANGLE SPAN on ERROR RATE(F
2,525
=
4.58, p = 0.01). The results suggest that the AN-
GLE SPAN = 15 is less error-prone than the other
two conditions. There is also an effect of the inter-
actions ANGLE SPANxTECHNIQUE(F
6,525
= 2.89, p <
0.0001), SIZE x ANGLE SPAN(F
6,525
= 2.89, p = 0.02),
and TECHNIQUE x SIZE x ANGLE SPAN(F
12,525
= 2.56,
p < 0.0001). Looking at each TECHNIQUE and SIZE
individually, we found no effect for the different val-
ues of ANGLE SPAN. Looking at each SIZE per TECH-
NIQUE, we only find an effect for OLIC for the SIZE
= 16, where the ANGLE SPAN = 15 presents less errors
than the ANGLE SPAN=30.
TECHNIQUE (F
3,45
= 5.39, p < 0.0001, η
2
G
= 0.067)
and TECHNIQUE x SIZE (F
6,90
= 2.68, p = 0.02, η
2
G
=
0.044) also have an effect on TIME for COLOR tri-
als as depicted in Figure 11-(a). DT and STATIC
are significantly faster than IBFV that is faster than
OLIC. As depicted in Figure 12, for all SIZE values,
DT is the fastest technique. It is significantly faster
than IBFV and OLIC for SIZE = 16, but not from
STATIC. For SIZE = 32, DT is significantly faster
than all the other three, IBFV and STATIC are signif-
icantly faster than OLIC. For SIZE = 64, DT is only
different from OLIC, that is the slowest no matter the
size.
5 DISCUSSION
The graphic depiction of both direction and orienta-
tion does not seem to offer an advantage for OLIC
in comparison to IBFV and STATIC overall for ORI-
ENTATION comparisons, H1 is rejected. Also, con-
trary to what we expected, the SIZE does not seem
to have an effect on the ORIENTATION perception ac-
curacy. However, it does impact the time measure.
For the smaller SIZE, OLIC and STATIC are faster.
This could mean that the depiction of both orienta-
tion and direction that these techniques present is es-
pecially useful in smaller sizes, when is more difficult
to see the direction and orientation of the animation.
However, the dynamic aspect of OLIC does not seem
to be useful enough to make it faster than STATIC.
IBFV and DT are the most accurate technique for
COLOR comparison, and thus H2 is supported; hav-
ing a more dense representation of the color seems to
make a difference for an accurate color comparison.
In fact, the results achieved with these techniques are
similar to the ones presented in the recent study of
Liu et al. (2018). OLIC is the worst technique for
comparing colors. This difference depends also on
the size; for the smallest size, STATIC is no differ-
IVAPP 2019 - 10th International Conference on Information Visualization Theory and Applications
294
0.0
0.1
0.2
0.3
16 32 64
Size
Error rate
Technique
DT IBFV OLIC STATIC
Figure 13: Average ERROR RATE per TECHNIQUE for
COLOR. Error bars represent the 95% confidence intervals.
ent from IBFV and DT. As the size decreases, the
difference of sizes between the techniques decreases
as well, and thus the results agree with the relation-
ship between size and color comparison (Brychtov
´
a
and C¸
¨
oltekin, 2017). We can hypothesize that OLIC
does not perform well for the smallest size because
contrary to STATIC it distorts the color by varying
its luminosity across the particle. Regarding time,
DT is the fastest technique. As DT uses a translat-
ing texture, it does not transform the color in any way,
contrary to IBFV that blends the color with the noise
texture at each iteration. This could explain why the
color comparison with DT is fastest.
Surprisingly, we found an effect of ANGLE SPAN
in the accuracy of COLOR trials, that suggest that
when the animations present a smaller ANGLE SPAN,
participants are more accurate comparing colors.
The difference is significant when ANGLE SPAN=15,
where the animations’ orientations are at a distance
of 5 and 10 degrees of the reference animation.
We could hypothesize that the orientation difference
might affect the color comparison, making easier to
compare color when the angles are closer. However,
further studies are needed to test this hypothesis.
6 SUMMARY AND FUTURE
WORK
The results of our study suggest that the dynamic
component of IBFV enables users to compare ORI-
ENTATION as accurately as a static technique and
COLOR as accurately as presenting the color with-
out distortion. We recommend thus the usage of this
technique when depicting those two visual variables
together. However, the results might depend on the
size of the depicted area. If the area to display is too
little, perceiving the orientation with IBFV becomes
difficult, and an alternative technique might be better,
such as STATIC.
Our study presents multiple limitations. First, we
tunned the different techniques in a way we thought
they better depicted both the color and the orienta-
tion. But this design choices might have hampered
some techniques. For example, we chose to apply the
color to OLIC particles, instead of applying it to the
background. Several examples on the web instead use
white semi-transparent particles on top of a colored
background. We chose this design to avoid introduc-
ing a third color to the technique, and to keep the
particles visible. However, to keep the OLIC parti-
cles distinguishable, they cannot be very dense, mak-
ing the color comparison more difficult than with the
other techniques.
Second, to keep the design space manageable, we
did not control for the specific angles or color values.
Some participants mentioned that comparing orienta-
tions with light colors such as yellow was more diffi-
cult than with darker colors, especially for the IBFV
technique. Also, some angles or quadrant compar-
isons might be easier than others. Further studies
could be designed in order to test these hypotheses.
Furthermore, we could reproduce the study using an
iso-luminant color scale (Gregory, 1977), to avoid the
effects of lightness variations.
Dynamic techniques also offer the possibility of
mapping data dimensions to the parameters of the an-
imation. In this study, we focused on ORIENTATION
and COLOR because they present a higher granular-
ity. However, some animation variables such as fre-
quency and speed have already been used successfully
in the case of animated textures in graph edges (Ro-
mat et al., 2018), and using them in animated textures
is an interesting line of future work.
ACKNOWLEDGEMENTS
This research was partly supported by SESAR H2020
project ENVISION grant agreement No 783270.
REFERENCES
Berlin, J. and Barbut, M. (1968). Semiologie graphique:
Les diagrammes, les r
´
eseaux, les cartes. Paris
Gauthier-Villars.
Brychtov
´
a, A. and C¸
¨
oltekin, A. (2017). The effect of
spatial distance on the discriminability of colors in
maps. Cartography and Geographic Information Sci-
ence, 44(3):229–245.
Cleveland, W. S. and McGill, R. (1985). Graphical per-
ception and graphical methods for analyzing scientific
data. Science, 229(4716):828–833.
DiBiase, D., MacEachren, A. M., Krygier, J. B., and
Reeves, C. (1992). Animation and the role of map de-
Data Multiplexing Through Animated Texture Orientation and Color
295

sign in scientific visualization. Cartography and Ge-
ographic Information Systems, 19(4):201–214.
Gregory, R. L. (1977). Vision with isoluminant colour con-
trast: 1. a projection technique and observations. Per-
ception, 6(1):113–119. PMID: 840617.
Harrower, M. and Brewer, C. A. (2003). Colorbrewer.org:
An online tool for selecting colour schemes for maps.
The Cartographic Journal, 40(1):27–37.
Kirby, R. M., Marmanis, H., and Laidlaw, D. H. (1999).
Visualizing multivalued data from 2d incompressible
flows using concepts from painting. In Proceedings of
the Conference on Visualization ’99: Celebrating Ten
Years, VIS ’99, pages 333–340, Los Alamitos, CA,
USA. IEEE Computer Society Press.
Kiu, M.-H. and Banks, D. C. (1996). Multi-frequency noise
for lic. In Proceedings of Seventh Annual IEEE Visu-
alization ’96, pages 121–126.
Laidlaw, D. H., Kirby, R. M., Jackson, C. D., Davidson,
J. S., Miller, T. S., da Silva, M., Warren, W. H., and
Tarr, M. J. (2005). Comparing 2d vector field visual-
ization methods: a user study. IEEE Transactions on
Visualization and Computer Graphics, 11(1):59–70.
Laramee, R. S., Jobard, B., and Hauser, H. (2003). Im-
age space based visualization of unsteady flow on sur-
faces. In Proceedings of the 14th IEEE Visualization
2003 (VIS’03), page 18. IEEE Computer Society.
Liu, Y. and Heer, J. (2018). Somewhere over the rainbow:
An empirical assessment of quantitative colormaps. In
Proceedings of the 2018 CHI Conference on Human
Factors in Computing Systems, CHI ’18, pages 598:1–
598:12, New York, NY, USA. ACM.
Lobo, M., Appert, C., and Pietriga, E. (2018). Anima-
tion plans for before-and-after satellite images. IEEE
Transactions on Visualization and Computer Graph-
ics, pages 1–1.
McLoughlin, T., Laramee, R. S., Peikert, R., Post, F. H., and
Chen, M. (2013). Over two decades of integration-
based, geometric flow visualization. Computer
Graphics Forum, 29(6):1807–1829.
Moorhead, R. J., Swan, J. E., Cai, S., Liu, Z., Martin, J. P.,
and Jankun-Kelly, T. J. (2012). A 2d flow visualiza-
tion user study using explicit flow synthesis and im-
plicit task design. IEEE Transactions on Visualization
and Computer Graphics, 18:783–796.
Morphet, W. J. and Symanzik, J. (2010). The circular
dataimage, a graph for high-resolution circular-spatial
data. International Journal of Digital Earth, 3(1):47–
71.
Rocha, A., Alim, U., Silva, J. D., and Sousa, M. C. (2017).
Decal-maps: Real-time layering of decals on surfaces
for multivariate visualization. IEEE Transactions
on Visualization and Computer Graphics, 23(1):821–
830.
Romat, H., Appert, C., Bach, B., Henry-Riche, N., and
Pietriga, E. (2018). Animated edge textures in node-
link diagrams: A design space and initial evaluation.
In Proceedings of the 2018 CHI Conference on Hu-
man Factors in Computing Systems, CHI ’18, pages
187:1–187:13, New York, NY, USA. ACM.
Sanna, A., Zunino, C., Montrucchio, B., and Montuschi,
P. (2002). Adding a scalar value to texture-based
vector field representations by local contrast analysis.
In Proceedings of the Symposium on Data Visualisa-
tion 2002, VISSYM ’02, pages 35–41, Aire-la-Ville,
Switzerland, Switzerland. Eurographics Association.
Scheepens, R., Hurter, C., Wetering, H. V. D., and Wijk, J.
J. V. (2016). Visualization, selection, and analysis of
traffic flows. IEEE Transactions on Visualization and
Computer Graphics, 22(1):379–388.
Stalling, D. and Hege, H.-C. (1995). Fast and resolution
independent line integral convolution. In Proceedings
of the 22nd annual conference on Computer graphics
and interactive techniques, pages 249–256. ACM.
Tversky, B., Morrison, J. B., and Betrancourt, M. (2002).
Animation: can it facilitate? International journal of
human-computer studies, 57(4):247–262.
Urness, T., Interrante, V., Marusic, I., Longmire, E., and
Ganapathisubramani, B. (2003). Effectively visual-
izing multi-valued flow data using color and texture.
In Proceedings of the 14th IEEE Visualization 2003
(VIS’03), VIS ’03, pages 16–, Washington, DC, USA.
IEEE Computer Society.
van Wijk, J. J. (2002). Image based flow visualization. ACM
Trans. Graph., 21(3):745–754.
van Wijk, J. J. and Telea, A. (2001). Enridged contour maps.
In Proceedings of the conference on Visualization’01,
pages 69–74. IEEE Computer Society.
Ware, C. (2009). Quantitative texton sequences for legible
bivariate maps. IEEE Transactions on Visualization
and Computer Graphics, 15(6):1523–1530.
Ware, C., Bolan, D., Miller, R., Rogers, D. H., and Ahrens,
J. P. (2016). Animated versus static views of steady
flow patterns. In Proceedings of the ACM Symposium
on Applied Perception, SAP ’16, pages 77–84, New
York, NY, USA. ACM.
Wegenkittl, R., Groller, E., and Purgathofer, W. (1997). An-
imating flow fields: Rendering of oriented line integral
convolution. In Proceedings of the Computer Anima-
tion, CA ’97, pages 15–, Washington, DC, USA. IEEE
Computer Society.
Wobbrock, J. O., Findlater, L., Gergle, D., and Higgins,
J. J. (2011). The aligned rank transform for nonpara-
metric factorial analyses using only anova procedures.
In Proceedings of the SIGCHI Conference on Human
Factors in Computing Systems, CHI ’11, pages 143–
146, New York, NY, USA. ACM.
IVAPP 2019 - 10th International Conference on Information Visualization Theory and Applications
296
