
A Reinforcement Learning Method to Select Ad Networks in Waterfall
Strategy
Reza Refaei Afshar, Yingqian Zhang, Murat Firat and Uzay Kaymak
School of Industrial Engineering, Eindhoven University of Technology, The Netherlands
Keywords:
Online AD Auction, Real Time Bidding, Ad Network, Supply Side Platform, Reinforcement Learning,
Predictive Model.
Abstract:
A high percentage of online advertising is currently performed through real time bidding. Impressions are
generated once a user visits the websites containing empty ad slots, which are subsequently sold in an online
ad exchange market. Nowadays, one of the most important sources of income for publishers who own websites
is through online advertising. From a publisher’s point of view it is critical to send its impressions to most
profitable ad networks and to fill its ad slots quickly in order to increase their revenue. In this paper we
present a method for helping publishers to decide which ad networks to use for each available impression.
Our proposed method uses reinforcement learning with initial state-action values obtained from a prediction
model to find the best ordering of ad networks in the waterfall fashion. We show that this method increases
the expected revenue of the publisher.
1 INTRODUCTION
Nowadays, online advertising plays a great role in the
income of a company who owns websites (i.e., pu-
blisher). The publisher can easily place ad slots on
its websites and increase its revenue by selling these
ad slots to advertisers. The traditional way of filling
ad slots involves publishers directly contacting adver-
tisers. However, this process is not efficient for both
stakeholders as it takes time and effort to find a proper
website or advertisement.
Real time bidding (RTB) is the process of provi-
ding advertisements for ad slots in a few milliseconds
through ad auction markets. In the ad auction sy-
stem, Supply Side Platforms (SSP) are developed to
help publishers in managing their ad slots and De-
mand Side Platforms (DSP) for assisting advertisers
in making advertisement campaigns. Ad networks are
entities between DSPs and SSPs. From the publis-
her side, whenever a user opens a website containing
an ad slot a request is sent to an ad network. The
outcome is either an advertisement filling the ad slot
successfully, i.e. impression, or a message showing
that this attempt was unsuccessful.
There are many ad networks that connect to diffe-
rent sets of advertisers through different DSPs. One
approach to choose a particular ad network given the
available ad slot is through the so called waterfall stra-
tegy (Wang et al., 2017). In the waterfall strategy, dif-
ferent ad networks in a list are tried sequentially to sell
an ad slot by sending ad requests. Ad requests conti-
nue till obtaining an advertisement unless a timeout is
encountered or the list is exhausted.
In common practice, the ordering of ad networks
is predefined and fixed based on experience of publis-
hers. However, this strategy is inefficient in terms of
time and revenue because often the first selected ad
networks cannot provide advertisements successfully.
This real time bidding process is completed in a
few milliseconds that takes a webpage to open. For
this reason, it is important not to waste time in making
unsuccessful requests to the ad networks. Besides,
publishers want to maximize their revenue obtained
through online advertising. Hence, maximizing the
revenue should be considered in selecting an ad net-
work as well. In this paper we focus on designing the
optimal ad network ordering to increase the revenue
and reduce the number of unsuccessful ad requests.
The ad network selection problem is a sequential
decision making problem. At each step, the decision
maker decides an ad network to send the ad request.
Then, a reward is received and the next state is de-
termined accordingly. Therefore, we model this pro-
blem as a reinforcement learning problem. In this mo-
del, the states are sets of ad requests and the actions
are different ad networks. We consider the sequences
256
Afshar, R., Zhang, Y., Firat, M. and Kaymak, U.
A Reinforcement Learning Method to Select Ad Networks in Waterfall Strategy.
DOI: 10.5220/0007395502560265
In Proceedings of the 11th International Conference on Agents and Artificial Intelligence (ICAART 2019), pages 256-265
ISBN: 978-989-758-350-6
Copyright
c
2019 by SCITEPRESS – Science and Technology Publications, Lda. All rights reserved

of requests for ad slot filling as episodes and we use
the Monte Carlo algorithm to learn state-action va-
lues based on averaging sample returns (Sutton et al.,
1998). Because there are not enough data to estimate
all state-action values, we use a prediction model to
find initial state-action values and use these initial va-
lues in the averaging part of Monte Carlo algorithm,
given a real bidding dataset provided by our industrial
partner. For each ad request, the prediction model out-
puts the probability of filling the ad slot when a cer-
tain ad network is selected. We then use these values
to find state-action values. Finally, using experiments
on real bidding dataset, we show that the expected re-
venue is increased if we choose ad networks based on
the state-action values.
This paper is structured as follows. Section 2 pre-
sents a brief literature review. In section 3 the propo-
sed method is discussed. The result of applying our
method to a real time bidding dataset is presented in
Section 4. Finally, in Section 5, we make our conclu-
ding remarks and discuss future work.
2 LITERATURE REVIEW
There is a lot of research on defining a method to in-
crease the publisher’s revenue through online adver-
tising. Most of them focus on setting the floor price
dynamically. There are few approaches considering
the ad networks ordering in the waterfall strategy. In
this section we review some of these works.
The process of programmatic advertising is de-
fined as the automated serving of digital ads in real
time based on individual ad impression opportunities
(Busch, 2016). Programmatic advertising helps pu-
blishers and advertisers to reach their goals and in-
crease the efficiency of online advertising. The pro-
grammatic buying and selling of ad slots prepares new
environment for publishers and advertisers to better
communicate with each other. Publishers may easily
find suitable advertisements for their ad slots while
advertisers may target suitable users, thus increasing
potential product sales and brand visibility (Wang
et al., 2017).
An important factor in determining publisher re-
venue is the reserve price. Reserve price or floor
price is the minimum price that a publisher expects
to obtain (Zhang et al., 2014). If it is too high and
no advertiser is willing to pay it, the advertisement
slot will not be sold, whereas if this price is set too
low the publisher’s profit is affected. For this reason,
specifying that price is important and adjustments in
reserve price may lead to increase in publisher reve-
nue. The adjustment of the reserve price is not a trivial
issue and has motivated a lot of research.
Wu et al. utilize a censor regression model to
fit the censor bidding data that a DSP suffers from
these censored information especially for lost bids
(Wu et al., 2015). Because the assumption of censo-
red regression does not hold on the real time bidding
data, they proposed a mixture model namely a combi-
nation of linear regression for observed data and cen-
sored regression for censored data, so as to predict the
winning price.
Xie et al. present a method in which the calcu-
lation of reserve price is based on their prediction of
distinguished top bid and the difference between top
bid and second bid (Xie et al., 2017). They have built
several families of classifiers and fit them with his-
torical data. They convert the identification of high
value inventories to a binary decision. They also con-
vert the gap between the top and the second bid to a
binary value, by assigning 1 for significant and 0 for
not significant difference compared to a threshold. In
the next step they use the idea of cascading (Quinlan,
1986) and try to reduce the false positive rate of the
prediction algorithm by combining the series of clas-
sifiers obtained before. They inspire (Jones and Viola,
2001) who follow the same basic idea with their own
feature and classification models. After predicting
whether the top bid is high or low and the difference
between top bid and second bid is significant or not,
they change the reserve price for high top bids. In
other research, the reserve price is predicted through
optimizing the weight of features (Austin et al., 2016).
In this paper, two vectors define feature values and fe-
ature weights respectively. The inner product of these
two vectors computes the value of the reserve price.
The main process lies in learning the feature weight
vector. For this purpose, they use gradient descent.
Yuan et al. model real time bidding as a dynamic
game and adjust the reserve price by following a game
between publisher and advertiser (Yuan et al., 2014).
The game is to increase or decrease the current va-
lue of reserve price based on the auction. There are
some other works in the context of optimizing the
floor price e.g. (Cesa-Bianchi et al., 2015).
The other research area that is the main topic of
this paper, is to choose proper ad networks in the wa-
terfall strategy. Finding the best ad network for each
user impression is a research topic which has gained
less attention in recent years in comparison to reserve
price optimization. However, it is an important topic.
Sometimes there is a contract between a publisher and
an ad network. There should be a balance between
selecting this ad network and other ad networks that
may achieve higher revenue (Muthukrishnan, 2009).
According to (Ghosh et al., 2009), when the number
A Reinforcement Learning Method to Select Ad Networks in Waterfall Strategy
257

of ad networks increases, the most important factor
in selection policy is the expected revenue. However,
sometimes the better ad network may not fill the ad
slot and the publisher should try other ad networks.
This latency in filling ad slots may have bad effects
on the performance of publishers website. In other
research, (Balseiro et al., 2014) optimize the trade-
off between the short-term revenue from ad exchange
and the long-term benefits of delivering good spots
to the reservation ads. They formalize this combined
optimization problem as a multi-objective stochastic
control problem. In (Rhuggenaath et al., 2018), the
authors study a variant of the ad allocation problem
to help online publisher to decide which subset of
advertisement slots should be used in order to fulfill
guaranteed contracts and which subset should be sold
on SSPs in order to maximize the expected revenue.
They propose a two-stage stochastic programming ap-
proach to formulate and solve the display-ad alloca-
tion problem.
Reinforcement learning in real-time bidding is
also one of the hot topics during the last few years.
However, most of the research in this field is from the
advertiser’s point of view. In research done by (Ven-
gerov, 2007), a reinforcement learning algorithm is
proposed to determine the best bidding strategy. In ot-
her approaches, a reinforcement learning framework
is used for assisting advertiser bidding (Cai et al.,
2017) . In the work of (Nanduri and Das, 2007) the
focus is again on the bidder side. The focus of the
work we discuss in our paper lies rather in the publis-
her side.
3 METHODOLOGY
In this section we present our method to select the
most profitable ad network for each set of information
about an ad request. We use reinforcement learning to
find an ordering of ad networks in the waterfall stra-
tegy that fills the ad slots in the shortest time and with
the highest revenue.
We use reinforcement learning to derive the best
ordering, namely the one maximizing expected re-
venue. In reinforcement learning, an agent learns
through interaction with the environment and estima-
tes the value of each action in each state. Basically
the agent observes the current state of the environ-
ment and decides which action to take. However, the
publishers do not have access to the real time bidding
system. Due to this limitation it is not possible to ex-
plore the state-action space and evaluate our method
in the real environment. Therefore, we use histori-
cal data and consider each sequence of ad requests to
fill a certain ad slot as an episode. We estimate the
state-action values for those pairs of states and acti-
ons that are observed in our historical data. In order
to model an ad network selection problem as a rein-
forcement learning problem, we need to define sta-
tes, actions, reward function, algorithms for learning
state-action values and action selection policy (Sutton
et al., 1998).
3.1 States
Features in ad requests influence the bidding process
and an advertiser uses them and decides whether to
bid or not. Therefore, states should be related to the
ad requests. One approach to define a state is to consi-
der each unique ad request as an individual state. This
approach is not efficient because sometimes there is
no data sample for some pairs of states and actions.
If the data comes from a waterfall strategy, whereby
the ad requests are sent to the ad networks in a pre-
defined order, then there is only one observed action
for almost all the states. Hence, the problem is to find
the best ordering of one ad network which is already
solved. There is a trade-off in defining the states. On
one hand, if the states are more specific, there is not
enough ad requests in the RTB data obtained from
a predefined ordering of ad networks. On the other
hand, if each state contains large number of ad reque-
sts, the approach is similar to the predefined ordering
because the method selects the same action for large
number of ad requests.
In order to solve this problem, we select some of
the features and partition their values into intervals to
define the states. In our preliminary work, we tested
different subsets of features and different thresholds
on their values to find the states. Among them, the
combination of ad tag id, floor price and request order
make a balance between the number of states and the
number of observed ad networks for each state. Table
1 contains the definition of these features. We also
set two thresholds named t
f p
for floor price and t
ro
for request order to group ad requests based on these
thresholds. In the new states, values of floor price
are divided into two categories: below t
f p
and over
t
f p
. The same approach has been followed for request
order: below t
ro
and over t
ro
. Equation (1) defines the
states in our model.
s(x
i
) = (
Ad tag id(x
i
),
f loor price range(x
i
),
request order range(x
i
)
),
x
i
∈ D : i
th
ad request,
(1)
ICAART 2019 - 11th International Conference on Agents and Artificial Intelligence
258

f loor price range(x
i
) =
(
0 i f f loor price(x
i
) ∈ [0,t
f p
)
1 i f f loor price(x
i
) ∈ [t
f p
,m
f
]
(2)
request order range(x
i
) =
(
0 i f request order(x
i
) ∈ [0,t
ro
)
1 i f request order(x
i
) ∈ [t
ro
,m
r
]
(3)
m
r
= max
x
i
∈D
(request order(x
i
)) (4)
m
f
= max
x
i
∈D
( f loor price(x
i
)) (5)
where m
f
and m
r
indicate the maximum values for
floor price and request order in the RTB data. D con-
tains all of the ad requests that we use for our method.
3.2 Actions
The objective of our method is to decide which ad
network will be better in case of time and revenue.
Hence, in the reinforcement learning modeling of real
time bidding problem, the actions stand for selecti-
ons of ad networks. In each state, the model decides
which ad network makes the most revenue in the shor-
test time. There are N possible ad networks and each
ad request could be sent to any one of them. Usu-
ally ad networks are selected in some predefined order
depending on different situations by human decision
makers. Therefore, the number of samples for each
state-action pairs is different. In sum, the actions are
ad networks and there are at most N possible actions
in each state.
Equation (6) is the definition of the possible acti-
ons in each state. Since some combinations of states
and actions do not exist in the historical data, the acti-
ons set of each state is a subset of all actions.
a(x
i
) ∈ {a
1
,a
2
,...,a
N
} (6)
In this formulation a
1
,...,a
N
are ad networks. Ba-
sed on these definitions of states and actions, there
are more than one action for each state in historical
data. Therefore, the problem is the ordering of these
actions. Figure 1 illustrates the formation of a sample
state and actions.
Equation (7) defines the ad requests for each state-
action pair. In this equation, D(s,a) is the list of ad
requests that their corresponding state and action are
(s,a).
D(s,a) = {x
i
∈ D|(s(x
i
),a(x
i
)) = (s,a)} (7)
Figure 1: State and Actions.
3.3 Reward Function
We consider two objectives at the same time to decide
which action is better. High revenue is the first ob-
jective. The second one is providing advertisements
as soon as possible. Hence, a publisher should select
an action that has the most success probability and
highest expected revenue. As we cannot observe the
actual revenue of selling one impression
1
and the floor
price is the lower bound of revenue for an impression
(ad request with event state = 1), we assign the value
of floor price as the reward of successful ad reque-
sts. Conversely, unsuccessful attempts are penalized
by the value -1. This forces the agent (SSP) to find the
advertisement in the shortest time possible. Equation
(8) defines the reward function of our model.
Reward
x
i
(s,a) =
(
−1 i f event state(x
i
) = 0
f loor price(x
i
) i f event state(x
i
) = 1
x
i
∈ D(s,a) (8)
f loor price and event state come from the ad re-
quest x
i
.
3.4 Finding Initial Values for
Reinforcement Learning Algorithm
Because many of the SSPs select ad networks in a
predefined order, usually there are not enough data to
estimate all state-action values. For this reason we
build a prediction model to estimate an initial value
for all state-action values.
In order to find initial state-action values, we first
find the success probability of sending requests to a
certain ad network. We use supervised learning met-
hods. The feature vector contains information related
1
This is the case for online publishers who rely on SSPs
to sell their impressions.
A Reinforcement Learning Method to Select Ad Networks in Waterfall Strategy
259

Table 1: Information in each ad request.
Field name Definition Type
Event state The result of attempt: 0: fail, 1: success Numerical
Timestamp time of ad request (hour of a day) Numerical
Opportunity order shows how many times a user has entered our system Numerical
Country code A code specify country of the user visiting publishers website. Nominal
Ad tag id A unique string corresponds to an advertisement slot Nominal
Ad network id Id of each ad network (Ad exchange, AdSense, AOL, ) Nominal
Referrer URL URL of the server that shows the ad Nominal
Referrer domain Domain of the server that shows the ad Nominal
Page URL URL of the webpage containing the ad slot Nominal
Page domain Domain of publishers website Nominal
Device name Name of user device Nominal
OS name Users operating system Nominal
Browser name Users browser Nominal
Floor price The amount of floor price (reserve price) Numerical
Request order Order of current attempt in a sequence of attempts. Numerical
to the ad request and the target value is whether se-
lecting an ad network will provide an advertisement
or not.
The dataset is provided by an online publisher,
which contains ad requests that are the information
of interactions between a publisher and ad networks
to fill the ad slots. The publisher is an entertainment
company website, using ad networks such as Google
ad exchange, AOL and SpotX to sell their ad slots.
Each webpage of this website has some advertising
slots which should be filled with ads provided by the
ad networks. In the dataset there are lots of different
ad requests. The majority are unsuccessful attempts
in finding an advertisement and the rest are impressi-
ons. Table 1 illustrates the features of an ad request in
our data.
Our feature vector is a selected subset of the fe-
atures illustrated in Table 1, which has shown to
provide the best prediction after experimentation.
The most promising combination of features contains
floor price, time, ad tag id, request order, ad networks,
page domain, device name, operating system, oppor-
tunity order, browser name and URL. From the time
feature, we consider the hour of a day. In Table 1, the
Type attribute indicates the data type: numerical or
nominal. We use one-hot encoding method to convert
nominal data to numerical (Harris and Harris, 2010).
The one-hot encoder assigns a data column for each
value of each nominal data. Hence, there are many
columns for features that accept wide range of values.
For instance, there are many thousands URLs in the
dataset and if we use one-hot encoder to convert va-
lues of this feature into numerical data, the length of
feature vector will be very high. To overcome this
problem, we use a subset of values for each nominal
feature. First, we count the frequency of each nominal
value in our dataset and we sort the results by inver-
ted frequency, i.e. highest first. We then keep those
values with high frequencies and group the rest under
a single value name, e.g. low frequency.
The prediction model is applied on a subset of the
dataset. This subset contains only those samples that
are in a sequence which the event state of its last ad
request is one. In other words, each sequence of ad
requests of each ad slot contains a set of data sam-
ples that is sorted by request order and the request
order of the first sample is 1. Usually, datasets do not
contain explicit information about sequences of ad re-
quests. Hence, we need to infer them. We extract the
sequences by comparing the feature values of ad re-
quests that are sent within a very small difference in
time. If two ad requests sent within few milliseconds
differ only in floor price, ad network and request or-
der, while the rest of the values are the same, then we
consider them as different sequential attempts to fill
the same ad slot. For this purpose, we start by sor-
ting the ad requests by date and time. Then, we make
separate lists for each sequence and gradually insert
each data sample to the appropriate list. Initially all
lists are empty. We start from the first ad request of
the sorted dataset and add it to the first list. At each
stage, we compare the current add request with the
last ad request of all lists. If there is a list where the
last ad request has the same values with the current
except for a lower value in request order, then this
new ad request is added to that list. There should be
ICAART 2019 - 11th International Conference on Agents and Artificial Intelligence
260

at most one ad request with event state equal to 1 for
each sequence. Thus, a list is closed, whenever an
impression is added. Using this method we managed
to retrieve almost all ad request sequences. After this
process, there are some sequences without an impres-
sion. Since we do not have any information about
why these sequences are incomplete, we treat them as
errors and all such incomplete sequences are removed
from the dataset. The new dataset contains only those
sequences that end with an ad request with event state
equal to one.
The prediction task is to classify each ad request
into one of two classes: 0 for unsuccessful and 1 for
successful. In other words, the target is the value of
the event state and the objective of the prediction mo-
del is to predict this value.
Event state is a binary variable. The classifier re-
ceives an ad request and finds the probability of event
state equal to one for that ad request. Hence, for each
ad request containing an ad network id, we obtain a
probability which determines the likelihood of filling
the ad slot. The multiplication of this probability to
the floor price of the current ad request yields the ex-
pected lower bound for the revenue of the ad request.
Equation (9) shows this expected lower bound of re-
venue.
E[R(x
i
,a(x
i
))] =
P(event state(x
i
) = 1|x
i
,a(x
i
))
× f loor price(x
i
) (9)
In this equation x
i
is an ad request, a(x
i
) is the ad
network id of x
i
, event state(x
i
) is the event state of
x
i
and shows whether this ad request is successful or
not, P(event state(x
i
) = 1) is the success probability
acquired from the prediction model, f loor price(x
i
)
is the floor price of x
i
, and E[R] is the expected lower
bound of the revenue when ad request x
i
is successful.
Because the revenue is zero for event state = 0, it is
not written in the equation. Through this formula we
can find an initial value for state-action pairs.
These initial values are not sufficient for deciding
which action to take because there is no information
about the long term revenue in these values. In ot-
her words, these values are just useful to find the ad
network that will provide the advertisements in the
shortest time. For instance, if the success probability
of an ad network is 0.9, the floor price is 0.5 and the
request order is 1, this method does not care about the
revenue that another ad network may make when this
request fails. To consider long term revenue as well as
time, we model the problem as a reinforcement lear-
ning problem. For this reason we merely use these as
initial values in the reinforcement learning process.
Then, the reinforcement learning process takes into
consideration the long term revenue when selecting
ad networks.
The revenue obtained from (9) is used for learning
state-action values. As we said before, we need these
values because there are not enough data to compute
all state-action values.
3.5 Learning State-action Values
SSPs in each state act as agents and select one of the
ad networks to send the ad request. Based on the event
state, the reward might be -1 or the value of floor
price. The problem is episodic where, as explained
in section 3.4, each episode consists of an ad request
sequence. We use a policy Monte Carlo method to
learn state action values. In the Monte Carlo algo-
rithm, state-action values are obtained through avera-
ging over all observed values in the episodes. Since in
each episode there is at most one occurrence of a cer-
tain state-action pair, the first visit Monte Carlo can
do well (Sutton et al., 1998).
We change the Monte Carlo algorithm in order to
fit with our objectives. In our approach, the revenue
lower bound (as discussed in Section 3.4) is consi-
dered in the averaging. The number of data samples
used for prediction model is used as a weight for these
initial values. The Monte Carlo algorithm yields the
expected revenue of each state-action pair. The mo-
dified averaging part of the Monte Carlo algorithm is
defined in (10).
Q(s,a) =
(
n
1
(s,a)
∑
j=1
Reward
x
i
j
(s,a)+
E[R(x
i
,a)]× n
2
(s,a))
/(n
1
(s,a)+ n
2
(s,a)),
s.t. x
i
∈ D(s,a) (10)
Where n
1
(s,a) is the number of s(x
i
) and a(x
i
)
pair in the data samples observed so far, and n
2
(s,a)
is the number of s(x
i
) in the dataset used for initiali-
zation when its ad network id is a(x
i
). In other words,
n
1
(s,a) is the length of D(s,a). Before computing the
average and updating Q(s,a), the current ad request
should be added to D(s,a).
The final output of this method is the state-action
values. The publisher can decide which ad networks
to send the ad requests to achieve the maximum ex-
pected revenue in the shortest time. In the next
section, we discuss the results and evaluate our met-
hod by comparing the expected rewards using our
method to actual revenues obtained in the dataset. Fi-
gure 2 provides an overview of our proposed method.
A Reinforcement Learning Method to Select Ad Networks in Waterfall Strategy
261

Figure 2: Proposed method for learning the expected revenue of selecting each ad network in each state. First, some of ad
requests are used by the prediction model to find an expected lower bound of the revenue. Then, we use these expected values
and new ad requests to find state-action values through Monte Carlo algorithm. Finally, greedy action selection policy will
select the best action in each state.
4 EXPERIMENTS AND RESULTS
In this section, the results of our proposed method on
real time bidding auction data are discussed. The met-
hod requires initial state-action values and uses the ad
requests to learn final values for state-action pairs. For
the evaluation of the initial values obtained from the
prediction model, we use binary classification perfor-
mance measures. Since it is not feasible to test our
method in the real environment, we compare the ex-
pected revenue of selecting the action with the highest
value for each state with the actual revenue obtained
from the historical data. We consider the floor price
as a lower bound of revenue for impressions.
The dataset D contains the ad requests of one
week (20-26 November 2017) for users in the Net-
herlands. We use some part of this dataset for fin-
ding the initial state-action values and the rest for the
Monte Carlo algorithm. The attributes of our dataset
are shown on Table 1.
4.1 Initial Values Evaluation
In this section we discuss the result of event state pre-
diction on the dataset that does not contain any in-
complete sequences. As we will see, if we ensure that
there is not any incomplete sequence of attempts, we
can predict the ad network response to a request with
an acceptable precision.
As we mentioned earlier, we have seven datasets
that each one corresponds to a day of week in the pe-
riod of 20th to 26th of November 2017. Briefly spea-
king, the prediction model is a classifier that labels
each data sample with 0 or 1. A zero value denotes
that this attempt to get an advertisement from speci-
fied ad network will not be successful. Conversely, if
the prediction result is one, then the request to this ad
network will result in filling the advertising slot. Our
classifier is evaluated for this task using standard clas-
sification performance measures, namely precision,
recall, F1 score, kappa and ROC curve.
Through applying the data preparation explained
in section 3.4, the feature vector consists of 673 fea-
tures. We tested different classification methods such
as Bayesian classifier, support vector machine and
random forest classifier. We finally opted for the
random forest classifier as it has shown to achieve the
best performance on our data.
In each sequence of ad requests there is only one
impression which is always the last ad request of each
sequence. Therefore, the number of requests with
event state equal to 0 is far larger than the number
of impressions. In order to balance the dataset, there
are various approaches. For example, the SMOTE
NC is reported to be a good method for oversam-
pling (Chawla et al., 2002). However, this method
does not consider the dependencies between features.
For instance, if the browser of all ad requests from
a given user is Chrome but the prevalent browser of
the nearest neighbors is Firefox, then sampling using
SMOTE NC would result in an incorrect sample com-
bining this user characteristics to Firefox. Because
ICAART 2019 - 11th International Conference on Agents and Artificial Intelligence
262

Table 2: Performance measures for prediction model.
Event state = 1 Nov 20 Nov 21 Nov 22 Nov 23 Nov 24 Nov 25 Nov 26
Precision 0.7388 0.7668 0.7468 0.7382 0.7816 0.7991 0.8012
Recall 0.7165 0.7291 0.6781 0.6967 0.7486 0.7598 0.7662
F1 0.7275 0.7475 0.7108 0.7168 0.7647 0.7790 0.7833
Accuracy 0.7314 0.7549 0.7240 0.7261 0.7700 0.7844 0.7879
Kappa 0.4628 0.5098 0.4480 0.4521 0.5400 0.5689 0.5758
Figure 3: ROC curve for 7 datasets.
the number of samples per day are too high (about 1
million), oversampling makes the dataset very large
and loading the data for the classifier is not practical.
The samples with event state 1 are more important in
our prediction model because they provide the initial
state-action values for our method. For this reason,
we opted for the random under-sampling method for
balancing our dataset (Japkowicz et al., 2000). Using
this sampling method prevents information loss, be-
cause these values are initial state-action values and
the rest of data samples containing incomplete se-
quences will be used in the Monte Carlo algorithm.
Table 2 contains the performance measures of the
prediction model. We applied the classifier separately
on each day. For each day, we considered a holdout
cross validation with 20% of the sequences as a test
set and the remainder as the training set. As illustrated
in Table 2, if there is not any incomplete sequences we
can predict whether an ad request will provide an ad-
vertisement or not with a good F1 score (above 0.7).
Figure 3 shows the ROC curves of predicting impres-
sions (event state = 1) for seven consecutive days. The
average value of AUC for these seven dataset is 0.74.
The success probabilities for each ad network may
be obtained with a good precision when there is not
any incomplete sequences. Through multiplying the
probability of event state = 1 for each ad request and
ad network to the value of f loor price of that ad re-
quest, a lower bound of revenue is obtained.
4.2 State-action Values Evaluation
The application of reinforcement learning modeling
to our dataset, as explained in Section 3, resulted in
almost 3000 states and 5 actions. We use the initial re-
venue obtained from the prediction model as a weig-
hted value in the averaging step of the Monte Carlo
algorithm. There are about 1 million ad requests per
day. For this reason, it is not possible to load all the
data in the memory and perform the prediction pro-
cedure. However, because the reinforcement learning
step requires merely one sequence at a time, we do
not have to load all data into memory and we are thus
able to process a large number of data samples.
As mentioned before, the dataset contains the ad
requests of one week. The episodes used in the Monte
Carlo algorithm are obtained by considering the chro-
nological ordering of ad requests. We used the ad re-
quests of 20
th
of November for the initialization and
found initial state-action values. Then, we used the
data samples of the next five days in the Monte Carlo
algorithm. Finally, we compared the real revenue (ba-
sed on sum of the values of floor prices for ad reque-
sts with eventstate = 1 as a lower bound for revenue)
with the expected revenue that is based on a greedy
policy with respect to the state-action values.
To determine the threshold values t
f p
and t
ro
, we
tested different values and found that 6 as floor price
threshold and 3 as request order threshold make the
best balance between the number of states and the
number of observed actions for each state. Figure 4
illustrates the cumulative revenue prediction for the
test dataset (red curve) compared to the real revenue
earned (blue curve). The ad requests of November
26 were used for testing the method. As you can see
in the figure, there is noticeable difference between
the two curves. For each episode, we considered only
the first ad request, because the state-action value of
each state-action pair is the expected revenue of a se-
quence starting from that state. Therefore, if a SSP
A Reinforcement Learning Method to Select Ad Networks in Waterfall Strategy
263
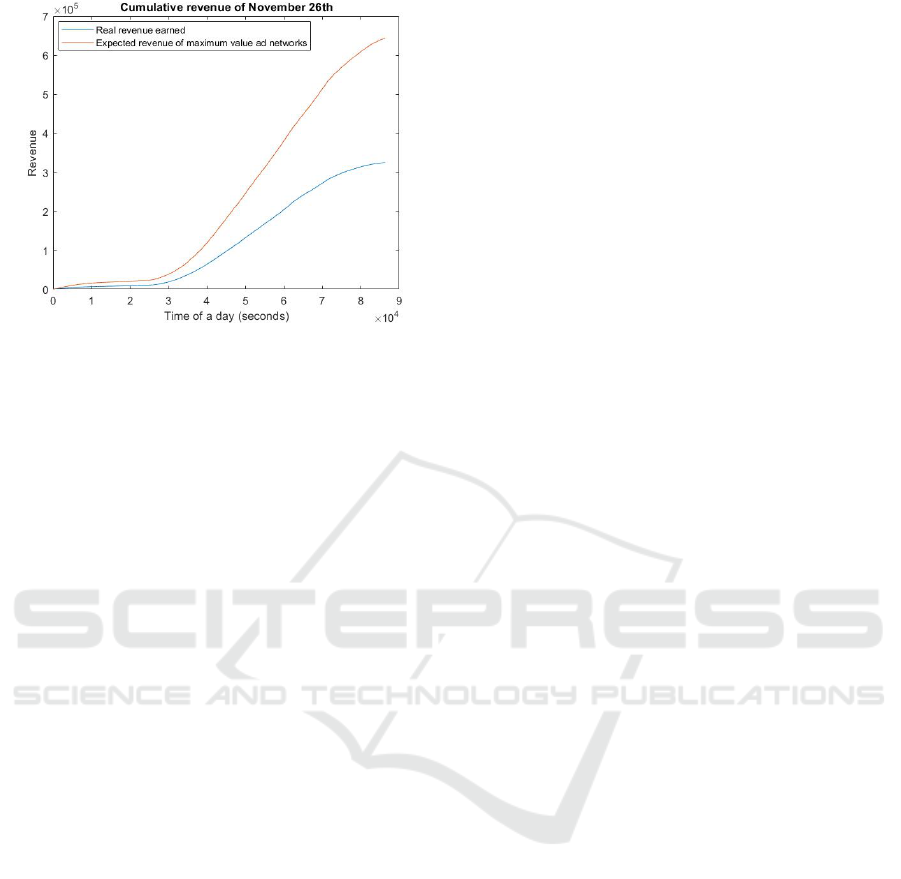
Figure 4: Expected revenue vs. real revenue.
acts greedily with respect to the state-action values
and selects the ad network with the highest value, the
resulting revenue would be far more than following
the predefined ordering approach.
Theoretically there are huge differences between
these two values which indicate the potential of our
proposed method. In the future we will test it on the
real platform and compare the theoretical results with
the observed ones.
5 CONCLUSIONS
We proposed an ad network ordering method in wa-
terfall strategy based on reinforcement learning. We
modeled ad requests as states and ad networks as acti-
ons. Then, we estimated the state-action values using
Monte Carlo algorithm. When a user visits a web
page of a publisher, the ad network that gives the hig-
hest state-action value is chosen for making the first
ad request. If this request does not get an impression,
then the next ad network is chosen among the remai-
ning ones maximizing the state-action values. This
continues till an impression is obtained.
Our experimental results using real data show that
our approach could help publishers not only to fill
their ad slots in the shortest time, but also to incre-
ase their revenue.
We use Monte Carlo algorithm to learn the state-
action values. This algorithm is useful when there
are enough episodes for each state-action pairs in the
data, which is often not the case. As future rese-
arch, we will investigate function approximation al-
gorithms for finding the state-action values which are
not observed in the data (Sutton et al., 1998), (Sze-
pesv
´
ari, 2010).
In addition, there is an interesting research que-
stion on how the developed prediction models influ-
ence the subsequent decision making, e.g., (Verwer
et al., 2017). In the future, we will experiment the sig-
nificance of each component of our method to find out
dependencies between each component and how they
effect the performance of the ad network selection
problem.
ACKNOWLEDGMENT
This work was supported by NWO (project
628.010.001) and EU EUROSTARS (Project E!
11582).
REFERENCES
Austin, D., Seljan, S., Monello, J., and Tzeng, S. (2016).
Reserve price optimization at scale. In 2016 IEEE 3rd
International Conference on Data Science and Advan-
ced Analytics (DSAA), pages 528–536. IEEE.
Balseiro, S. R., Feldman, J., Mirrokni, V., and Muthu-
krishnan, S. (2014). Yield optimization of display
advertising with ad exchange. Management Science,
60(12):2886–2907.
Busch, O. (2016). The programmatic advertising principle.
In Programmatic Advertising, pages 3–15. Springer.
Cai, H., Ren, K., Zhang, W., Malialis, K., Wang, J., Yu, Y.,
and Guo, D. (2017). Real-time bidding by reinforce-
ment learning in display advertising. In Proceedings
of the Tenth ACM International Conference on Web
Search and Data Mining, pages 661–670. ACM.
Cesa-Bianchi, N., Gentile, C., and Mansour, Y. (2015). Re-
gret minimization for reserve prices in second-price
auctions. IEEE Transactions on Information Theory,
61(1):549–564.
Chawla, N. V., Bowyer, K. W., Hall, L. O., and Kegel-
meyer, W. P. (2002). Smote: synthetic minority over-
sampling technique. Journal of artificial intelligence
research, 16:321–357.
Ghosh, A., McAfee, P., Papineni, K., and Vassilvitskii, S.
(2009). Bidding for representative allocations for dis-
play advertising. In International Workshop on Inter-
net and Network Economics, pages 208–219. Sprin-
ger.
Harris, D. and Harris, S. (2010). Digital design and compu-
ter architecture. Morgan Kaufmann.
Japkowicz, N. et al. (2000). Learning from imbalanced
data sets: a comparison of various strategies. In AAAI
workshop on learning from imbalanced data sets, vo-
lume 68, pages 10–15. Menlo Park, CA.
Jones, M. J. and Viola, P. (2001). Robust real-time object
detection. In Workshop on statistical and computatio-
nal theories of vision, volume 266, page 56.
Muthukrishnan, S. (2009). Ad exchanges: Research issues.
In International Workshop on Internet and Network
Economics, pages 1–12. Springer.
ICAART 2019 - 11th International Conference on Agents and Artificial Intelligence
264

Nanduri, V. and Das, T. K. (2007). A reinforcement le-
arning model to assess market power under auction-
based energy pricing. IEEE transactions on Power
Systems, 22(1):85–95.
Quinlan, J. R. (1986). Induction of decision trees. Machine
learning, 1(1):81–106.
Rhuggenaath, J., Zhang, Y., Akcay, A., and Kaymak, U.
(2018). Optimal display-ad allocation with guaranteed
contracts and supply side platforms. Working paper.
Sutton, R. S., Barto, A. G., et al. (1998). Reinforcement
learning: An introduction. MIT press.
Szepesv
´
ari, C. (2010). Algorithms for reinforcement lear-
ning. Synthesis lectures on artificial intelligence and
machine learning, 4(1):1–103.
Vengerov, D. (2007). A gradient-based reinforcement
learning approach to dynamic pricing in partially-
observable environments.
Verwer, S., Zhang, Y., and Ye, Q. C. (2017). Auction opti-
mization using regression trees and linear models as
integer programs. Artificial Intelligence, 244:368–
395.
Wang, J., Zhang, W., Yuan, S., et al. (2017). Display ad-
vertising with real-time bidding (rtb) and behavioural
targeting. Foundations and Trends
R
in Information
Retrieval, 11(4-5):297–435.
Wu, W. C.-H., Yeh, M.-Y., and Chen, M.-S. (2015). Pre-
dicting winning price in real time bidding with censo-
red data. In Proceedings of the 21th ACM SIGKDD In-
ternational Conference on Knowledge Discovery and
Data Mining, pages 1305–1314. ACM.
Xie, Z., Lee, K.-C., and Wang, L. (2017). Optimal reserve
price for online ads trading based on inventory iden-
tification. In Proceedings of the ADKDD’17, page 6.
ACM.
Yuan, S., Wang, J., Chen, B., Mason, P., and Seljan, S.
(2014). An empirical study of reserve price optimi-
sation in real-time bidding. In Proceedings of the
20th ACM SIGKDD international conference on Kno-
wledge discovery and data mining, pages 1897–1906.
ACM.
Zhang, W., Yuan, S., and Wang, J. (2014). Optimal real-
time bidding for display advertising. In Proceedings
of the 20th ACM SIGKDD international conference on
Knowledge discovery and data mining, pages 1077–
1086. ACM.
A Reinforcement Learning Method to Select Ad Networks in Waterfall Strategy
265
