
A Graphical User Interface for an Automatic Rest-activity Cycle
Detection and Dichotomy Index Computation
Racha Soubra
1
, Aly Chkeir
1
, Mohammad O. Diab
2
, Majd Abdallah
1
and Jacques Duchene
1
1
University of Technology of Troyes, France
2
Rafik Hariri University, Meshref, Lebanon
Keywords: Circadian Rhythm, Rest-activity Cycle, Dichotomy Index, Graphical User Interface (GUI).
Abstract: The success of chemotherapy treatment is achieved based on “Chronotherapy”: the concept of administering
the correct drug at a precise time based on the circadian rhythm study. This paper aims to detect the
rest/activity cycle and automatically calculate the dichotomy index (I<O), as both parameters have been
proved to be reliable indices of the circadian rhythm. First, the DARC “Détection Automatique du Rythme
Circadien” algorithm is used to segment the rest-activity phases automatically. Then, a Graphical User
Interface (GUI) is used to calculate easily the I<O across several days of records and smooth the analysis. The
outcome of this study provides an easy-to-use GUI that minimizes patients’ intervention, facilitates user
involvement, and reduces the time required for analysis.
1 INTRODUCTION
The endogenicity of the circadian rhythm persists in
constant environment in microorganisms, plants and
in all kinds of animal species including man (Levi
2006). These endogenous rhythms manage daily
events such as sleep, activity, hormonal secretion,
cellular proliferation and metabolism (Levi 2006).
Scientists have shown that the rest-activity cycle is a
reliable marker of the circadian system function.
locomotor activity dependably reflects the circadian
clock function in several animal species like rodents
and man. It is evident that researchers focus their
work on examining the circadian rest-activity rhythm
disturbances among patients with several diseases
mainly cancer. For instance, Mormont, M. and Levi,
F. documented the link between the rest-activity
rhythm and the welfare of cancer patient (Mormont
and Levi 2003). In their study, it was clear that the
circadian rhythm tends to be lost in the rapidly
growing or advanced stage of tumors. Similarly, in
Levin, R. et al research study, the rest-activity
circadian function differs significantly between
patients with advanced non-small-cell lung cancer
and control subjects (Levin, Daehler et al. 2005).
Outcomes have shown that patients suffer poor sleep
quality and high levels of fatigue. In addition,
Mormont, M.et al found that patients with poor
circadian rhythmicity had a 5-fold higher risk of
dying within 2 years than the patients with a better
circadian rhythm (Mormont, Waterhouse et al. 2000).
Consequently, the rest-activity rhythm is a
determinant of quality of life. Its level of disturbance
can be set as a reference for anti-cancer efficacy and
tolerability. Therefore, the rest-activity rhythm can
provide additional prognostic information regarding
patients’ response to treatment and maximum
survival potential since it reflects tumor burden and
patient general conditions (Mormont, Waterhouse et
al. 2000, Mormont and Levi 2003, Rich, Innominato
et al. 2005).
Moreover, the circadian or rest-activity disruption
in patient with cancer is the result of chronic illness
development and worsening of pre-existing
conditions (Ortiz-Tudela, Martinez-Nicolas et al.
2010). However, these disruptions can resulted from
a “wrongly timed or excessively dosed
chemotherapy”. Scrully, C. et al proved that the
circadian timing of anti-cancer medications improves
treatment tolerability up to fivefold and doubles the
efficacy in experimental and clinical studies (Scully,
Karaboué et al. 2011). Therefore, the time-qualified
chemotherapy, known as by “Chronotherapy”, is an
essential element for cancer treatment. It guarantees
improved cancer-treatment and optimizing the
development of new anticancer or supportive agents
(Mormont, Waterhouse et al. 2000, Levi 2001).
340
Soubra, R., Chkeir, A., Diab, M., Abdallah, M. and Duchene, J.
A Graphical User Interface for an Automatic Rest-activity Cycle Detection and Dichotomy Index Computation.
DOI: 10.5220/0007395803400344
In Proceedings of the 12th International Joint Conference on Biomedical Engineering Systems and Technologies (BIOSTEC 2019), pages 340-344
ISBN: 978-989-758-353-7
Copyright
c
2019 by SCITEPRESS – Science and Technology Publications, Lda. All rights reserved

Personalized cancer chronotherapeutics encourage
the cell division cycle and the pharmacology
pathways to improve patients’ quality of life and
survival (Lévi, Filipski et al. 2007). Thus, the
circadian rhythm needs to be explored on large scale,
and circadian biomarkers should be calculated to
estimate the incidence of cancer-associated circadian-
system alterations.
The most effective parameter that can correlates
with the quality of life is the dichotomy index (I<O)
(Mormont, Waterhouse et al. 2000, Innominato,
Focan et al. 2009, Natale, Innominato et al. 2015).
This latter represents the percentage of the activity
counts measured when the patient is in bed that are
inferior to the median of the activity counts measured
when the patient is out of bed. This index can
theoretically vary between 0 and 100%, where high
I<O reflects a marked rest/activity rhythm.
In order to record rest-activity cycle, the majority
of recent studies used wrist actigraphy; a wearable
device used to measure the activity motors. On the
other hand, various techniques were used to calculate
the I<O. For instance, in Mormont, M. et al study, the
calculation was done manually where each patient
had kept a diary for times of rising and retiring during
the diagnosis (Mormont, Waterhouse et al. 2000).
Scrully, C. et al and Ortiz-Tudela, E. et al have used
square and mean waveform techniques respectively
which resulted as a poor biomarkers (Innominato,
Focan et al. 2009, Ortiz-Tudela, Martinez-Nicolas et
al. 2010). In Ortiz-Tudela, E. et al study, patients
were requested to give an informed consent and to
complete a sleep and feeding log during the days of
recording (Ortiz‐Tudela, Iurisci et al. 2014). Finally,
some patients were demanded to push an event-
marker button on the wearable device to mark
occurrences of time in and out of bed such as Natale,
V. et al research (Natale, Innominato et al. 2015).
In this study, we aim to detect the rest- activity
cycle automatically and calculate the I<O while
minimizing the intervention of patients and
smoothing the interference of physicians. After data
acquisition, I<O was calculated automatically based
on DARC algorithm. Then, a graphical user interface
(GUI) was performed to detect and calculate
automatically rest-activity cycle and I<O.
2 METHODOLOGY
2.1 Database
Our study is based on 9 control subjects (5 females
and 4 males) aged 40 ± 10.6 years. After receiving a
detailed description of the objectives and
requirements of the study, the participants wore the
infrared sensor “Movisens GmbH - move II”. The
move II sensor consists of a tri-axial acceleration
sensor (adxl345, Analog Devices; range: ±8 g;
sampling rate: 64 Hz; resolution: 12 bit) and a
temperature sensor (MLX90615 high resolution
16bit ADC; resolution of 0.02°C). This sensor was
patched onto the participants’ upper right anterior
thoracic areas by means of a hypoallergenic patch
for a minimum of three consecutive days. It only
weighs 32 g, and measures 5.0 x 3.6 x1.7 cm3. The
recorded data is saved on a memory chip inside the
sensor and transferred to a server via the General
Packet Radio Service (GPRS). Three signals were
available:
Zero Crossing Mode (ZCM) signal:
representing the human activity in function of
time, with 1 record per minute
Body Position: representing the human body
slope with respect to the vertical x-axis, with 1
record per minute
Body Temperature: representing the human
body temperature, with 1 record every 5
minutes
2.2 Rest/Activity Cycle Detection
In this study, the automatic detection of rest/activity
cycle is achieved based on the “Détection
Automatique du Rythme Circadien” (DARC)
algorithm (Chkeir et al. 2017). Six phases summarize
our work, and for confidential reasons, it will be
discussed generally in a brief way.
First, as we have one record of body temperature
each 5 minutes and one record per minute for each of
body position and ZCM signals, the Polynomial
Cubic Spline method is used to interpolate the
temperature signal, so we get an equal number of
records between signals. The interpolated
temperature signal intervenes as a reference to check
if the sensor is worn or not. The algorithm will
directly eliminate the body position and ZCM records
when sensor is not worn. In case the sensor is worn
upside down, the algorithm will correct the Body
Position signal: when X is greater than 90, the value
will be replaced by 180-X.
Subsequently, all outlier points that could
appear in the signals will be eliminated based on
the median filter techniques. After that, the method
cited in the DARC Brevet automatically operates
A Graphical User Interface for an Automatic Rest-activity Cycle Detection and Dichotomy Index Computation
341
to separate between rest/activity phases for both
signals.
After detecting the indices for each of the rest
and activity phases, the ZCM and body position
signals are converted into binary signals, where 1
represents the activity cycle and 0 represents the rest
cycle. The “AND” logical operator is applied to
combine the two binary signals, so new indices can
state accurately the starting and ending point of each
phase.
2.3 Graphical User Interface
Graphical user interface, abbreviated by GUI, is a
software interface that works at the point of contact
between a computer and its user. It allows the user to
interact with computers through graphical elements,
such as dialog boxes, pointing devices, push-buttons,
menus, and scroll bars. By selecting one of these
visual elements, either by mouse, pen or other
selection from menu, the user can manipulate what is
on screen and control commands to run a program
without writing a text characters.
The main reason from creating a GUI is to make
things simple for the program end-users. In order to
accomplish a task, users do not have to edit the
command line interface, create a script command, or
even understand the details of how tasks are
performed. Applications that are based on GUI are
simple to learn and run.
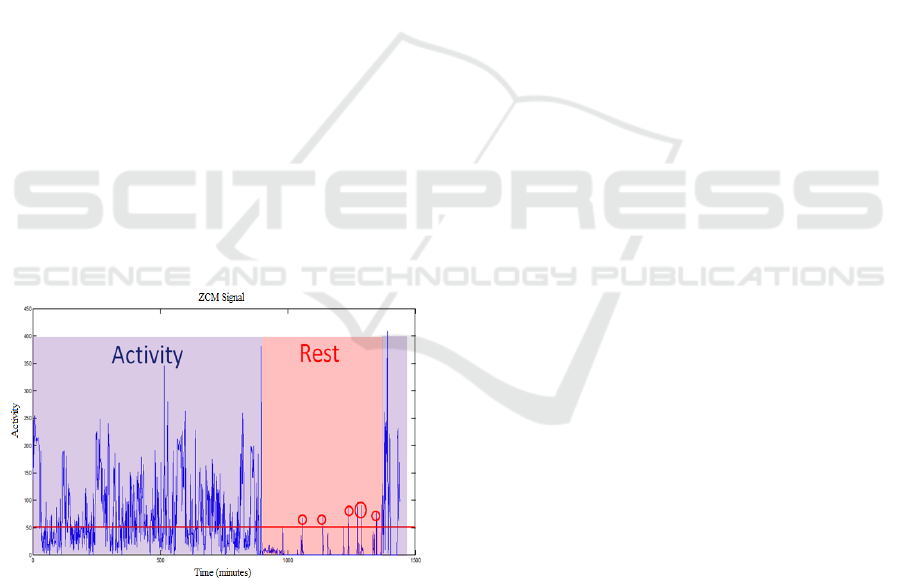
Figure 1: Segmentation of Rest/Activity cycle and
application of I<O formula.
Accordingly, in order to automatically calculate
the I<O and facilitate the intervention of users
(physicians, clinicians, researchers…), we aimed to
perform an easy-to-use GUI. The goals of this GUI
were to: (i) Detect the rest/activity cycle either
automatically through the DARC algorithm or
manually by user involvement and (ii) Calculate
automatically the I<O while applying the following
formula:
I<O = (1 – NB_L/NB_C) × 100 (1)
Where NB_L represents the number of activities
recorded during the day and NB_C
represents the
number of activities recorded during the rest period
that are greater than the median of NB_L.
3 GUI RESULTS
In this section, we demonstrate the GUI usage shown
in Figure 2.
First, users import the Patient Excel File (xls,
xlsm, xlm…).
Then, they could choose between ‘Manually’ and
a ‘Graph’ radio-button to select the starting time of
the day. If the ‘Manually’ option is chosen, a Time
Panel will appear on the screen. Users select the
appropriate time and then press ‘Set’. If the ‘Graph’
option is chosen, the select cursor will be available
and ZCM signal will be plotted. So, users select a
starting point from the graph. Time will be displayed
on the screen with an option of Reset.
At this time, users will have the opportunity to edit
‘threshold’ and ‘filter’ values as convenient.
To segment rest-activity cycle, users can choose
an ‘automatic’ and/or ‘manual’ detection
methodology. If ‘Automatic Detection’ is chosen,
users can press ‘Activity/Position’ to plot signals
segmentation and ‘Average’ buttons to get I<O
results. Once the ‘Activity/Position’ button is
pressed, ZCM and position signals will be plotted in
graphs 1 & 2 respectively showing the rest/activity
phases. ‘Next’ and ‘Previous’ buttons are available to
show the plots across each day. If ‘Manual Detection’
is chosen, a ‘help window’ will be displayed asking
the users to select the intervals of sleep across each
day plotted separately in graph 1. If users select the
sleep intervals wrongly, a ‘warning window’ will be
displayed requesting the repetition of the manual
detection procedure. If both ‘automatic’ and ‘manual’
detection techniques are chosen, the ‘Auto/Manual
Activity’ button can be pressed to plot the difference
of segmentation between both techniques and for
each day.
HEALTHINF 2019 - 12th International Conference on Health Informatics
342
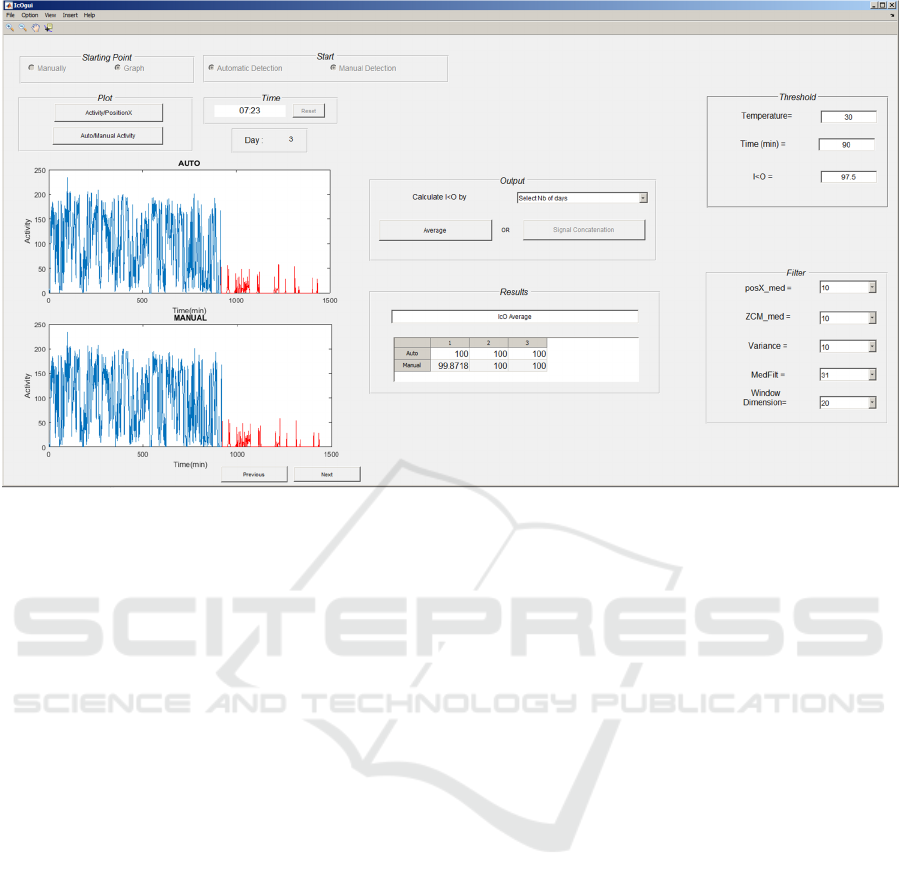
Figure 2: Graphical User Interface.
After the rest-activity detection, users can press
the ‘Average’ button to examine the I<O results of
each day coordinated in a table. Additionally, they
can select the number of days (X) to calculate the
I<O average of each X consecutive days.
To save the plotted figures and results, users
have the option of selecting a folder and the excel
filename. For each day, figures and I<O results will
be plotted on a separate sheet titled by the day
number. Moreover, the I<O table will be copied to
‘I<O Results’ sheet.
A ‘Restart’ button is available to repeat the
process. Once this button is clicked, a message box
will appear to ensure the restarting process.
Similarity for the ‘Exit’ button, once it is clicked, a
message box will appear to ensure the closing.
In order to validate our method, the student-test
and mean squared error (MSE) measurements were
evaluated. High correlation was found between I<O
calculated automatically and those calculated
manually, giving an R of 0.95 and MSE of 0.022.
4 DISCUSSION
The I<O, a reliable marker of rest/activity cycle, has
been used frequently in order to identify the optimal
time of the chemotherapy. In addition, it was
demonstrated that this parameter can give
physicians supplementary information for about the
patients’ quality of life. Therefore, an automatic
detection of the rest and activity phases can
minimize the patient’s intervention, reduce the time
required for I<O calculation and encourage more
related studies. Additionally, a GUI can facilitate
the users’ intervention and reduce the time of
analysis.
In the first part of our study, patients intervened
only by wearing the Movisens. Data was directly
saved on a memory chip and transferred to the
server via GPRS. The I<O of each subject was
calculated automatically. Then, a comparison of
I<O results was performed.
Next, a GUI was performed. Several options and
advantages encourage its usage. For instance, the
user has the option of segmenting rest-activity cycle
automatically and/or manually. Accordingly, a
comparative study can be performed between the
two techniques. Moreover, several parameters are
set as “variable data” such as I<O threshold,
temperature reference value, median filter and
others. Therefore, these factors can be changed
based on the user analysis and depending on each
subject. Then, segmented graphs, stating each of the
rest and activity phases, can be plotted for each
recorded day. Therefore, physicians can see the
relation between rest-activity cycle and I<O results
for both manual and automatic detections and save
outcomes on Excel File. Last but not least, a clear
demonstration is available with the GUI to smooth
A Graphical User Interface for an Automatic Rest-activity Cycle Detection and Dichotomy Index Computation
343

the user interface and explain other supplementary
options.
5 CONCLUSION
In this paper, we provide physicians and researchers
with a new technique to detect the rest-activity cycle
and calculate the dichotomy index automatically.
This work provides an easy-to-use graphical user
interface. It incorporates our listed purposes with
several analysis options that vary according to the
user requirements for an enhanced I<O study and an
improved chronotherapy. Physicians can detect the
optimal time for a chemotherapy treatment so that a
better quality of life and less disturbance of
circadian rhythms can be achieved.
REFERENCES
Chkeir A., Duchêne J., Hewson D., Lévi F., Beau J.,
Method for Determining Automatically the
Dichotomy Index I<O of an Individual. Pub. No.
WO2017/103203 22-6-2017
Innominato, P. F., C. Focan, T. Gorlia, T. Moreau, C.
Garufi, J. Waterhouse, S. Giacchetti, B. Coudert, S.
Iacobelli and D. Genet 2009. "Circadian rhythm in
rest and activity: a biological correlate of quality of
life and a predictor of survival in patients with
metastatic colorectal cancer." Cancer research 69(11):
4700-4707.
Levi, F. 2001. "Circadian chronotherapy for human
cancers." The lancet oncology 2(5): 307-315.
Levi, F. 2006. The circadian timing system, a coordinator
of life processes. implications for the rhythmic
delivery of cancer therapeutics. Engineering in
Medicine and Biology Society, 2006. EMBS'06. 28th
Annual International Conference of the IEEE, IEEE.
Lévi, F., E. Filipski, I. Iurisci, X. Li and P. Innominato
2007. Cross-talks between circadian timing system
and cell division cycle determine cancer biology and
therapeutics. Cold Spring Harbor symposia on
quantitative biology, Cold Spring Harbor Laboratory
Press.
Levin, R., M. Daehler, J. Grutsch, J. Quiton, C. Lis, C.
Peterson, D. Gupta, K. Watson, D. Layer and S. Huff-
Adams 2005. "Circadian function in patients with
advanced non-small-cell lung cancer." British journal
of cancer 93(11): 1202.
Mormont, M.-C., J. Waterhouse, P. Bleuzen, S.
Giacchetti, A. Jami, A. Bogdan, J. Lellouch, J.-L.
Misset, Y. Touitou and F. Lévi 2000. "Marked 24-h
rest/activity rhythms are associated with better quality
of life, better response, and longer survival in patients
with metastatic colorectal cancer and good
performance status." Clinical Cancer Research 6(8):
3038-3045.
Mormont, M. C. and F. Levi 2003. "Cancer
chronotherapy: principles, applications, and
perspectives." Cancer: Interdisciplinary International
Journal of the American Cancer Society 97(1): 155-
169.
Natale, V., P. F. Innominato, M. Boreggiani, L. Tonetti,
M. Filardi, A. Parganiha, M. Fabbri, M. Martoni and
F. Lévi 2015. "The difference between in bed and out
of bed activity as a behavioral marker of cancer
patients: A comparative actigraphic study."
Chronobiology international 32(7): 925-933.
Ortiz-Tudela, E., A. Martinez-Nicolas, M. Campos, M. Á.
Rol and J. A. Madrid 2010. "A new integrated
variable based on thermometry, actimetry and body
position (TAP) to evaluate circadian system status in
humans." PLoS computational biology 6(11):
e1000996.
OrtizTudela, E., I. Iurisci, J. Beau, A. Karaboue, T.
Moreau, M. A. Rol, J. A. Madrid, F. Lévi and P. F.
Innominato 2014. "The circadian restactivity
rhythm, a potential safety pharmacology endpoint of
cancer chemotherapy." International journal of cancer
134(11): 2717-2725.
Rich, T., P. F. Innominato, J. Boerner, M. C. Mormont, S.
Iacobelli, B. Baron, C. Jasmin and F. Lévi 2005.
"Elevated serum cytokines correlated with altered
behavior, serum cortisol rhythm, and dampened 24-
hour rest-activity patterns in patients with metastatic
colorectal cancer." Clinical cancer research 11(5):
1757-1764.
Scully, C. G., A. Karaboué, W.-M. Liu, J. Meyer, P. F.
Innominato, K. H. Chon, A. M. Gorbach and F. Lévi
2011. "Skin surface temperature rhythms as potential
circadian biomarkers for personalized
chronotherapeutics in cancer patients." Interface
Focus 1(1): 48-60.
HEALTHINF 2019 - 12th International Conference on Health Informatics
344
