
Map Matching for SLAM with Multiple Robots in Different Moments
Andr
´
e Felipe da Silva Oliveira
1
, Diego de Oliveira Dantas
1
, Doriedson Mendonc¸a Corr
ˆ
ea
2
,
Areolino de Almeida Neto
3
and Will Ribamar Mendes Almeida
2
1
Science and Technology Center, State University of Maranh
˜
ao (UEMA), Av. Lourenc¸o Vieira da Silva, S
˜
ao Lu
´
ıs, Brazil
2
Department of Computer Engineering, CEUMA University (UNICEUMA), S
˜
ao Lu
´
ıs, Brazil
3
Department of Informatics, Federal University of Maranh
˜
ao (UFMA), S
˜
ao Lu
´
ıs, Brazil
will.almeida@ceuma.br
Keywords:
Mapping, Robot Navigation, Map Matching, Map Merging, Map Fitting, SLAM.
Abstract:
This paper proposes a method for matching of occupancy grid maps in image form, in which a new way
of searching for similarities is developed. The maps used were obtained via SLAM. This work uses image
processing techniques to extract map features and create an alphabet, by means of features relationships, for
each map. Candidates for matching points are found from the comparison between members of the alphabets
generated. After the comparison, the possible matchings are verified from candidate points, applying a metric
of similarity. Thus, matching points that provide greater similarity are chosen as the best current points. These
operations are repeated each time that a new updated map is provided. Thus, the similarity rates of the best
points of the previous iteration are updated, and the new best matching points are calculated for the current
iteration; in this way, the matching points that have the highest similarity ratio among the previous iteration
and the current iteration are chosen as the best current points. The results obtained are promising, since in most
tests performed, it was successful in finding the correct matching between the maps. A quantitative analysis
was also performed on success cases, which demonstrated the efficiency of the method and the proximity of
the map matching method with single robot mapping methods.
1 INTRODUCTION
For a mobile autonomous robot to perform a task, it
is often necessary to have knowledge about the envi-
ronment in which it is inserted, because through this
knowledge the robot can make decisions and move
more efficiently. However, a map of the environment
is not always available, making it necessary to have a
mapping process in the place, whether performed by
the robot itself or not.
The mapping processes can be performed in vari-
ous ways. A very common example in Robotics is the
use of SLAM (Simultaneous Localization and Map-
ping) techniques, in which the robot maps the en-
vironment at the same time it is located. Mapping
processes performed by different robots have been in-
creasingly used in order to improve mapping speed
and make the process more reliable. In this way, if
one of the robots becomes unavailable, the others con-
tinue the process.
Many map matching works (Bresson et al., 2013),
(Thrun and Liu, 2005), (Cunningham et al., 2012),
(Koch et al., 2016), (u. N. Jafri and Chellali,
2013),(Jian et al., 2017), (Blanco et al., 2013), (Birk
and Carpin, 2006) use robot-generated maps via
SLAM. Thus, some of these works (Bresson et al.,
2013), (Thrun and Liu, 2005), (Cunningham et al.,
2012), (Jian et al., 2017), (Blanco et al., 2013) tend
to focus their efforts on extracting features directly
from the mapping process, relating matching directly
to the mapping process itself. However, in this way,
the matching process becomes highly dependent on
the type of SLAM used and the specifics characteris-
tics extracted of this SLAM.
There are several mapping techniques from
SLAM with multiple robots. These techniques usu-
ally use extracted features during the individual
SLAM of each robot of the team, so that through these
features it is possible to find several types of associa-
tions.
This work proposes a method of map matching,
which is used to compare geometric features extracted
from the corners detected in the maps. This method
was developed in order to work with occupancy grid
210
Oliveira, A., Dantas, D., Corrêa, D., Neto, A. and Almeida, W.
Map Matching for SLAM with Multiple Robots in Different Moments.
DOI: 10.5220/0007395902100217
In Proceedings of the 11th International Conference on Agents and Artificial Intelligence (ICAART 2019), pages 210-217
ISBN: 978-989-758-350-6
Copyright
c
2019 by SCITEPRESS – Science and Technology Publications, Lda. All rights reserved
type maps as image so that it does not rely on internal
variables SLAM method used for mapping, making it
therefore a more usefull method and easy portability.
This paper is divided as follows: in Session 2 it
is presented how the map matching was made, dis-
cussing the preprocessing applied in the maps, the
process of extraction of features (corners), the cre-
ation of alphabets through the relationship geometric
of these features, the comparison of these alphabets,
the selection of the best feature to finally perform the
matching of the maps; in Session 3 it is discussed
the methodology used in the preparation of this work,
considering the used machine configurations and the
robot model used in SLAM process; in Session 4 it
is discussed on the results obtained, in both qualita-
tive and quantitative analyzes and in Session 5 it is
presented the conclusion as well as future works.
2 MAP MATCHING THROUGH
FEATURES RELATIONSHIP
This work sought to make the matching of maps per-
formed by several robots. The matching between the
provided mappings is done for each two maps, gener-
ating a final map at the end of the process.
The maps provided for the method are occupancy
grid type (Elfes, 1989), which is characterized by an
occupation matrix and, when treated in image form,
represented in gray scale, where the black color ex-
presses obstacles detected in the environment, the
white color expresses regions mapped without obsta-
cles, and the gray color represents unmapped regions.
The image format used in the method was Portable
Graymap (pgm), because it is a portable format and
has small dimensions, while also having a good scale
conversion ratio to the original environment being
mapped.
2.1 Map Matching
In order to match the individual maps obtained by a
robot team and thus generate a final map, it is neces-
sary to follow a sequence of steps.
Because the proposed method is based on map
matching through the mapping process, it works so
that the system receives maps of each new state that
is provided or saved during the process. In the Algo-
rithm 1, it can be observed the procedure, in which the
system receives the states of each mapping and sup-
plies them to the map matching function. This func-
tion returns the resulting matching and matching rate,
which define how similar the map states are (relative
to the selected matching points). After this step, it is
checked if the matching rate is higher than the best
matching rate thus far; if the matching rate is higher,
then the best matching rate is updated along with the
best matching 1. In this work, map 1 is represented
by δ
1
, while map 2, by δ
2
, and mapping process 1 is
represented by ∆
1
, while mapping process 2, by ∆
2
.
The best current matching rate is represented by Ψ;
while the current matching rate, by ψ. The best cur-
rent matching is represented by Λ, while the current
matching between the maps is represented by λ.
Algorithm 1: Map Matching of the mappings pro-
cess.
1 Function MapMatchingMapping (∆
1
, ∆
2
)
2 begin
3 ψ = 0
4 Ψ = 0
5 δ
1
= empty
6 δ
2
= empty
7 Λ = empty
8 while (exist maps in ∆
1
or ∆
2
) do
9 if (exist maps in ∆
1
) then
10 δ
1
= next map from ∆
1
11 end
12 if (exist maps in ∆
2
) then
13 δ
2
= next map from ∆
2
14 end
15 λ, ψ = MapMatching(δ
1
, δ
2
) if (ψ >
Ψ) then
16 Λ = λ
17 Ψ = ψ
18 end
19 return Λ
20 end
21 end
The matching process can be observed in the func-
tion exposed in the Algorithm 2, in which the proce-
dure receives two maps as input. Thus, a sequence
of procedures for obtaining matching is performed.
Initially, the maps are preprocessed, so that the most
obvious noises are smoothed and the main features
of the maps are highlighted. After the preprocess-
ing, the features of the maps are extracted and then,
from geometric relationships among them, alphabets
1
are generated. By comparing the similarities of al-
phabet members, a set of points is considered to be
a candidate for matching points among maps (map-
ping points). From these matching points, the best
points are defined based on a metric of similarity and
then the matching generated by points with greater
similarity are returned with associated similarity rate.
The map delta
1
converted to gray scale is represented
by α
1
, while the map delta
2
by α
2
. The features ex-
tracted from the map α
1
are represented by β
1
, while
1
In this work, alphabet is considered a set of symbols
with features that differentiate them from each other.
Map Matching for SLAM with Multiple Robots in Different Moments
211
the map α
2
, by β
2
. The matrix that stores the com-
pared alphabets is represented by γ. The current can-
didate points are expressed by φ, while the best cur-
rent candidate points are represented by Φ. The high-
est evaluation of the Jaccard similarity metric is rep-
resented by Σ.
Algorithm 2: Map Matching.
1 Function MapMatching (δ
1
, δ
2
)
2 begin
3 α
1
= PreProcess(δ
1
)
4 α
2
= PreProcess(δ
2
)
5 β
1
= ExtractFeatures(α
1
)
6 β
2
= ExtractFeatures(α
2
)
7 L
c
i,1
= GenerateAlphabet(β
1
)
8 L
c
z,2
= GenerateAlphabet(β
2
)
9 γ = CompareAlphabet(L
c
i,1
, L
c
z,2
)
10 φ = CandidateMatchingPoints (γ)
11 Φ, Σ = BestMatchingPoints (φ, α
1
, α
2
)
12 λ = Matching(Φ, δ
1
, δ
2
)
13 return λ, Σ
14 end
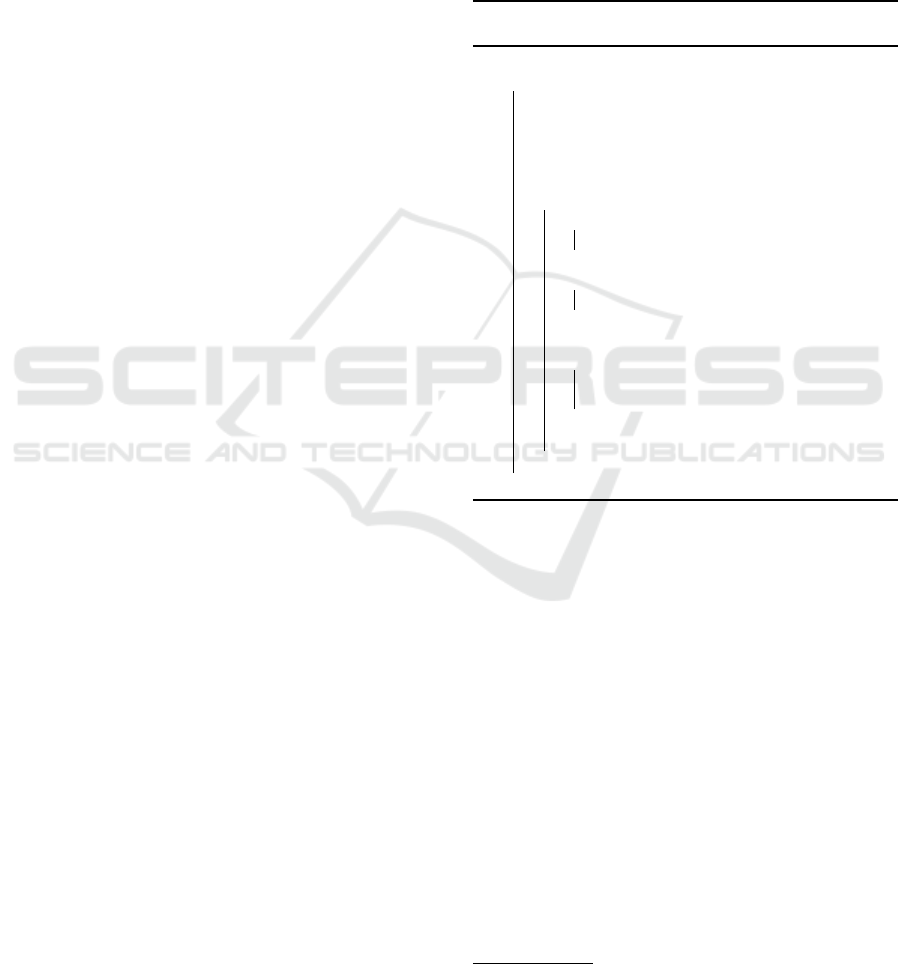
2.1.1 Preprocessing the Maps
Preprocessing of maps is a fundamental step, as it
smoothes the noise and highlights the features of the
maps.
The map is converted to grayscale, and then bina-
rized (Lopes, 2012), so that only whites and blacks
remain on the map. A example can be observed in
Figure 1 (a) represents the map to the system, and
Figure 1 (b) expresses the map after being binarized.
(a) Map provided. (b) Binary map.
Figure 1: Example of binarization of a map.
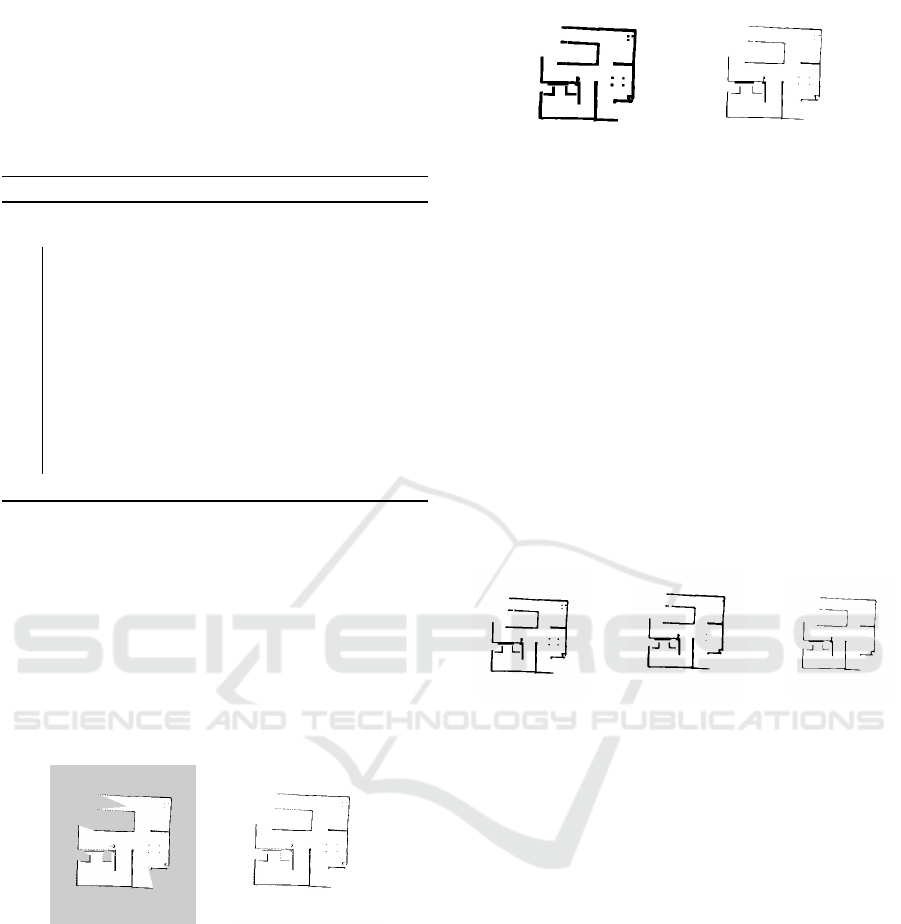
In order to close the discontinuities of walls that
are common in occupancy grids maps type and thus to
avoid wrong detections of corners , a sequence of two
erosions (das Grac¸as Medeiros et al., 2002) is applied
to ”thicken” the collisions of the map and then join
the points belonging to the wall, in order to promote
the continuities thereof. The result of the application
of two erosions in Figure 1 (b) can be observed in
Figure 2 (a), where it is verified that erosions promote
the closure of spacing on the walls of the map.
After closing the undue spacing on the walls of the
map, it is necessary to return the walls to their orig-
(a) After two ero-
sions.
(b) After two dila-
tions.
Figure 2: Example of erosion and dilation applied to a bi-
nary map.
inal thicknesses, so a sequence of two dilations (das
Grac¸as Medeiros et al., 2002) is applied to ”sharpen”
the walls of the map. The result of the dilations ap-
plied in Figure 2 (a) can be observed in Figure 2 (b)
and, comparing the result of Figure 2 (b) with the re-
sult of Figure 1 (b), it can be seen that a large part of
these discontinuities have been corrected.
In order to remove features originated from non-
relevant objects such as chair and table legs, a se-
quence of erosion, median blur (Gonzalez and Woods,
2010) and dilation is performed. The result of these
operations applied to the image in Figure 2 (b) can be
observed in Figure 3.
(a) Erosion. (b) Median
Blur.
(c) Dilation.
Figure 3: Example of a sequence of erosion, median blur
and dilation.
2.1.2 Features Extraction
The SLAM maps are poor in features, so we chose
one of the most obvious features, which are the cor-
ners. As a corner detector, the Good features to track
(Shi and Tomasi, 1994), which is an extension of the
Harris corner (Harris and Stephens, 1988) method,
has a strong invariance of rotation and noise. Good
features to track were used because it selects corners
in a distributed form throughout the image, limiting
the maximum number of corners to be detected and
these reduce the complexity in the process of genera-
tion and comparison of alphabets.
The Good features to track technique is applied
right after the preprocessing of the mappings. In the
figure 4 it is possible to observe the corners that were
detected in the map of the Figure 3 (c).
With the detection of these corners, a list L
m
is
generated for each map of each robot with N
m
corners
detected in each map, where m represents the map, N
ICAART 2019 - 11th International Conference on Agents and Artificial Intelligence
212
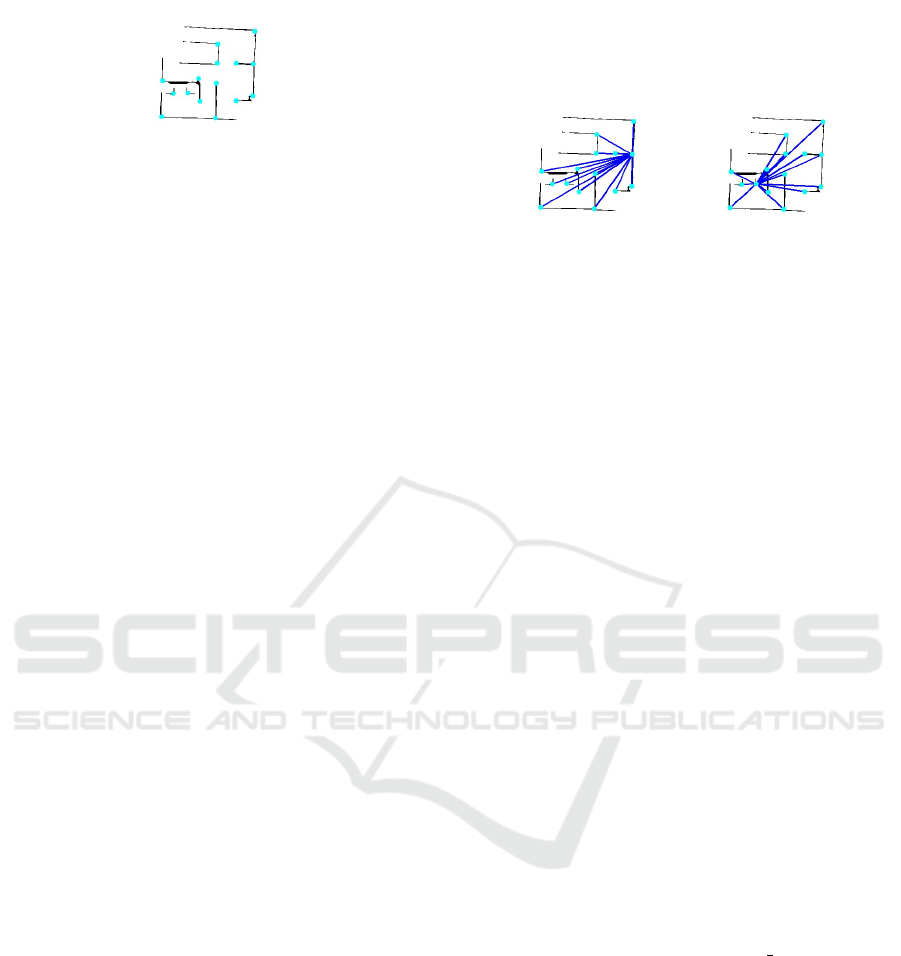
Figure 4: Detection of corners using the technique Good
features to track.
the number of corners and L represents the list as seen
in the expression 1.
L
m
= (c
1,m
, c
2,m
, c
3,m
, ..., c
N
m
,m
) (1)
2.1.3 Generation of the Alphabet
The alphabet is treated as a set of symbols with its
own characteristics. Each symbol is defined by a par-
ticular corner and the characteristics of the symbol are
determined by the set of geometric relationships with
others belonging to the same map.
In order to relate a corner c
i,m
to another c
j,m
,
it has been defined that the euclidean distance d
among them is subject to the following condition:
∀d
i, j
| D
max
≥ d
i, j
∧ D
min
≤ d
i, j
∧ D
max
≥
D
min
∧ i 6= j. In addition, that D
max
and D
min
are the
parameters that define the maximum and minimum
distances, respectively, of relationship among the cor-
ners.
To relate the corners, for each corner c
i,m
within
the list of corners L
m
, the distance from that corner
is calculated for all other c
j,m
of the same list, where
j 6= i. The corners within the range defined by D
max
and D
min
are added to a list L
c
i,m
which represents the
alphabet and is related to the corner c
i,m
, as seen in
the Expression 2, where the value T
L
c
i,m
represents the
size of the list L
c
i,m
, that is, the number of other cor-
ners with which c
i,m
relates.
L
c
i,m
= (c
1,m
, c
2,m
, c
3,m
, ..., c
T
L
c
i,m
,m
) (2)
After relationship among the corners, it is required
to calculate the second characteristic of each mem-
ber of the alphabet. The angle formed by the vec-
tors defined by the corners c
i,m
is calculated for all the
members c
j,m
of its list L
c
i,m
. The calculation of all
the possible combinations within each list is achieved
and thus the alphabet is obtained that will be used for
comparison between the maps.
Each c
i,m
along its angles and calculated distances
relative to all other corners within a range of distances
delimited by D
max
and D
min
are a letter of the alpha-
bet. The purpose of delimiting these distances is to
prevent errors accumulated with the distance among
the corners interfering in the matching process.
Based on the Figure 5, one can observe visually
how the form of two alphabet members generated by
using the corners detected in Figure 4 looks.
(a) Member 1. (b) Member 2.
Figure 5: Members of an alphabet generated.
2.1.4 Comparison of Alphabet Members
In this step, a comparison is made among the mem-
bers of the alphabets, in which a comparison is made
based on the characteristics of distances and angles
related to each member.
Firstly, we compute each distance d
i, j
and d
z,k
re-
lated to each alphabet L
c
i,1
and L
c
z,2
, if these distances
are similar (or within a margin of error ε), we look
for other similar distances d
i,y
and d
z,q
, and if similar
distances, we seek to relate the angles. For the re-
lationship among the angles, the angle formed among
the distances in each map, angle a
i, j,y
for the distances
d
i, j
and d
i,y
and the angle a
z,k,q
for the distances d
z,k
and d
z,q
, if the angles a
i, j,y
and a
z,k,q
are similar (or
within a margin of error ν), then the matrix γ[i][z] s
incremented in the positions for each member of the
alphabet i and z.
2.1.5 Selection of Candidates for Matching
Points
After calculating the similarity among the corners of
each map, one must select the candidates for matching
points among the maps. This selection is performed
by searching for corners with greater similarities in
the matrix γ.
A maximum number candidates
number of can-
didates for matching points φ is established. For each
candidate φ
a,1
, a position of greater value is associ-
ated within γ, so that positions do not recur among
candidates. After defining the first matching point for
each candidate, the second point is defined, where φ
a,2
receives the position with the highest value within γ
and the associated distances are similar (d
i, j
≈ d
z,k
are similar, i and z are related to φ
a,1
and j and k are
related to φ
a,2
). Thus, the candidates for matching
points to be tested in the next stage are selected.
Map Matching for SLAM with Multiple Robots in Different Moments
213
2.1.6 The Best Matching Points
After the candidate selection phase for matching
points, it is necessary to choose among them, that is,
the ones that fit the best. This choice is made through
attempts to fit among the maps, using the candidate
points as fitting points.
In this way, the map δ
2
is translated and rotated
on the map δ
1
, so that the points (corners) c
i,1
and
c
z,2
referring to φ
a,1
, and also the points c
j,1
and c
k,2
,
referring to φ
a,2
, are respectively aligned.
After fitting candidate points, it is possible to mea-
sure which of the fittings has the highest degree of
similarity and, therefore, greater reliability. For this,
the Jaccard similarity metric σ (Jaccard, 1912), (Mil-
sztajn and de Geus, 2015) is applied between the
maps δ
1
and δ
2
, exemplified by Figure 6 (a) and (b).
This metric requires that two operations should be
performed among the maps, the first one is an inter-
section inter, exemplified by Figure 6 (c), and the sec-
ond one is a union uni, exemplified by Figure 6 (d).
In the result of these operations, the number of black
pixels at the intersection inter and the union uni is
counted, and then the amount of black pixels of inter
is divided by uni. In this way, we obtain the simi-
larity metric for each pair of candidates for matching
points; the pair that has greater similarity is chosen as
the current best matching points.
(a) Map 1. (b) Map 2.
(c) Intersection. (d) Union.
Figure 6: Example of union and intersection application on
two maps.
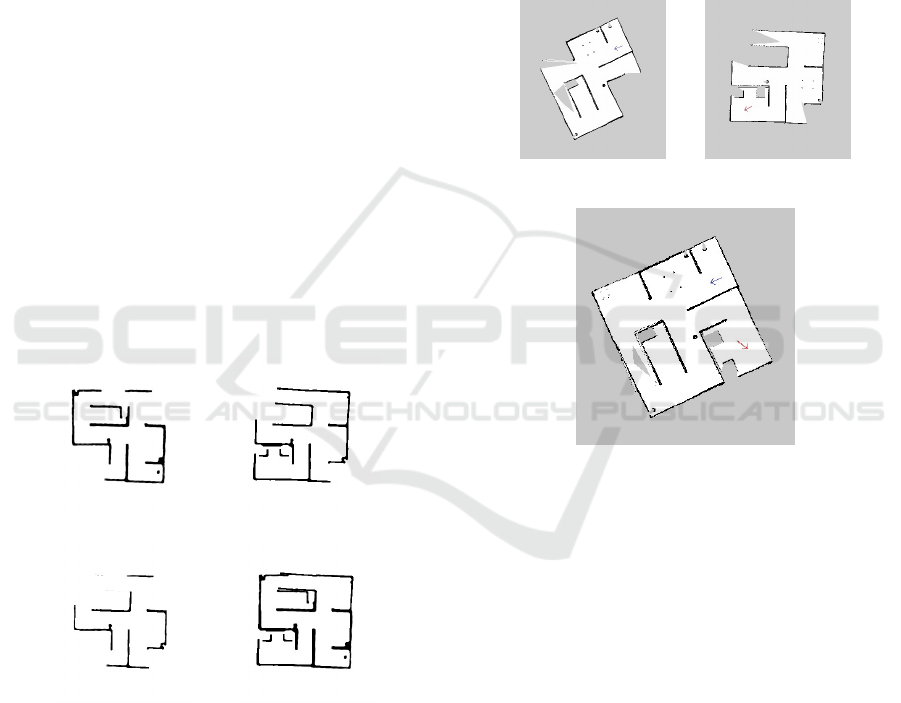
2.1.7 Matching among the Maps
As maps 1 and 2 have already been aligned in the pro-
cess of choosing the best matching points , a new im-
age is generated that will receive the characteristics of
both maps δ
1
and δ
2
. This transfer of characteristics
follows the following rules:
• Gray color is the first one to be transferred to im-
age;
• White color is the second one to be transferred to
image and overlaps with gray color;
• Black color is the third one to be transferred to
image and it overlaps with gray and white colors.
So, we have the new ”matching” map λ gener-
ated. An exemplification of the result of the matching
can be observed in Figure 7 (c), where one can ob-
serve the map obtained from a matching of maps in
Figure 7 (a) and (b).
(a) Global map ref-
erence 1.
(b) Global map ref-
erence 2.
(c) Global reference in Match-
ing.
Figure 7: Global reference in the matching among two
maps.
The global reference of the map δ
1
remains the
same as the mapping process. The global reference
of the map δ
2
receives the same translation and ro-
tation operations as δ
2
received. In Figure 7 (a), the
global map reference is referenced by the blue arrow,
where the direction of the arrow represents the ini-
tial orientation of robot 1 and the base of the arrow is
the initial position of the robot 1 that mapped δ
1
. In
Figure 7 (b), the global reference of the map is ref-
erenced by the red arrow, where the direction of the
arrow represents the initial orientation of robot 2 and
the base of the arrow is the initial position of the robot
2 that mapped the δ
2
. Thus, when the translation and
rotation operations are applied to δ
2
, these same oper-
ations are also applied in the global reference of robot
2, so that the result in the matching can be observed
in Figure 7 (c), where the global reference of robot 2
is adjusted to match the maps.
ICAART 2019 - 11th International Conference on Agents and Artificial Intelligence
214

3 METHODOLOGY
3.1 Materials
For the development of this work was used a com-
puter with the following machine configuration: Kaby
Lake processor I7-7700HQ (6 MB cache up to 3.8
GHZ), a 32 GB DDR4 RAM (2133 MHZ) mem-
ory, a NVIDIA GEFORCE GTX 1050 GPU (4 GB
GDDR5) video card, a 1 TB SSHD with 8 GB SSD,
a 480 GB (500 MB / S) SATAE M.2 SSD. This was
used with the Ubuntu 16.04 LTS 64-bit operating sys-
tem.
As a robot manipulation system, the Robot Oper-
ational System (ROS) (ROS, 201) KINETIC version
was used. As a robotic simulator, the V-REP was
used. As generator of random environments, the V-
REP map generator
2
(Jelinek, 2016) was used. As a
system for mapping, the SLAM Gmapping (Grisetti
et al., 2007) Toolkit was used. The Oracle VM Vir-
tualBox software was also used for operating system
virtualization.
3.2 Robotic Model
For simulation in the V-REP, the model of robot
mecabot (Dantas, 2017)
3
was used.
For this work, the model used did not contain the
robotic arm and the vision sensor it was replaced by a
fastHokuyo laser scanner available on the V-REP. In
this sensor it was introduced, via textit script, an er-
ror of 0.01 meters. It were also introduced a reading
aperture of 240 degrees around the robot and a read-
ing radius of 5 meters.
3.3 Methods
In order to carry out this work, it was necessary to
use the materials described in the materials topic 3.1.
So the software described was installed on an Ubuntu
virtual machine, with the configuration of four pro-
cessors and 16 GB of RAM.
Using the V-REP map generator connected with
the V-REP, it was possible to generate and save scenes
from ten random and different environments in-door.
These environments were generated with the purpose
of being mapped in order to generate a database for
the tests of map matching.
With the V-REP integrated to the ROS, for each
environment map generated previously, the mapping
2
Available in: https://github.com/Lukx19/Vrep-map-
generator
3
Robot model details available in:
https://tede2.ufma.br/jspui/handle/tede/2062
of these environments was performed through gmap-
ping, the control of the robot was performed manu-
ally, via keyboard, through the teleop twist keyboard
application
4
.
Thus, the teleop twist keyboard application was
performed applying a linear velocity of 0.8 m/s and
an angular velocity of 1.61 rad/s via human con-
trol; five maps were also performed for each gener-
ated environments (for each environment, each map-
ping occurred with different poses). Thus formed a
database of 50 mappings. In order to attempt a match-
ing among maps, we have always explored an area in
common among the mappings of the same environ-
ment. For each environment was created a possibility
of ten matchings using two in two mappings refer-
ring to this environment. The database generated by
gmapping is composed of mapping histories, and for
each mapping and each time period of one second (if
there is a change in map state), the state of the map-
ping at that instant is saved in image form.
The mappings were made by just one robot at a
time and the matchings were performed, using com-
binations between these mappings, and simulating as
if two robots were mapping at the same time.
After the generation of the database, for each en-
vironment, it inserts into the system implemented,
based on the method proposed in this work, two pro-
cesses of mapping at a time, in order to never repeat a
combination. Thus, there are ten possible matching
combinations for each environment, totalizing 100
matchings performed. This operation was performed
with the following configuration of parameters in the
system:
• N = 30, number of corners to be extracted from
each map;
• q = 0.2, referring to the quality of the corners to
be extracted from each map;
• D
max
is half the greater distances among corners,
taking into account the two maps being matched;
• D
min
= 18, values in pixels;
• ε = 1.1, values in pixels;
• ν = 1.1, values in degrees.
The results were evaluated qualitatively and in the
cases of success a quantitative evaluation was applied.
In this quantitative evaluation, the accuracy of the
maps of each base environment was analyzed in com-
parison to the generated matching.
4
The teleop twist keyboard is present in the ROS and
through this at sends speed signals to the V-REP, which
in turn applies these signals to the robot. Available in:
http://wiki.ros.org/teleop twist keyboard
Map Matching for SLAM with Multiple Robots in Different Moments
215
4 RESULTS OF EXPERIMENTS
The qualitative analysis defined only the attempted
matching to have succeeded or not. From 100 match-
ings performed with two mappings, 79 were success-
ful.
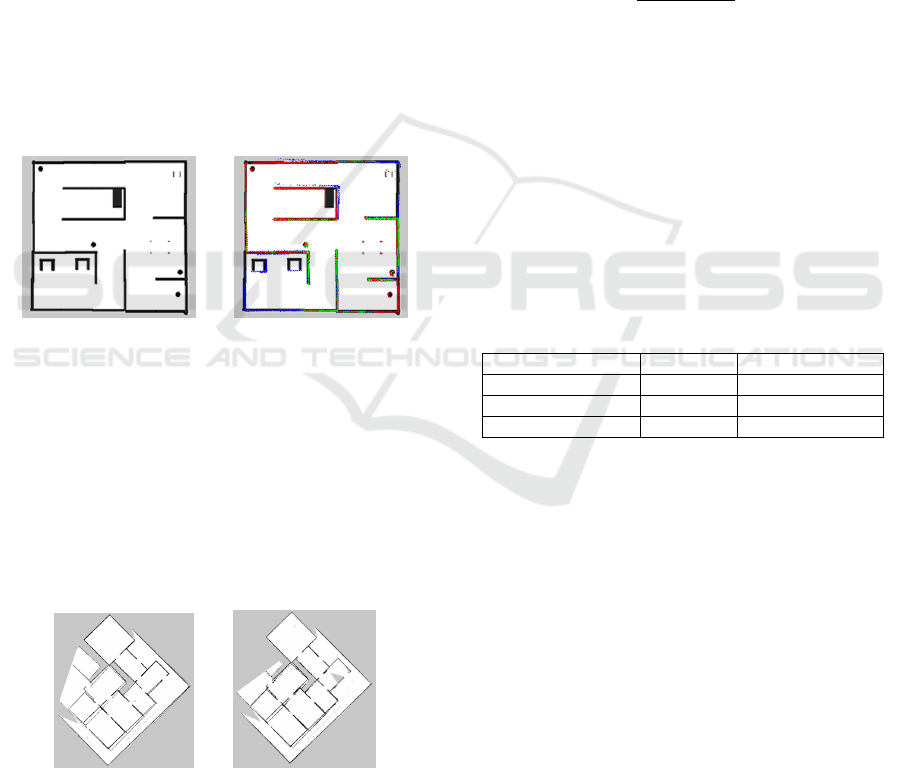
One examples of success can be seen in the Fig-
ure 8. The red color represents the mapping made by
robot 1, the blue color expresses the mapping done
by robot 2 and the green color represents the mapped
locations in common.
Based on the Figure 8 (a), one can observe the for-
mat of the real environment. Thus, in Figure 8 (b), it
is observed that the common areas, plotted by green
color, tend to have a higher concentration in neighbor-
ing regions, while as far as the green color goes. The
colors blue and red become more evident, demonstrat-
ing that, as it departs from the matching zone (green
regions), the error of each mapping, used in the pro-
cess, causes a loss of precision in matching. The same
phenomenon can be observed in Figure 8 (c) and (d).
(a) Map of the environ-
ment 1.
(b) Matching of the
mappings 1 e 2.
Figure 8: Representation of environment 1 and one of their
matchings.
The same process was applied to successful
matching results (between two different mappings of
the same environment), so that these results were
matched to other mappings, always being performed
two by two matching and thus providing a matching
among three or more mappings. Thus, some success
cases can be observed in Figure 9.
(a) Matching of the
mappings 1, 2 and
4.
(b) Matching of the
mappings 1, 2, 3, 5
and 4.
Figure 9: Matchings with more than two mappings related
to the environment 2.
A quantitative analysis was performed with suc-
cess cases. In this analysis the comparison of the
original environments with the results of the match-
ings from which the number P
p
of black pixels and the
number P
b
of white pixels were extracted, which co-
incided (black with black, white with white) between
the original environment and the result of matching.
The number P
pc
of black pixels and the number P
bc
of white pixels present in the results of the matching
were also counted. Thus, for each obtained matching,
it was applied the Equation 3. From this formula, the
accuracy rate between the outcome of the matching
and the original environment was obtained.
(Pp + P
b
)
(P
pc
+ P
bc
)
(3)
The accuracy of each individual mapping was cal-
culated. This calculation was performed using Equa-
tion 3, with the small change that the numbers P
p
and P
b
represented the values in relation to the indi-
vidual mapping, instead of matching results. In this
way, both individual mapping accuracies and match-
ing results were used to calculate the means, median
and standard deviation. These calculations were per-
formed for two classifications: the first one represent-
ing only the individual mappings (thus representing
the maps generated via gmapping) and the second one
representing the results of the matchings.
Table 1: Quantitative result.
analysis Gmapping Proposed Method
Mean 0,929006 0,927027
Median 0,926777 0,931214
Standard Deviation 0,020205 0,021912
The quantitative results of matchings and map-
pings can be observed on the basis of Table 1. In these
results, it was achieved that the mean, median and
standard deviation differences were very small, being
less than 0, 01, proving that the matching method pro-
vides approximate results to the individual gmapping
mapping method. In addition, the averages and medi-
ans of precisions are considerably high (above 92%).
5 CONCLUSION
In this work, a mapping of SLAM maps with a sin-
gle robot model was carried out and the mappings
were performed at different times. These matchings
were carried out on two maps. In order to enable the
matchings, a technique of geometric relationship was
developed among the corners that were detected in the
mappings. This technique detected the three best cor-
ners for each two candidate points to fit among the
ICAART 2019 - 11th International Conference on Agents and Artificial Intelligence
216

maps. After this detection, the attempt of matching
among these candidates is realized and then the gen-
erated maps are evaluated through a metric of similar-
ity.
The quantitative analysis of matchings expressed
the difference in precision between the mapping with
only one robot and the result of the matching do not
have considerable differences. Thus, matching can be
considered a viable tool for mapping processes with
more than one robot, but it remains to verify the navi-
gability of both maps, which should be done in future
work.
Through this method, good results were obtained,
in order to make possible future tests in real robots
and the continuity of the research. In order to improve
the results obtained, it is suggested to apply proba-
bilistic functions to verify if there is success or failure
in the matching process, in addition to trying to in-
crease the number of success cases.
ACKNOWLEDGEMENTS
The authors acknowledge FAPEMA, CAPES and
CNPq for their financial support in the development
of this work. Special thanks to CEUMA, UEMA and
UFMA for their technical support.
REFERENCES
Birk, A. and Carpin, S. (2006). Merging occupancy grid
maps from multiple robots. Proceedings of the IEEE,
94(7):1384–1397.
Blanco, J.-L., Gonzlez-Jimnez, J., and Fernndez-Madrigal,
J.-A. (2013). A robust, multi-hypothesis approach
to matching occupancy grid maps. Robotica,
31(5):687701.
Bresson, G., Aufrere, R., and Chapuis, R. (2013). Consis-
tent multi-robot decentralized SLAM with unknown
initial positions. Information Fusion (FUSION), 2013,
pages 372–379.
Cunningham, A., Wurm, K. M., Burgard, W., and Del-
laert, F. (2012). Fully distributed scalable smooth-
ing and mapping with robust multi-robot data asso-
ciation. Proceedings - IEEE International Conference
on Robotics and Automation, pages 1093–1100.
Dantas, D. d. O. (2017). Implementao de um sistema aut-
nomo de construo de estrutura usando aprendizado
por reforo. Master’s thesis. DEPARTAMENTO DE
INFORMTICA/CCET.
das Grac¸as Medeiros, N., da Silva, E. A., and Nogueira,
J. R. (2002). Segmentac¸
˜
ao morfol
´
ogica de imagens
utilizando o gradiente morfol
´
ogico multi-escala. Re-
vista Brasileira de Cartografia, (54).
Elfes, A. (1989). Occupancy Grids: A Probabilistic Frame-
work for Robot Perception and Navigation. PhD the-
sis, Pittsburgh, PA, USA. AAI9006205.
Gonzalez, R. C. and Woods, R. E. (2010). Processamento
digital de imagens . Pearson Prentice Hall.
Grisetti, G., Stachniss, C., and Burgard, W. (2007).
Improved techniques for grid mapping with rao-
blackwellized particle filters. IEEE Trans Robot 23.
Harris, C. and Stephens, M. (1988). A combined corner and
edge detector. In Alvey vision conference, volume 15,
page 50. Citeseer.
Jaccard, P. (1912). The distribution of the flora in the alpine
zone. New phytologist, 11(2):37–50.
Jelinek, L. (2016). Vrep map generator. Accesso: 15-03-
2018.
Jian, L., Chen, Z., Qiang, I., Heng, W., and Manzhen, M.
(2017). Vision feature extraction algorithm for occu-
pancy grid maps merging. In Proceedings of the 2017
2Nd International Conference on Communication and
Information Systems, ICCIS 2017, pages 290–293,
New York, NY, USA. ACM.
Koch, P., May, S., Schmidpeter, M., K
¨
uhn, M., Pfitzner, C.,
Merkl, C., Koch, R., Fees, M., Martin, J., Ammon, D.,
and N
¨
uchter, A. (2016). Multi-robot localization and
mapping based on signed distance functions. Journal
of Intelligent & Robotic Systems, 83(3):409–428.
Lopes, F. M. (2012). Um modelo perceptivo de limiarizac¸
˜
ao
de imagens digitais.
Milsztajn, F. and de Geus, K. (2015). Segmentao de tecidos
cerebrais em imagens tridimensionais do crebro.
ROS (201?). Documentation = http://wiki.ros.org/, note =
Accessed: 2017-04-09,.
Shi, J. and Tomasi, C. (1994). Good features to track. In
1994 Proceedings of IEEE Conference on Computer
Vision and Pattern Recognition, pages 593–600.
Thrun, S. and Liu, Y. (2005). Multi-robot SLAM with
Sparse Extended Information Filers. The Interna-
tional Journal of Robotics Research, 15:254–266.
u. N. Jafri, S. R. and Chellali, R. (2013). A distributed multi
robot slam system for environment learning. In 2013
IEEE Workshop on Robotic Intelligence in Informa-
tionally Structured Space (RiiSS), pages 82–88.
Map Matching for SLAM with Multiple Robots in Different Moments
217
