
A Novel Approach to Gene Analysis: Gene Panels and Cluster
Definition to Assist Genotyping Patients with Congenital Myopathies
Marco Calderisi
1
, Ilaria Ceppa
1
, Denise Cassandrini
2
, Rosanna Trovato
2
, Giulia Bertocci
2
,
Alessandro Tonacci
3
, Guja Astrea
2
, Raffaele Conte
3
and Filippo M. Santorelli
2
1
Kode Solutions, Pisa, Italy
2
IRCCS Fondazione Stella Maris, Pisa, Italy
3
IFC-CNR, Pisa, Italy
Keywords: Congenital Myopathies, Muscular Dystrophies, Gene Sequencing, Non Metric Multidimensional Scaling,
Clustering, High Throughput Data Analysis.
Abstract: The boundaries between congenital myopathies and muscular dystrophies and other neuromuscular
disorders are becoming blurred because of the significant overlap in disease genes, clinical presentations,
and histopathological features. Using a MotorPlex7.0 gene panel in massive sequencing, we define disease
causative mutations in 76% of our sample. We then analysed the extent of gene information in the data
using non metric multidimensional scaling (nMDS), a well-known algorithm for multivariate analysis, and
clustering techniques. To perform this analysis, we developed a software that allows for an interactive
exploration of the variants dataset and of the results of the nMDS model. Using these techniques, we were
able to quickly study a dataset consisting of thousands of variants, identifying groupings of patients based
on the presence or absence of specific sets of mutations.
1 INTRODUCTION
The term congenital myopathy refers to a group of
clinically, genetically and histologically
heterogeneous diseases that mainly affect skeletal
muscle (Cassandrini et al., 2017). The presence of
specific histopathological alterations on muscle
biopsy distinguishes these conditions from other
neuromuscular disorders. Congenital myopathies
(CM) are caused by genetic defects in structural
proteins of muscle and are classified on the basis of
muscle biopsy findings (North KN et al., 2014).
Although the nomenclature of CM is under constant
review as more genes are identified — and the lists
of associated phenotypes and histological
expressions are growing at a rapid speed—, current
classifications continue to rely mainly on the
features seen on muscle biopsy (Cassandrini et al.,
2017).
Congenital muscular dystrophies (CMD) are a
group of genetically and clinically heterogeneous
hereditary muscle diseases characterized by early-
onset hypotonia and muscle weakness associated
with dystrophic change on muscle pathology. The
current classification of CMD consists of three
major categories: Ullrich type CMD (collagen VI-
related dystrophy), merosin-deficient CMD
(LAMA2-related dystrophy) and CMD with
glycosylation defect in alpha-dystroglycan (alpha-
dystroglycanopathy); as well as other minor
subgroups, such as LMNA-related CMD (L-CMD),
megaconial type CMD, CMD with integrin alpha-7
defect, and CMD without genetic diagnosis
(Bonnemann CG et al., 2014). These disorders are
phenotypically diverse and genetically
heterogeneous.
The boundaries between CMDs, CM, and other
myopathies or limb girdle muscular dystrophies are
blurred, with a significant overlap in disease genes,
clinical presentations, and histopathological features.
(O'Grady GL et al., 2016). Therefore, a correct
diagnostic approach requires the integration of data
from clinical evaluations (including a detailed
family history), muscle biopsy (including
histological, immunohistochemical and electron
microscopy examinations) and muscular imaging at
MRI and their combination might drive correct
selection of the gene (or group of genes) more likely
to cause the specific defect. Nonetheless, the
extremely high level of genetic heterogeneity advice
against a gene-after-gene strategy, while high-
Calderisi, M., Ceppa, I., Cassandrini, D., Trovato, R., Bertocci, G., Tonacci, A., Astrea, G., Conte, R. and Santorelli, F.
A Novel Approach to Gene Analysis: Gene Panels and Cluster Definition to Assist Genotyping Patients with Congenital Myopathies.
DOI: 10.5220/0007396003450352
In Proceedings of the 12th International Joint Conference on Biomedical Engineering Systems and Technologies (BIOSTEC 2019), pages 345-352
ISBN: 978-989-758-353-7
Copyright
c
2019 by SCITEPRESS – Science and Technology Publications, Lda. All rights reserved
345
throughput strategies are recommended. Indeed, the
combination of large genomic dataset, obtained by
massive analysis of multiple genes with methods of
next-generation sequencing (NGS), with clinical and
morphological findings and MRI results has
increased our chances to reach a precise molecular
definition in CMD and CM (Savarese et al., 2016).
The application of NGS platforms generates an
unprecedented amount of data, and this makes
management, storage and, above all, analysis of the
data a real challenge (Pop et al., 2008). This amount
of data is such that an interconnected system
(pipeline data) with very high operational capacity is
required to allow its management and processing (Li
et al., 2008). Moreover, targeted NGS platforms
offer sufficient depth of “coverage”, molecular
definition of causative variants but also a plethora of
variants that are not clearly pathogenic per se but
may have a modifying effect on the phenotype.
Whilst several public and commercial tools are
available to prioritize rare gene variants emerging in
NGS studies of CMD and CM (Savarese et al., 2016;
Astrea et al., 2018) and attribute causality to a
specific clinical condition, how the myriad of
additional less rare or frequent gene mutations
contribute to a specific disorder remain largely
unexplored.
In this manuscript, we designed a novel targeted
gene panel (MotorPlex7.0) able to analyze massively
over 200 genes in a subset of CM and CMD patients
and elaborate the resulting set of data using non
metric multidimensional scaling (nMDS), a
multivariate data mining algorithm that uses the
information about the specific variants found in each
patient to (i) compare CM and CMD groups of
patients; (ii) identify groupings of patients; (iii)
identify if specific genes or variants can cluster and
be associated with clinical manifestations.
2 METHODS
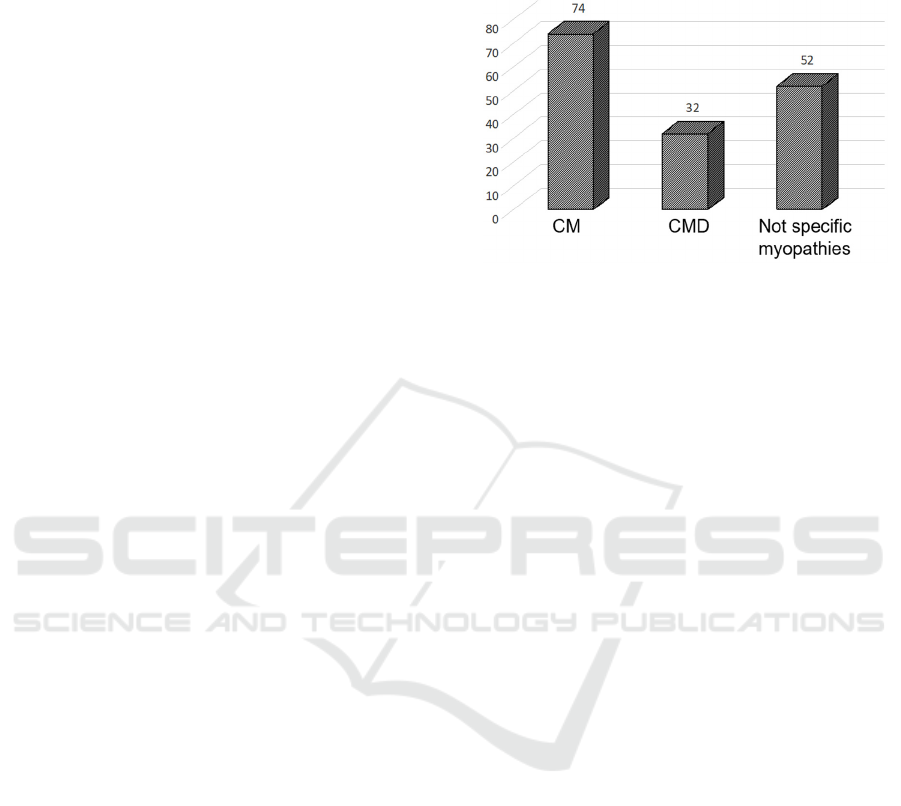
We genotyped a sample of 159 patients (71 men and
56 women), with a clinical and morphological
diagnosis of CM (127) and CMD (32) (see Figure 1
for details) using MotorPlex7.0 (Savarese et al.,
206), a validated targeted gene panel containing 241
muscular genes (for a total of 1.287 Mbp of DNA)
designed with the SureSelect technology (Agilent,
Santa Clara, CA). Among the CM patients, clinical
criteria fully met a definition of “congenital
weakness and slow muscle disease progression”
(North KN et al., 2014) in 72 cases whereas 54
patients had less specific clinical features
overlapping other neuromuscular conditions or not
sufficient data to define a CM disorder (“not specific
myopathies”).
Figure 1: Distribution of patients based on clinical
diagnosis.
Aligning, call, and interpretation for the analysis
of the data, were performed using the following
softwares: SureCall (Algilent) for the assembly and
alignment phase, and Ingenuity Variant analysis
(QIAGEN, Hilden, Germany) and wANNOVAR
(wannovar.wglab.org) for the variant calls phase and
interpretation. The following criteria had to be met
to reach a judgment of sequence accuracy: a quality
score greater than 30 and a coverage of at least 80
reads. Freely available softwares (PolyPhen 2,
http://genetics.bwh.harvard.edu/pph2/, and SIFT,
http://sift.jcvi.org/) were used to predict the
pathogenic effect of gene mutations. The MAF
(minor allele frequency) was calculated referring to
allele frequencies in several open-access population-
based gene variant polymorphic databases (gnomad.
broadinstitute.org, exac.broadinstitute.org/, www.
ncbi.nlm.nih.gov/projects/SNP; www.international
genome.org/1000-genomes-browsers/) and selecting
as rare variants those with an allele frequency of
0.1% (in an autosomal recessive or an X-linked
model of inheritance) and 0.01% (in an autosomal
dominant model of transmission.
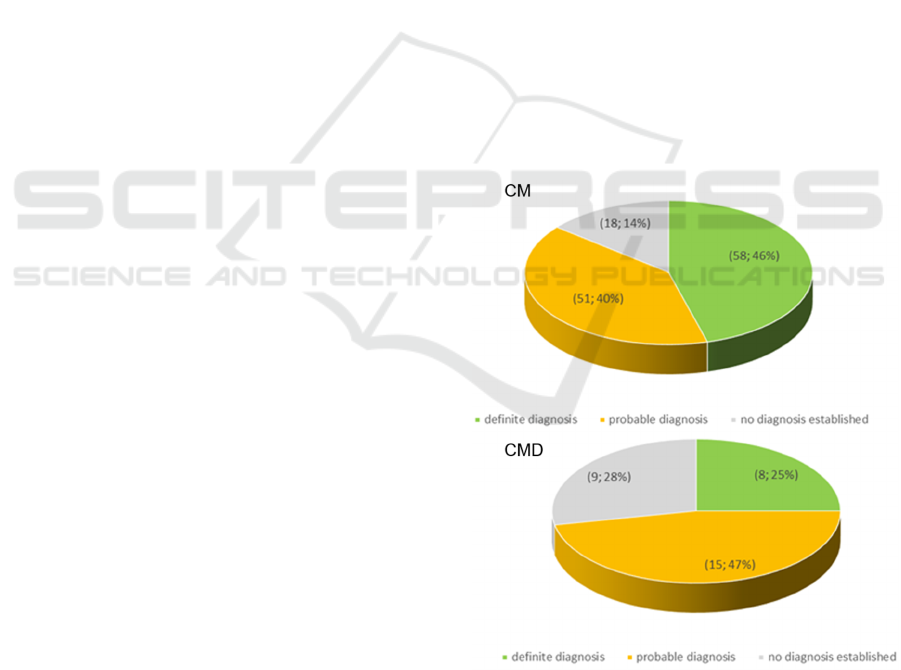
The patients were divided into three subgroups
on the basis of the certainty of their molecular
diagnosis. The group with a “definite diagnosis”
contains patients with published pathogenic
mutations and presenting a clinical phenotype
compatible with the mutation identified. The group
with a “probable diagnosis” includes patients having
rare mutations considered to be pathogenic based on
in silico bioinformatic tools and showing clinical
manifestations matching a phenotype that has
already been linked to mutations in that specific
gene. Cases not matching the above criteria were
defined as “no diagnosis established”.
HEALTHINF 2019 - 12th International Conference on Health Informatics
346
To understand if the plethora of common
variants could address specific phenotypes and assist
in clustering specific gene/clinical phenotype
correlations, we analyzed the variants dataset using
the well-established multivariate algorithm nMDS.
The aim of nMDS (Cox et al., 2001, Coxon et al.,
1982) is to collapse information from more than one
dimension into a smallest number of dimensions, so
that they can easily be visualized and interpreted. It
is a way of visualizing the level of similarity of
individual cases of a dataset. Unlike other ordination
techniques that primarily rely on Euclidean
distances, nMDS uses rank orders, and thus is an
extremely flexible technique that can accommodate
a variety of different kinds of data.
nMDS works analyzing the relationship between
the dissimilarities in the item-item matrix and the
distances between items, and the location of each
item in the designated low-dimensional space. In
order to do this a cost function called “Stress”,
which account of the difference between the
distances in the original space and in the reduced
one, is minimized. Different distances could be used
with this algorithm, depending on the type of data
analyzed. The genomic dataset for this study
consisted of binary data, representing the presence
or absence of a specific variant in each patient. We
used the Jaccard distance measure as a metric for
this analysis, since it is a well spread metric for
measuring dissimilarity between data sets based on
their shared and non-shared members (Tan et al.
(2005)).
To further explore the results of the nMDS
analysis we then applied a clustering algorithm on
the data projection. We used k-means (J. B.
MacQueen (1967)), an unsupervised learning
method for clustering, that aims at classifying a
given data set through a certain number of clusters
(assume k clusters) fixed a priori. The main idea of
the algorithm is to define k centroids, one for each
cluster, and to take each point belonging to a given
data set and associate it to the nearest centroid. The
algorithm works iteratively to assign each data point
to one of k groups based on the features that are
provided. The k centroids change their location step
by step until no more changes are done.
The data analysis was performed using the statistical
software R and the package vegan (Jari Oksanen et
al. 2018). To facilitate data analysis and exploration,
a web application that allows for an interactive
exploration of the data from the Ingenuity software,
guided by the nMDS model, has been developed.
3 RESULTS
Of the 159 patients analyzed, 66 cases (41%)
received a definitive molecular diagnosis with
MotorPlex7.0. A total of 122 patients (66 with a
“definitive diagnosis” and 66 with a “probable
diagnosis”) were identified. In details, 58 CM (33
men and 25 women, mean age at examination 38
years, mean disease duration 19 years) and 8 CMD
patients (2 boys and 6 girls, mean age at
examination 7 years, mean disease duration 5 years)
had a full molecular definition (see Figure 2). CM
patients who received a definitive diagnosis
harboured mutation mostly in RYR1 (16%) and in
TTN (17%, Figure 3). About half of the CMD
patients who received a definitive diagnosis
harboured mutation in LAMA2. We observed that
there were no significant differences in diagnostic
accuracy between the CM cases and those termed
“not specific myopathy” (Figure 4). Overall, there
were 27 “no diagnosis established” patients (18 CM
and 9 CMD) implying a diagnostic yield of 76%, a
value that is in keeping with the diagnostic rate
observed by other groups using similar size NGS
panels (see Nigro and Savarese 2016 for a review).
Figure 2: Distribution of patients based on the result of the
genetic investigation.
A Novel Approach to Gene Analysis: Gene Panels and Cluster Definition to Assist Genotyping Patients with Congenital Myopathies
347
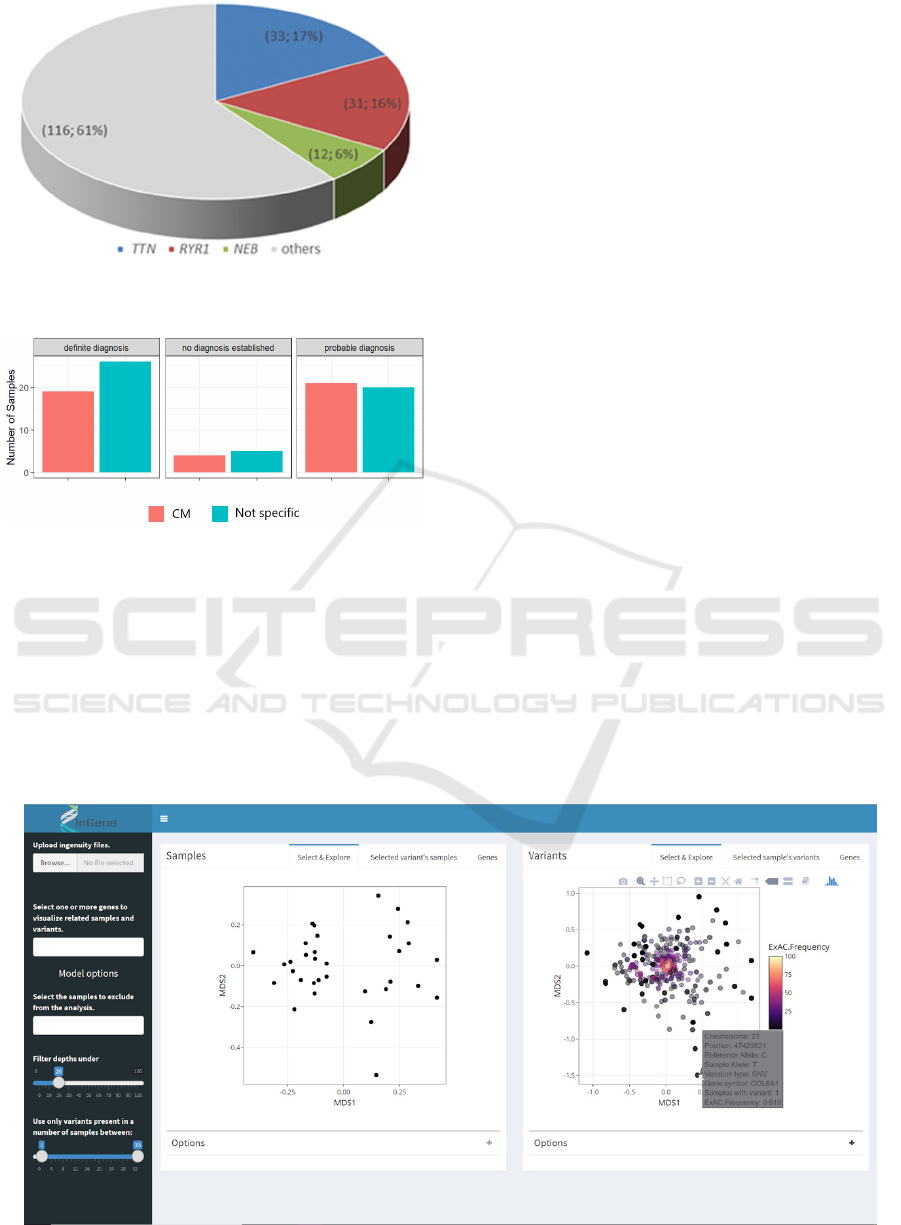
Figure 3: Distribution of mutated genes in patients
diagnosed with congenital myopathy.
Figure 4: Differences in diagnostic accuracy between the
CM cases and those termed “not specific myopathy”.
3.1 nMDS Analysis Software
The first part of this analysis was performed using a
web application developed for this purpose. Using
the application, we were able to explore the dataset
generated from the Ingenuity software in an
intuitive, interactive and fast manner, guided by the
multivariate nMDS model. The app was developed
using R (R Core Team (2018)) and the package
shiny (Chang et al. 2018).
A menu allows for the upload of a dataset and
the application of a series of filters. It is possible to
upload more than one dataset file at the same time:
the app will join these files together to create a
single set of data for the analysis.
After uploading the dataset, three filters are
available. The first one is a sample selection filter.
By means of this filter the user can choose which
samples wants to exclude from the analysis. The
second filter is a depth filter. Through this filter the
user can choose a threshold for the read’s depth. It
allow to dynamically change the value of depth at
which a read should be considered reliable. Finally,
the app provides a variant filter, based on the
number of samples a variant is present in. The filter
allows for the specification of a lower filter (only
keep variants that are present in almost n samples)
and an upper filter (only keep variants that are
present in at most m samples). This filter enables the
elimination of variants that are too rare or too
common, that do not add useful information for the
nMDS analysis.
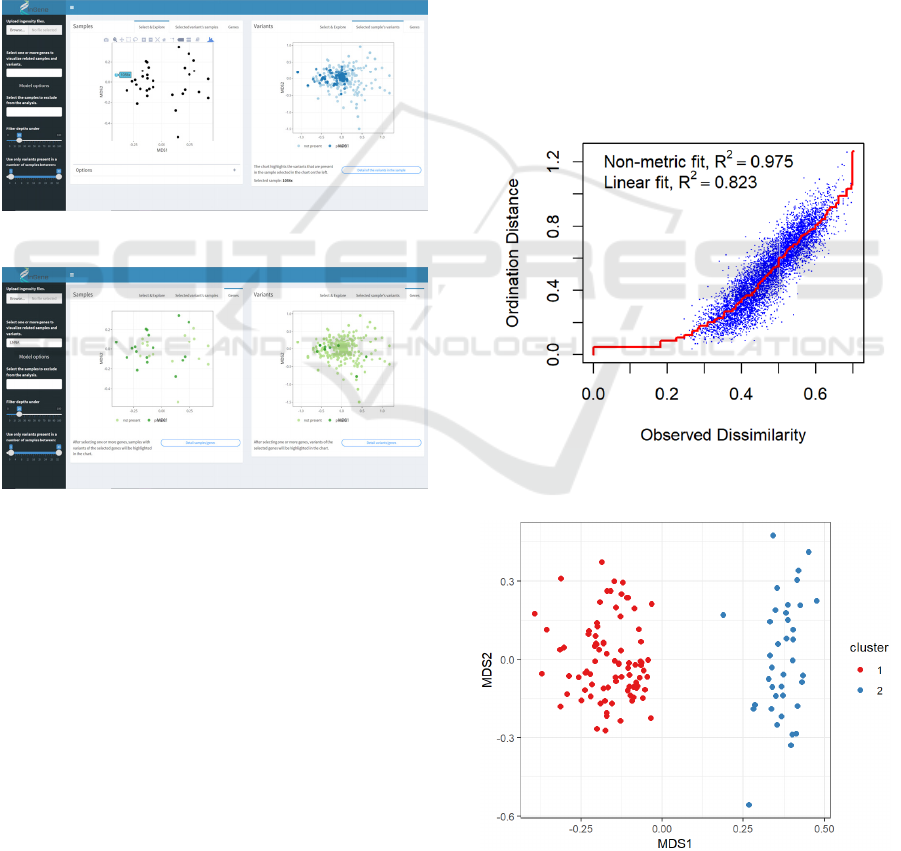
The main panel of the application shows two
charts. The one on the left is the nMDS
representation of the samples in the new reduced
dimensional space, useful to investigate if the
ordering algorithm discovers some kind of grouping
in the data. The plot on the right represents the
projection onto the nMDS coordinate space of the
variants (figure 5). By comparing these two graphs it
is possible to link a possible grouping of the samples
to specific set of variants: variants that fall on the
Figure 5: Application for the exploration of the Ingenuity dataset.
HEALTHINF 2019 - 12th International Conference on Health Informatics
348
right side of the chart will be more common in
patients that also falls in that part of the chart, and
vice versa. Also, variants that are located in the
centre of the nMDS chart are very common in the
analyzed dataset, and so are not very informative for
the analysis. This is the way the software also
provides the user with a filter to remove those very
common variants from the dataset and recompute
immediately the nMDS model.
By clicking on a sample in the nMDS score
chart, the app shows the variants that were found in
that specific patient, by highlighting them inside the
variants chart (figure 6). Moreover, by clicking on a
variant, the app shows which samples had it by
highlighting them in the score chart.
Figure 6: Highlight of variants in selected sample.
Figure 7: Highlight of samples and variants related to a
specific gene.
Furthermore, it is possible to explore the presence of
mutations of a specific gene in the dataset: after the
selection of a gene (or a set of genes) of interest, the
application shows which samples had a variation of
that gene and how these variations were distributed
in the nMDS coordinate space.
3.2 Multivariate Analysis Results
A first analysis was performed on 96 CM and 31
CMD patients, to evaluate if the model could be able
to distinguish between the two clinical conditions.
However, this analysis was heavily influenced by
the fact that the two datasets presented a very
different number of variants. The CM panel consists
in fact of about 20000 variants, whereas the CMD
one contains about 400 variants. Since the nMDS
algorithm uses the presence or absence of variants in
a sample to determine the projection of those in the
new space of coordinates, this difference between
the two panels was the only information that the
algorithm was able to find in the data (not shown).
We then analyzed the two datasets using only the
222 variants that were present at least once in both
panels. Figure 8 shows the stress plot of the model
computed using only those variants. The stress plot
is a Shepard plot where ordination distances are
plotted against the original sample’s dissimilarities,
and the fit is shown as a monotone step line. The
figure also shows two correlation like statistics of
goodness of fit. The correlation based on stress (non
metric fit) is
=1−
, where S is the final stress
value of the model. The fit-based
is the
correlation between the fitted values and ordination
distances (linear fit).
Figure 8: Stress plot of the nMDS model applied to the
common variants of CM and CMD datasets.
Figure 9: Clusters in the nMDS model of the CM and
CMD datasets.
A Novel Approach to Gene Analysis: Gene Panels and Cluster Definition to Assist Genotyping Patients with Congenital Myopathies
349
The model highlights a grouping of the samples
in two clusters (cluster 1 and cluster 2 in Figure 9).
Although we could observe a trend to more
represented CM in cluster 1 and CMD in cluster 2
(e.g., 36% versus 21% of total cluster), this sub-
grouping could not be related satisfactorily to the
different clinical conditions. The grouping also
appeared not correlated to the accuracy of diagnosis
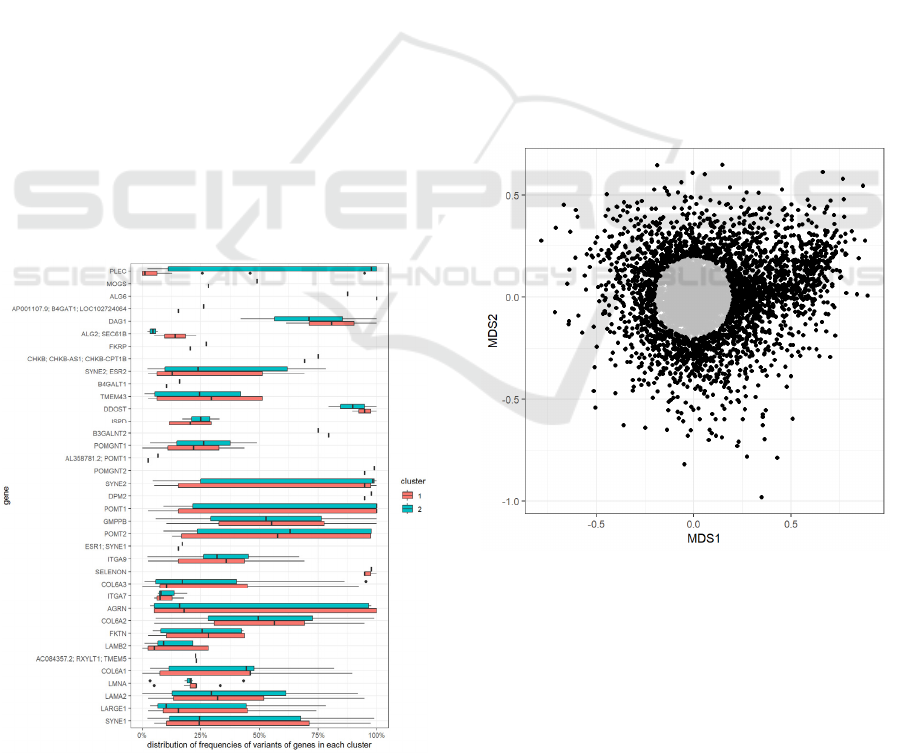
or phenotype. To determine the most characterizing
variants of each cluster, we considered the variants
that were found in more than 50% of the samples of
only one of the two clusters. We found that a subset
of variants was very common in cluster 2 and almost
absent from cluster 1. These variants were all
mutations of the PLEC gene (Figure 10), that was
found to be the gene that better explained the
clusterization of the samples in the two groups.
To further investigate the capabilities of the
model, we performed an nMDS analysis on the
dataset consisting of the CM patients only. A first
model (with a non-metric fit, R2= 0.968 and a linear
fit, R2= 0.728; not shown) did not highlight any
particular clustering of the data. However, by
looking at the variants chart we noticed that a big
chunk of those were located in the centre of the plot,
meaning that they were very common in the
majority of the samples in the dataset. We then
decided to repeat the analysis removing the variants
that were in the circle of radius 0.2 of the nMDS
Figure 10: Distribution of frequencies of variants of each
gene, per cluster.
space (Figure 3A) and this produced a better fit and
stress model (Figure 11). With this second analysis,
a defined grouping of the samples emerged.
We applied a clustering algorithm to the model’s
projection of the samples, in order to determine what
groups emerged from the nMDS. We used the k-
means clustering algorithm, and we determined the
value of the parameter k (number of clusters) by
plotting the total within-cluster sum of squares for
different values of this parameter (knee plot). We
decided to set k=3; the results of the clustering
algorithm are shown in Figure 12. Again, the groups
highlighted by the model did not appear to be related
to neither the diagnosis nor the phenotype. We
selected the variants that were found to be present in
more than 60% of the samples of only one of the
three clusters: this way we were able to identify the
characterizing variants of each one of the clusters,
and then to determine the corresponding genes. We
found that cluster 2 had a higher occurrence of
variants in the RYR1 gene compared to the other
two clusters, whereas the samples in cluster 3 had a
higher occurrence of variants of the TTN gene
(figure 13).
Figure 11: Selection of variants based on the projection
onto the nMDS new coordinate space.
HEALTHINF 2019 - 12th International Conference on Health Informatics
350
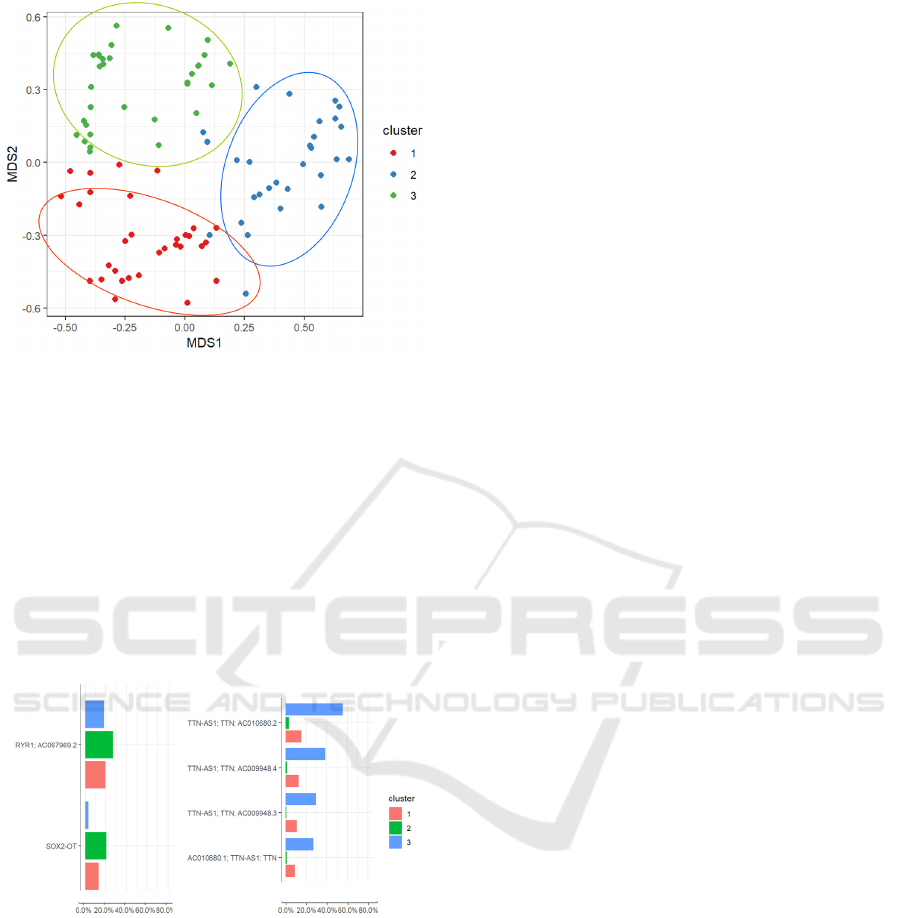
Figure 12: Clustering of samples from the CM dataset,
projected in the nMDS space.
4 DISCUSSION
This study illustrates the use of a large gene panel
(MotorPlex7.0) to investigate the molecular
determinants in a group of patients with CM or
CMD. We also analyzed the genomic data to
investigate how patients and mutations can be
clustered on the basis of their phenotype or
characterizing gene variant.
Figure 13: Most frequent genes in cluster 2 (RYR1) and 3
(TTN).
Our results indicate the following considerations.
First, we examined a relatively large dataset and
discovered mutations of diagnostic significance in
over 75% of the patients illustrating both the
accuracy of clinical and morphological criteria used
to diagnose patients and the diagnostic power of our
panel. Second, we studied this dataset using
multivariate data analysis techniques able to define
clusters between different clinical phenotypes and
list of gene variants (rare and common). The novel
module could identify the characterizing PLEC
gene, the gene that encodes plectin-1, one of the
largest polypeptides known representing a major
component of intermediate filament believed to
provide mechanical strength to cells and tissues by
acting as a cross-linking element of the cytoskeleton.
The identification of PLEC mutations especially in
cluster 1 where CM more than CMD cases appear to
be present is well in line with the more “structural”
effects that genes associated with CM disrupt in
skeletal muscle. Third, and finally, our novel
approach opens to the possibility to define a new
dimension when mutations and clinical
manifestations are correlated. Hopefully this could
contribute new molecular targets of gene modifiers
in the heterogeneous muscular dystrophies and
myopathies.
ACKNOWLEDGEMENTS
This work was partially funded by Regione Toscana
FAS SALUTE 2014 (to FMS and MC, CUP
4042.16092014.066000060) and Telethon
Foundation grants GUP13004 to GA).
REFERENCES
Astrea G, Romano A, Angelini C, Antozzi CG, Barresi R,
Battini R, et al. Broad phenotypic spectrum and
genotype-phenotype correlations in GMPPB-related
dystroglycanopathies: an Italian cross-sectional study.
Orphanet J Rare Dis. 2018; 13(1):170
Bonnemann CG, Wang CH, Quijano-Roy S, Deconinck N,
Bertini E, Ferreiro A, et al. Diagnostic approach to the
congenital muscular dystrophies. Neuromuscul
Disord. 2014; 24(4):289-311
Cassandrini D, Trovato R, Rubegni A, Lenzi S, Fiorillo C,
Baldacci J, et al. Congenital myopathies: clinical
phenotypes and new diagnostic tools. Ital J Pediatr.
2017; 43(1):101
Li H, Ruan J, Durbin R. Mapping short DNA sequencing
reads and calling variants using mapping quality
scores. Genome Res. 2008; 18:1851-8
Nigro V, Savarese M. Next-generation sequencing
approaches for the diagnosis of skeletal muscle
disorders. Curr Opin Neurol. 2016; 29(5):621-7
North KN, Wang CH, Clarke N, Jungbluth H, Vainzof M,
Dowling JJ, et al. Approach to the diagnosis of
congenital myopathies. Neuromuscul Disord. 2014;
24:97-116.
O'Grady GL, Lek M, Lamande SR, Waddell L, Oates EC,
Punetha J, et al. Diagnosis and etiology of congenital
muscular dystrophy: We are halfway there.Ann
Neurol. 2016 Jul;80(1):101-11
A Novel Approach to Gene Analysis: Gene Panels and Cluster Definition to Assist Genotyping Patients with Congenital Myopathies
351

Pop M, Salzberg SL. Bioinformatics challenges of new
sequencing technology. Trends Genet. 2008;24:142-9
Savarese M, Di Fruscio G, Torella A, Fiorillo C, Magri F,
Fanin M, et al. The genetic basis of undiagnosed
muscular dystrophies and myopathies: Results from
504 patients. Neurology. 2016;87(1):71-6
Cox, T.F.; Cox, M.A.A. (2001). Multidimensional
Scaling. Chapman and Hall.
Coxon, Anthony P.M. (1982). The User's Guide to
Multidimensional Scaling. With special reference to
the MDS(X) library of Computer Programs. London:
Heinemann Educational Books.
J. B. MacQueen (1967): "Some Methods for classification
and Analysis of Multivariate Observations,
Proceedings of 5-th Berkeley Symposium on
Mathematical Statistics and Probability", Berkeley,
University of California Press, 1:281-297
Tan, Pang-Ning; Steinbach, Michael; Kumar, Vipin
(2005), Introduction to Data Mining, ISBN 0-321-
32136-7.
R Core Team (2018). R: A language and environment for
statistical computing. R Foundation for Statistical
Computing, Vienna, Austria. URL https://www.R-
project.org/
Jari Oksanen, F. Guillaume Blanchet, Michael Friendly,
Roeland Kindt, Pierre Legendre, Dan McGlinn, Peter
R. Minchin, R. B. O'Hara, Gavin L. Simpson, Peter
Solymos, M. Henry H. Stevens, Eduard Szoecs and
Helene Wagner (2018). vegan: Community Ecology
Package. https://CRAN.R-project.org/package=vegan
Winston Chang, Joe Cheng, JJ Allaire, Yihui Xie and
Jonathan McPherson (2018). shiny: Web Application
Framework for R. https://CRAN.R-project.org/
package=shiny
HEALTHINF 2019 - 12th International Conference on Health Informatics
352
