
Modeling (Multi-)Morbidity and (Poly-)Pharmacy in Outpatient
Treatment with Gamma Distributions
Reinhard Schuster
1
, Thomas Ostermann
2
and Timo Emcke
3
1
Chair of Department of Health Economics, Epidemiology and Medical Informatics, Medical Advisory Board of Statutory
Health Insurance in Northern Germany, Katharinenstraße 11, 23554 L
¨
ubeck, Germany
2
Chair of Research Methodology and Statistics in Psychology, Witten/Herdecke University,
Alfred-Herrhausen-Straße 50, 58448 Witten, Germany
3
Chair of Department of Prescription Analysis, Association of Statutory Health Insurance Physicians,
Bismarckallee 1-6, 23812 Bad Segeberg, Germany
Keywords:
Multimorbidity, Polypharmacy, Outpatient Treatment, Big Data, Gamma Distribution, Shannon Entropy.
Abstract:
Polypharmacy is often direcly causes by age and gender dependent multimorbidity. Todays treatment con-
cepts, the individual decisions taken by physicians and the administration have to adress the complex needs of
multimorbid patients. For modeling those phenomena on a collective level of an entire federal state a sufficient-
ly large data repository is essential. The administrative bodies of the statutory health insurance in Germany
have the data necessary and built up an extensive skill-set and inexpensive free-software tool-set for those
evaluations. This study analyses the complete patient data of all outpatient treatments and drug prescriptions
in Schleswig-Holstein (Northern German federal state) in the first quarter of 2017. Well adopted probability
distributions for the frequency of diseases and drug groups decreasingly ordered within the classification sy-
stem for all patients and age/gender partitions are estimated. Subsequently the levels of multimorbidity and
polypharmacy (level of ICD-10/ATC-codes per quarter) are analysed in the same way. As a main result gamma
distributions provide a well-adjusted model class for ICD and ATC code frequencies in the present very large
routine dataset. The goodness-of-fit (full range of magnitudes of measurements) is much better than using
mean values and variances.
1 INTRODUCTION
Multimorbidity and polypharmacy are major challen-
ges for healthcare systems cf. (Dormann, H., Sonst,
F., Vogler, R., Patapovas, A., Pfistermeister, B., Plank-
Kiegle, B., Kirchner, M., Hartmann, N., Burkle, T.
Maas, R., 2013; Fortin, M., Hudon, C., Haggerty, J.,
Akker, M., Almirall, J., 2010; Islam, M. M., Valderas,
J. M., Yen, L., Dawda, P., Jowsey, T., McRae, I. S.,
2014; Jeschke, E., Ostermann, T., Vollmar, HC, Taba-
li, M., Matthes, H., 2012; Glynn, L.G., Valderas, J.M.,
Healy, P., Burke, E., Newell, J., Gillespie, P., Mur-
phy, A. W., 2011; Maher, R. L., Hanlon, J., Hajjar,
E. R., 2014; Mitty, E., 2009; Salwe, K. J., Kalyan-
sundaram, D., Bahurupi, Y., 2016). Costs and com-
plications for chronic patients usually increase accor-
ding to the number of comorbidities. Multimorbidity
and polypharmacy are often defined by the number of
diseases, disease groups, drugs or drug groups abo-
ve a certain threshold value using a low number of
categories. Adverse drug events, drug-drug and drug-
disease interactions are strongly connected with po-
lypharmacy cf. (Maher, R. L., Hanlon, J., Hajjar, E.
R., 2014). Polypharmacy can also increase the risk
of non-adherence, resulting in a suboptimal medicati-
on effectiveness and clinical consequences cf. (Glynn,
L.G., Valderas, J.M., Healy, P., Burke, E., Newell, J.,
Gillespie, P., Murphy, A. W., 2011). If the medication
non-adherence is not identified by the provider, they
either increase the initial dose or add a second agent
which in turn raises the health care costs and risk of
adverse drug events cf. (Jeschke, E., Ostermann, T.,
Vollmar, HC, Tabali, M., Matthes, H., 2012). The fre-
quency distributions for very large populations (big
data) are still mostly unknown because most publi-
cations consider special diseases with sample sizes
of a few hundred and up to thousand patients. Regi-
ster Studies usually address special aspects with den-
sity distribution analysis cf. (Johnell, K., Klarin, I.,
2007). The geriatric population is an example for high
prevalence of polypharmacy associated with multiple
comorbidities and advanced age cf. (Subeesh, V. K.,
Schuster, R., Ostermann, T. and Emcke, T.
Modeling (Multi-)Morbidity and (Poly-)Pharmacy in Outpatient Treatment with Gamma Distributions.
DOI: 10.5220/0007396503530358
In Proceedings of the 12th International Joint Conference on Biomedical Engineering Systems and Technologies (BIOSTEC 2019), pages 353-358
ISBN: 978-989-758-353-7
Copyright
c
2019 by SCITEPRESS – Science and Technology Publications, Lda. All rights reserved
353

Shivaskankar, V., Gouri, N., Sriram, S., 2015; Sub-
eesh, V. K., Gouri, N., Beulah, E. T., Shivaskankar, V.,
2017). In this paper the number of different diagnoses
and drug groups at certain code levels are considered
as multimorbidity and polypharmacy levels for pati-
ents and the related statistical distributions are analy-
zed. The same approach is taken for code frequencies.
In 2017 the statutory health insurances and the
associated physicians in the German federal state
of Schleswig-Holstein launched expenditure control-
ling of outpatient prescriptions by morbidity related
groups (MRG) cf. (Schuster, R., Emcke, T., Arnstedt,
E.v., Heidbreder, M., 2016; Emcke, T., Ostermann, T.,
v. Arnstedt, E., Heidbreder, M., 2017; Schuster, R.,
Ostermann, T., Heidbreder, M., Emcke, T., 2018). By
looking for the group with the highest drug costs on
the third level ATC (four characters) within a quarter
for each consulted physician and a certain patient the
MRG setting takes the patient level into account. In a
previous study the relations of the drug based MRG
groups and diagnoses of the patients were analyzed
using an age and gender standardization cf. (Schuster,
R., Emcke, T., Arnstedt, E.v., Heidbreder, M., 2016).
In the present analysis the density distributions of
multimorbity and polypharmacy levels as well as the
ordered frequency of cases with certain ICD-10 and
ATC codes are modeled by gamma distributions.
2 METHODS
We analyze all treatments and prescriptions of phy-
sicians for patients of the statutory health insuran-
ce (SHI) by SHI physicians in Schleswig-Holstein in
the first quarter of 2017 without age restrictions. The
analysis is patient-centered, meaning that the datasets
of all treatments and prescriptions of all physicians
with respect to a patient are used. The dataset co-
vers 2,044,690 patients and 1,411,087 patients with
drug prescriptions, and a pseudonymized patient ID
with age and gender information. We utilize the three-
character level of International Statistical Classificati-
on of Diseases and Related Health Problems [ICD].
The same diagnoses for the same patient by different
physicians are not counted repeatedly. For prescrip-
tion analysis the International Anatomic Therapeu-
tic Chemical (ATC) classification system with Ger-
man specifications provided by the German Institute
of Medical Documentation and Information (DIMDI)
is used. We analyze drug groups given by the four di-
git ATC (third level). The traditional approach uses
summary statistics of observations, such as mean or
variance, in order to find most likely probability dis-
tributions using the maximum entropy method. Frank
and Smith cf. (Frank, A. S., Smith, D.E., 2010) exten-
ded this method by incorporating information about
the scale of measurement. A gamma distribution has
a power law shape for small magnitudes and chan-
ges to an exponential shape for large magnitudes. The
scale information is included by a constraint for the
maximum entropy given by an interpolation between
the linear and geometric mean.
The hardware used to extract and link the da-
ta/master data is a dedicated Debian GNU/Linux Ser-
ver [current generation Intel i7, 16 GByte RAM] ad-
ministered by the Medical Advisory board of Statu-
tory Health Insurance in Northern Germany.It runs
a LAMP configuration (Debian GNU/Linux, Apache
2.4.29, Maria DB 10.3 [extensive use of partitioning]
and PHP 7.3 [with PEAR framework esp. for spreads-
heet output]).
The coding was done using the Perl programming
language and the command-line tools sed/sort/awk
for quick-prototyping tasks. For the statistical analy-
sis we used Mathematica by Wolfram Research in or-
der to get a curve fitting to a Gamma distribution for
ICD and ATC drug group frequencies as well as for
multimorbidity and polypharmacy frequencies. The
Wolfram language and Mathematica are free when
used on the small single-board computer Raspberry
Pi (eg. Raspberry Pi 3 - Model B: 1,2 Ghz Quadcore
- 1 GByte RAM).
The inexpensive open source/free software setup
makes the cooperation of different administrative bo-
dies possible. At the moment the hard- and software
setup is able to process the data of about 6-10 Million
patients.
3 RESULTS
On average the patients have 7.7 diseases at three-
character ICD level (figure 1).
male
female
0 5 10 15 20 25 30 35 40 45 50 55 60 65 70 75 80 85 90 95 100
0
5
10
15
age
multimorbidity
Figure 1: Age and gender dependent multimorbidity (mean
values).
HEALTHINF 2019 - 12th International Conference on Health Informatics
354
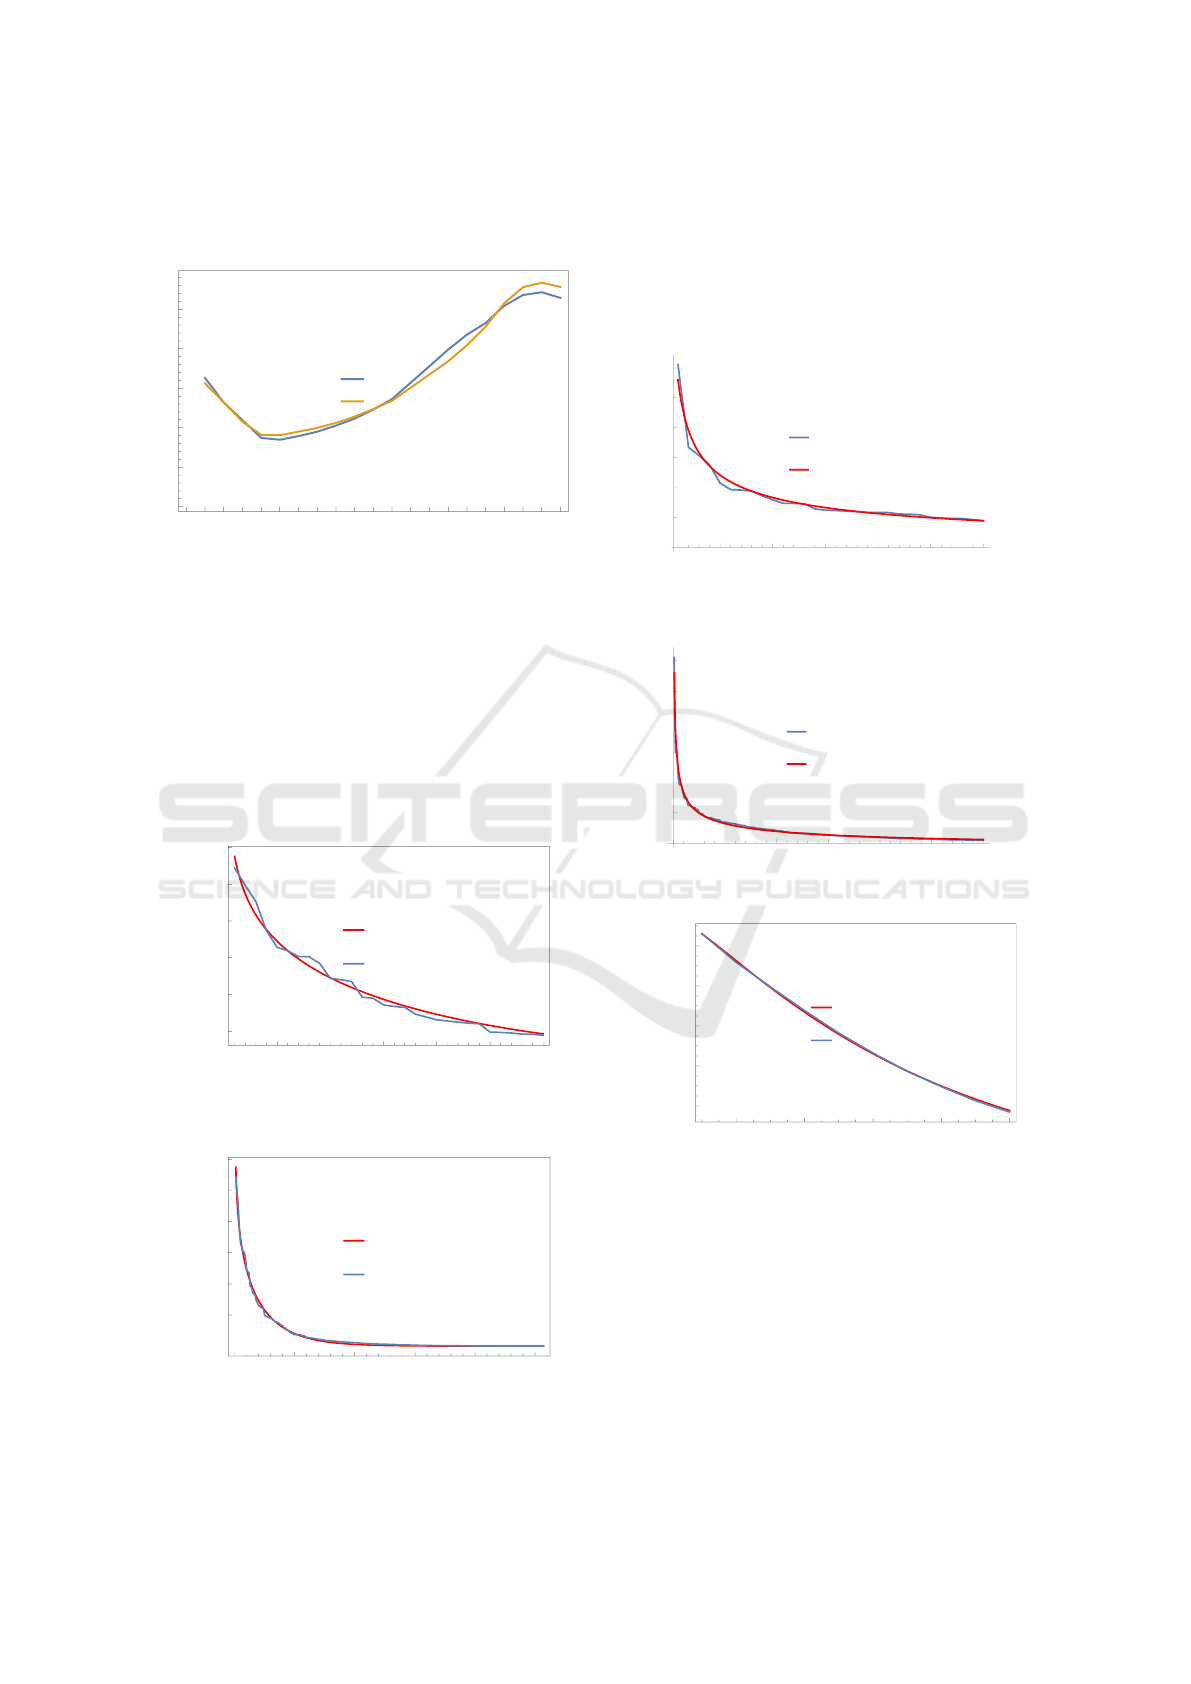
Patients with drug prescriptions on average have
3.2 drug groups at four digit ATC (3
rd
level) (figure 2).
male
female
0 5 10 15 20 25 30 35 40 45 50 55 60 65 70 75 80 85 90 95 100
0
1
2
3
4
5
age
polypharmacy
Figure 2: Age and gender dependent polypharmacy (mean
values).
The curve fit to a gamma function gives the sha-
pe value of 0.4366 (0.5404) for males (females) and
a decline value of 349.7 (223.0) for males (female).
For women the curve fit gets worse for the most fre-
quently used diagnoses, this effect is much weaker in
men. With even smaller differences, the opposite can
be stated for drug groups. This gives a shape value
of 0.07833 (0.7710) for males (females) and a decli-
ne value of 24.94 (27.88) for males (females). The fit
Gamma_fit
Data
5 10 15 20 25 30
50 k
100 k
150 k
200 k
250 k
300 k
ATC_code_number
number_of_patients
Figure 3: Curve fit (gamma function) for ATC frequencies
and for small magnitudes (data (blue), gamma fit (red)).
Gamma_fit
Data
0 50 100 150 200 250
50 k
100 k
150 k
200 k
250 k
300 k
ATC_code_number
number_of_patients
Figure 4: Curve fit (gamma function) for ATC frequencies
and large magnitudes (data (blue), gamma fit (red)).
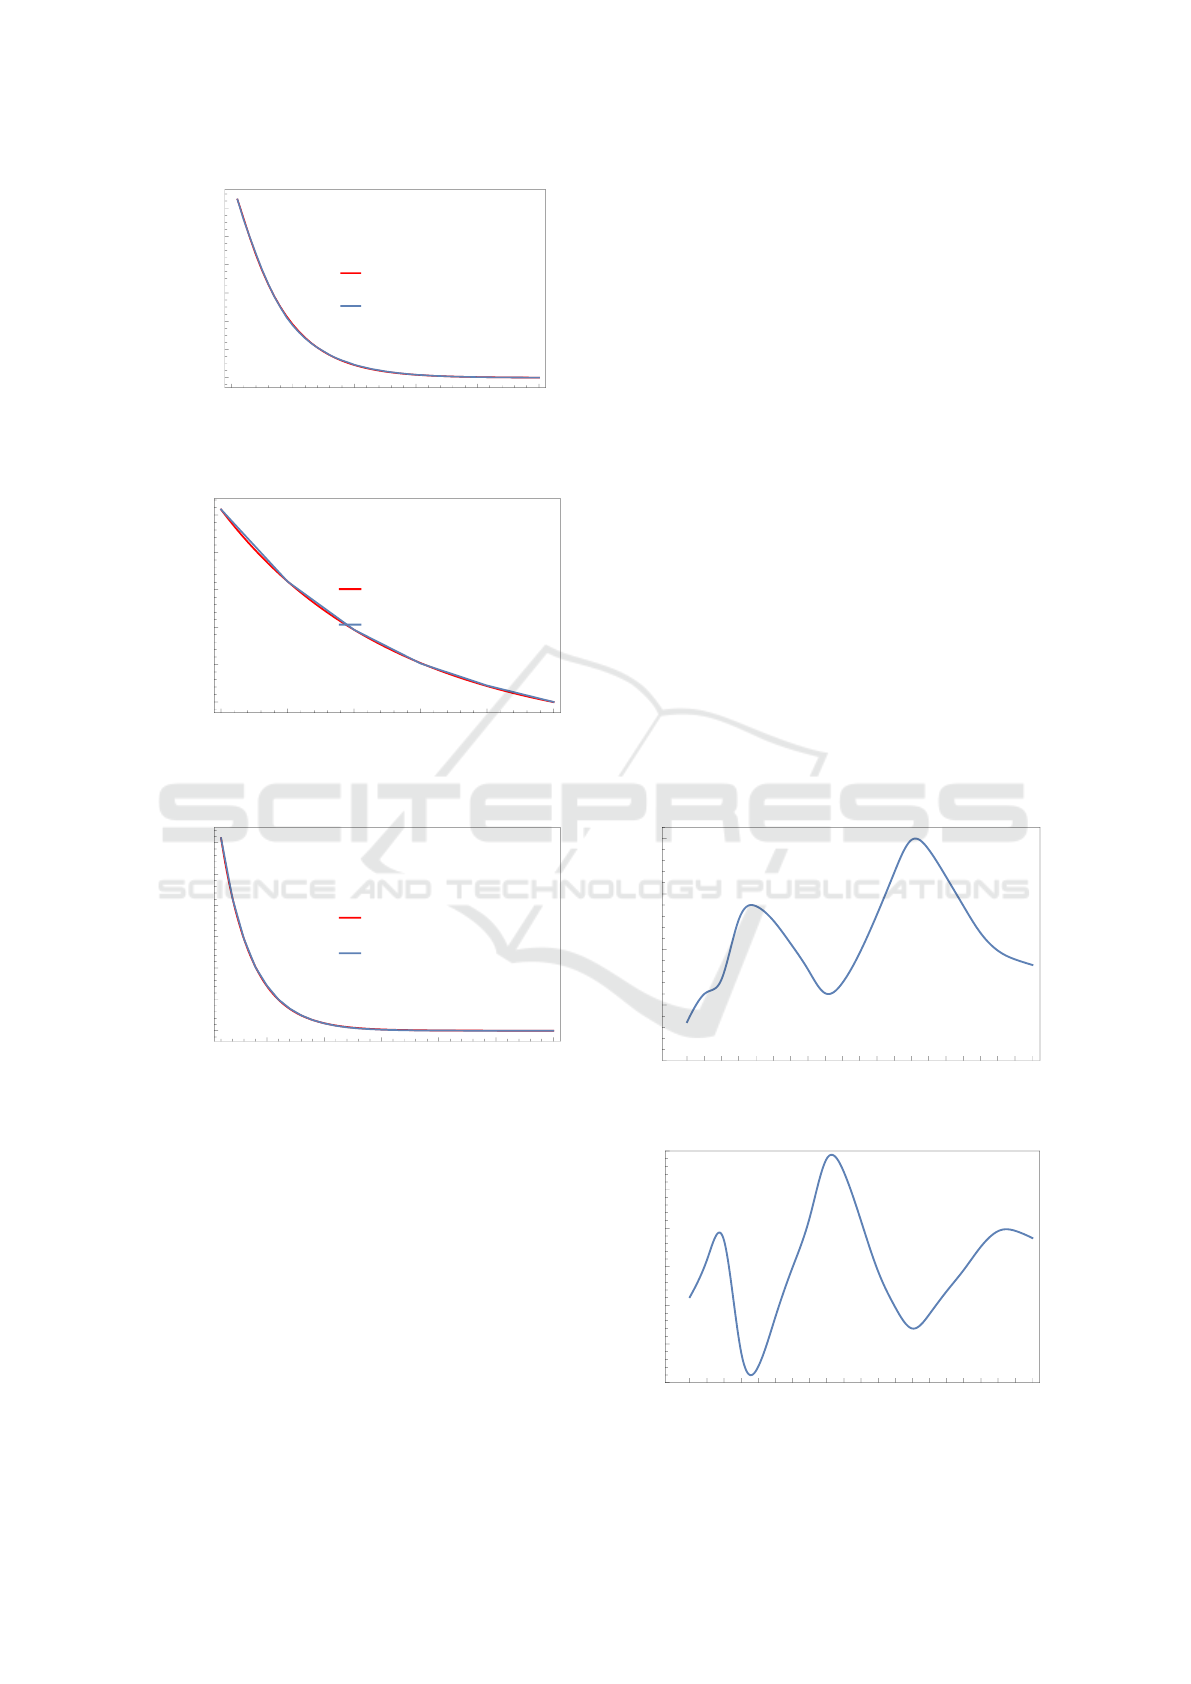
of the gamma distribution curves in figures 7,8,9 and
10 is much more exact with respect to multimorbidity
and polypharmacy level (number of different codes)
compared to the classification codes (ICD/ATC) con-
sidered in figures 3,4,5 and 6.
Data
Gamma fit
5 10 15 20 25 30
ICD
100 k
200 k
300 k
400 k
500 k
600 k
nr.patients
Figure 5: Curve fit (gamma function) for ICD diagnoses and
for small magnitudes (data (blue), gamma fit (red)).
Data
Gamma fit
50 100 150 200 250 300
ICD
100 k
200 k
300 k
400 k
500 k
600 k
nr.patients
Figure 6: Curve fit (gamma function) for ICD diagnoses and
large magnitudes (data (blue), gamma fit (red)).
Gamma_fit
Data
2 4 6 8 10
0.04
0.06
0.08
0.10
0.12
multimorbidity
fraction_of_patients
Figure 7: Curve fit for multimorbidity level (number of co-
des) and small magnitudes (data (blue), gamma fit (red)).
The ICD shape parameter is 1.0502 (0.9537,
1.1657) [total (male, female)] and the decline pa-
rameter has the value 6.798 (6.3856, 6.7730). The
ATC shape parameter is 0.9679 (0.9982, 0.9458) and
the decline parameter has the value 2.833 (2.7098,
2.8658).
The age depended mean values for the number of
diagnoses (multimorbidity level) and the number of
drug groups (polypharmacy level) show more gender
Modeling (Multi-)Morbidity and (Poly-)Pharmacy in Outpatient Treatment with Gamma Distributions
355
Gamma_fit
Data
0 10 20 30 40 50
0.00
0.02
0.04
0.06
0.08
0.10
0.12
multimorbidity
fraction_of_patients
Figure 8: Curve fit for multimorbidity level (number of co-
des) and large magnitudes (data (blue), gamma fit (red).)
Gamma_fit
Data
1 2 3 4 5 6
0.05
0.10
0.15
0.20
0.25
0.30
polypharmacy
fraction_of_patients
Figure 9: Curve fit for multimorbidity level (number of co-
des) and small magnitudes (data (blue), gamma fit (red)).
Gamma_fit
Data
5 10 15 20 25 30
0.00
0.05
0.10
0.15
0.20
0.25
0.30
polypharmacy
fraction_of_patients
Figure 10: Curve fit for multimorbidity level (number of co-
des) and lage magnitudes (data (blue), gamma fit (red)).
differences with respect to diagnoses than polyphar-
macy.
Looking at the Top ATC/ICD positions the gender
differences and the declining nature of the observati-
ons are easily observable (figures 11 and 12):
The only drug-classes where male prescriptions
outweigh are ace-inhibitors, lipid modifying agents
and antitrombotic drugs. In part this can be explai-
ned by the ranking and distribution of ICD-10 codes
in Figure 12.
But only the good modeling results of the gamma-
pos. nr. total nr. male nr. female ATC
drug group
1 272.139 119.789 152.350 C07A
beta blocking agents
2 248.248 111.943 136.305 M01A
an�inflammatory and an�rheuma�c
producs, non steroids
3 226.351 94.073 132.278 A02B
drugs for pep�d ulcer and gastro-
oesophageal reflux disease (GORD)
4 186.543 94.715 91.828 C09A
ACE inhibitors, plain
5 164.017 86.393 77.624 C10A
lipid modifying agents, plain
6 159.506 61.594 97.912 N02B
oter analgesics and antipyretics
7 151.619 79.182 72.437 B01A
antitrombotic agents
8 151.284 23.728 127.556 H03A
thyroid preparations
9 121.901 56.327 65.574 C08C
selec�ve calcium channel blockers
with mainly vascular effects
10 119.995 37.462 82.533 N06A
antidepressants
Figure 11: Top ATC positions (3
rd
level) by gender.
pos. nr. total nr. male nr. female ICD
disease
1 611.073 272.775 338.298 I10
Essential (primary) hypertension
2 334.167 152.057 182.110 E78
Disorders of lipoprotein metabolism
3 306.952 120.732 186.220 M54
and other lipidaemias Dorsalgia
4 276.101 129.866 146.235 J06
Acute upper respiratory infec�ons
of mul�ple and unspecified sites
5 214.569 84.568 130.001 H52
Disorders of refrac�on, accommoda�on
6 193.310 59.525 133.785 F32
Depressive episode
7 191.854 78.753 113.101 E66
Obesity
8 188.348 1.607 186.741 Z30
Contraceptive management
9 172.256 87.727 84.529 E11
Type 2 diabetes mellitus
10 159.089 71.618 87.471 Z00
General examina�on/inves�ga�on
of persons without complaint, diagnosis
diagnosis
Figure 12: Top ICD positions (3-character level) by gender.
distribution approach enable a sound age-dependent
computation of the decline as well as shape parame-
ters for e.g. diagnoses (figures 13 and 14):
0 5 10 15 20 25 30 35 40 45 50 55 60 65 70 75 80 85 90 95 100
0
100
200
300
400
age
Decline
Figure 13: Age dependent decline parameter (diagnoses).
0 5 10 15 20 25 30 35 40 45 50 55 60 65 70 75 80 85 90 95 100
0.30
0.35
0.40
0.45
0.50
0.55
0.60
age
Shape
Figure 14: Age dependent shape parameter (diagnoses).
HEALTHINF 2019 - 12th International Conference on Health Informatics
356
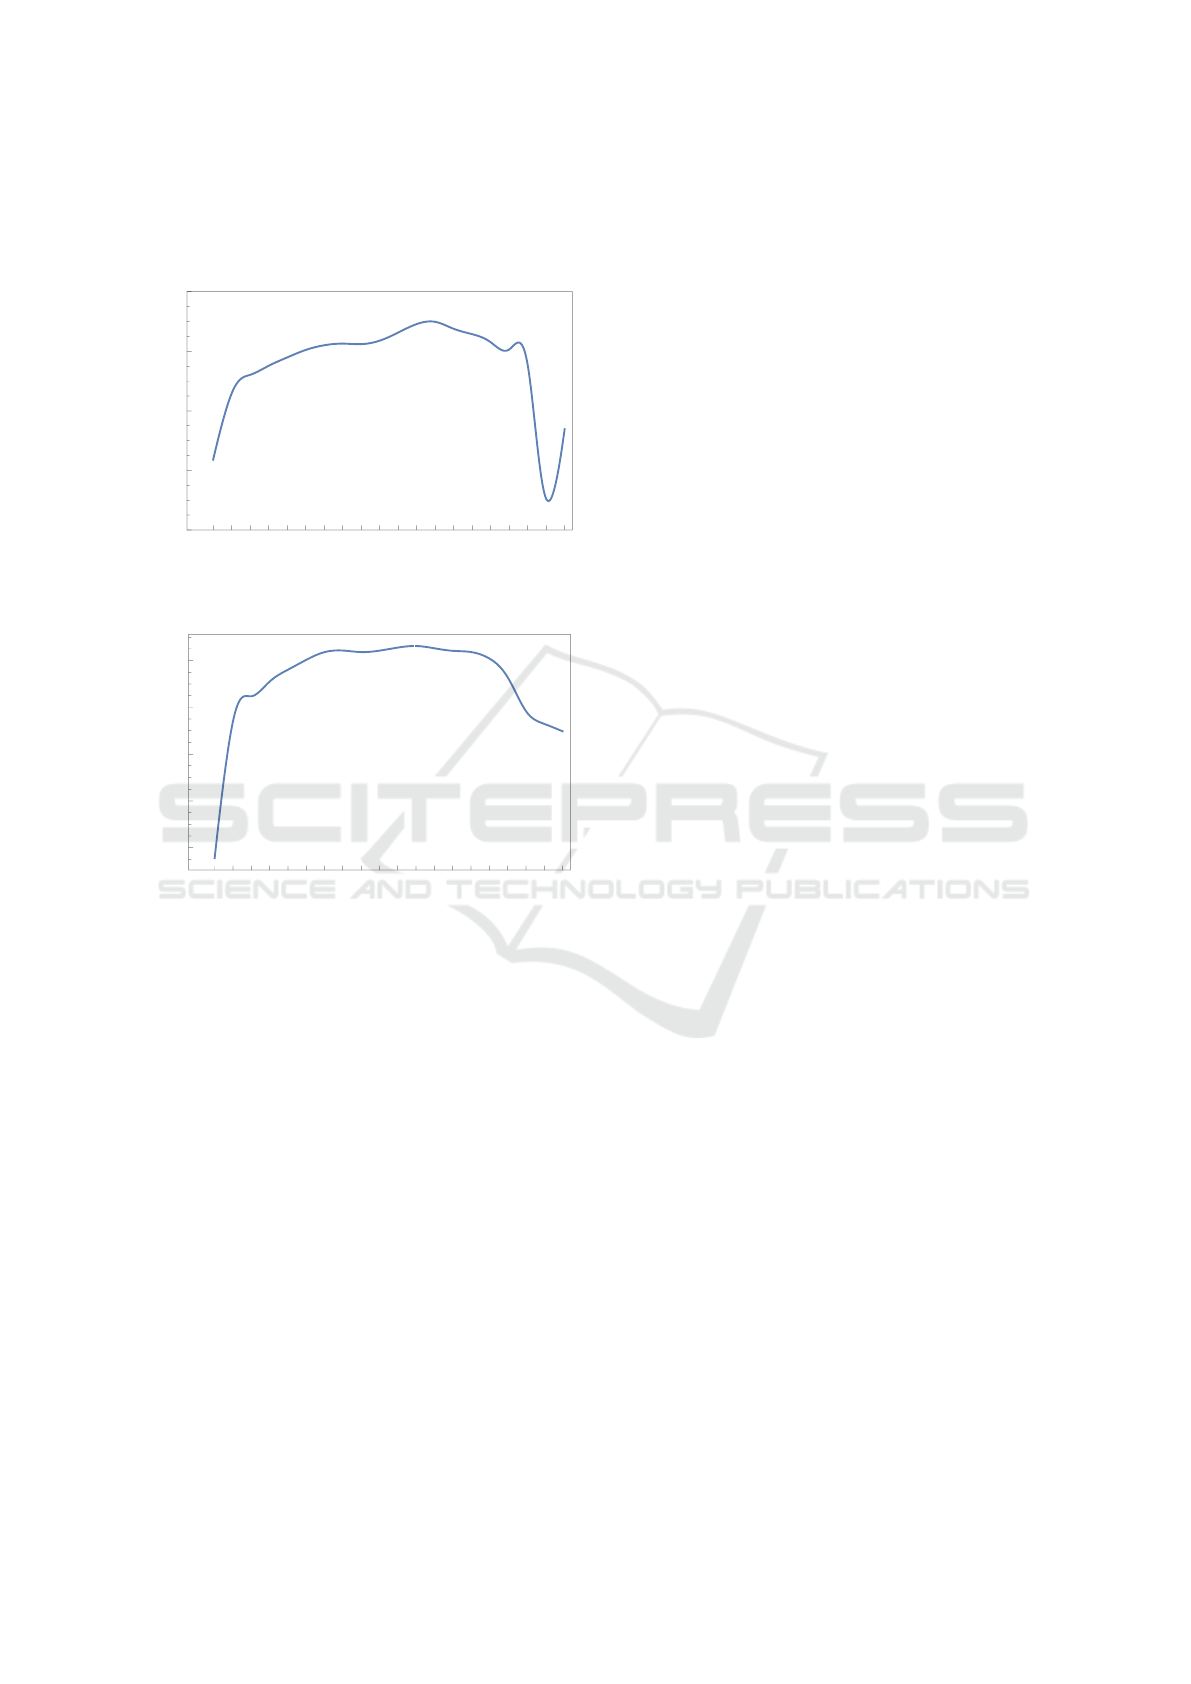
Additionally the corresponding age dependent
Shannon Entropies for diagnoses and drug prescrip-
tions are determined (figures 15 and 16):
0 5 10 15 20 25 30 35 40 45 50 55 60 65 70 75 80 85 90 95
3.4
3.6
3.8
4.0
4.2
age
drug related Shannon Entropy
Figure 15: Age dependent Shannon Entropy (drug prescrip-
tions).
0 5 10 15 20 25 30 35 40 45 50 55 60 65 70 75 80 85 90 95
4.8
5.0
5.2
5.4
5.6
age
diagnostic related Shannon Entropy
Figure 16: Age dependent Shannon Entropy (diagnoses).
4 DISCUSSION
Gamma distributions provide a well-adjusted model
class for ICD and ATC code frequencies in large rou-
tine datasets. The same holds true with respect to mul-
timorbidity and polypharmacy levels (number of co-
des). For small and large magnitudes the curve fitting
with respect to measurements provides better results
than using mean values and variances in order to de-
termine the two parameters of the gamma distribution.
In some cases the fit for intermediate values (between
small and large magnitudes) might deteriorate.
There are substantial differences in the mean num-
ber of diagnoses between male and female patients,
in the age group 25-29 years the females have 60 %
more diagnoses on three character level of ICD than
males, but only 6 % more drug groups at the four cha-
racter level of ATC. Without age considerations there
are 18 % more diagnoses for females, but 0.5 % fewer
drug groups. Partially this is an age structure effect.
In contrast to that, there are much smaller diffe-
rences in the frequency distributions of multimorbidi-
ty and polypharmacy levels among males and fema-
les, which are also gamma distributed.
5 CONCLUSIONS
Multimorbidity and polypharmacy levels have sub-
stantial impacts in health systems and policy especi-
ally against the background of demographic change.
The knowledge of the underlying density distributi-
ons at different scale levels and interactions may help
to organize patient oriented medical care and the he-
althcare marketplace.
If more than one disease and a variety of influ-
ences have to be considered, large datasets allow for
the development of powerful tools. If we use the two
parametric gamma distribution model, we can trans-
form reported mean values and variations to shape
and decline information and vice versa. Different sca-
les commonly found in nature provide a general me-
thod to analyze relations between measurements, in-
formation and probability.
REFERENCES
Dormann, H., Sonst, F., Vogler, R., Patapovas, A., Pfi-
stermeister, B., Plank-Kiegle, B., Kirchner, M., Hart-
mann, N., Burkle, T. Maas, R. (2013). Adverse drug
events in older patients admitted as an emergency:The
role of potentially inappropriate medication in elderly
people (priscus). Dtsch. Arztebl. Int., 110:213–219.
Emcke, T., Ostermann, T., v. Arnstedt, E., Heidbreder, M.
(2017). Comparison of Different Implementations of
a Process Limiting Pharmaceutical Expenditures Re-
qired by German Law. Healthinf 2017.
Fortin, M., Hudon, C., Haggerty, J., Akker, M., Almirall,
J. (2010). Prevalence estimates of multimorbidity: a
comparative study of two sources. BMC Health Serv
Res, 10:111.
Frank, A. S., Smith, D.E. (2010). Measurement Invariance,
Entropy and Probability. Entropy, 12:289–303.
Glynn, L.G., Valderas, J.M., Healy, P., Burke, E., Newell, J.,
Gillespie, P., Murphy, A. W. (2011). The prevalence of
multimorbidity in primary care and its effect on health
care utilization and cost. Family Practice, 28 (5):516–
523.
Islam, M. M., Valderas, J. M., Yen, L., Dawda, P., Jowsey,
T., McRae, I. S. (2014). Multimorbidity and comor-
bidity of chronic diseases among senior australiens:
Prevalence and patterns. PloS one.
Jaynes, E. T. (1957a). Information theory and statistical
mechanics. Phys. Rev., 106:620–630.
Jaynes, E. T. (1957b). Information theory and statistical
mechanics II. Phys. Rev., 108:171–190.
Modeling (Multi-)Morbidity and (Poly-)Pharmacy in Outpatient Treatment with Gamma Distributions
357

Jaynes, E. T. (2003). Probability Theory: The Logic of
Science. Cambridge University Press: New York, NY,
USA.
Jeschke, E., Ostermann, T., Vollmar, HC, Tabali, M., Matt-
hes, H. (2012). Depression, Comorbidities, and Pre-
scriptions of Antidepressants in a German Network
of GPs and Specialists with Subspecialisation in An-
throposophic Medicine: A LongitudinalObservational
Study. Evid Based Complement Alternat Med. 2012,
508623.
Johnell, K., Klarin, I. (2007). The relationship between
number of drugs and potential drug-drug interactions
in the elderly: A study of over 600,000 elderly patients
from the swedish prescribed drug register. Drug Saf.,
30:911–918.
Maher, R. L., Hanlon, J., Hajjar, E. R. (2014). Clinical con-
sequences of polypharmacy in elderly. Expert Opin.
Drug Saf., 13:57–65.
Mitty, E. (2009). Medication management in assisted living:
A national survey of policies and practices. J. Am.
Med. Dir. Assoc., 10:107–114.
Ostermann, T., Schuster, R. (2015). An Informationtheo-
retical Approach to Classify Hospitals with Respect
to Their Diagnostic Diverty using Shannon’s Entropy.
Proceedings of the International Conference on He-
alth Informatics (HealthInf), pages 325–329.
Salwe, K. J., Kalyansundaram, D., Bahurupi, Y. (2016). A
study on polypharmacy and potential drug-drug inter-
actions among elderly patients admitted in department
of medicine of a tertiary care hospital in puducherry.
J. Clin. Diagn. Res., 10:6–10.
Schuster, R., Emcke, T., Arnstedt, E.v., Heidbreder, M.
(2016). Morbidity Related Groups (MRG) for epide-
miological analysis in outpatient treatment. IOS Press,
pages 783–787.
Schuster, R., Ostermann, T., Heidbreder, M., Emcke, T.
(2018). Relations of Morbidity Related Groups
(MRG), ICD-10 codes and age and gender structure
in outpatient treatment. Proceedings of the 11th Inter-
national Joint Conference on Biomedical Engineering
and Technologies (BIOSTEC), HealthInf.
Subeesh, V. K., Gouri, N., Beulah, E. T., Shivaskankar, V.
(2017). A Prospective Observational Study on Poly-
pharmacy in Geriatrics at A Private Corporate Hos-
pital. Journal of Applied Pharmaceutical Science, 7
(10):162–167.
Subeesh, V. K., Shivaskankar, V., Gouri, N., Sriram, S.
(2015). A study on prevalence and impact of poten-
tially inappropriate medication use in geriatrics at a
private corporate hospital. Pharmanest, 6:2845–2848.
HEALTHINF 2019 - 12th International Conference on Health Informatics
358
