
A Hybrid Intelligent Agent for Notification of Users Distracted by Mobile
Phones in an Urban Environment
Thiago
ˆ
A. Gelaim
1
, Gabriel A. Langer
1
, Elder R. Santos
1
, Ricardo A. Silveira
1
, John O’Hare
2
,
Paul Kendrick
2
and Bruno M. Fazenda
2
1
Graduate Program in Computer Science (PPGCC), Department of Informatics and Statistics, Federal University of
Santa Catarina, Brazil
2
Acoustics Research Centre, University of Salford, Salford M5 4WT, U.K.
{elder.santos, ricardo.silveira}@ufsc.br, {j.ohare, p.kendrick, b.m.fazenda}@salford.ac.uk
Keywords:
Situational Awareness, Bayesian Networks, Predictive Model.
Abstract:
Mobile devices are now ubiquitous in daily life and the number of activities that can be performed using them
is continually growing. This implies increased attention being placed on the device and diverted away from
events taking place in the surrounding environment. The impact of using a smartphone on pedestrians in the
vicinity of urban traffic has been investigated in a multimodal, fully immersive, virtual reality environment.
Based on experimental data collected, an agent to improve the attention of users in such situations has been
developed. The proposed agent uses explicit, contextual data from experimental conditions to feed a statistical
learning model. The agent’s decision process is aimed at notifying users when they become unaware of critical
events in their surroundings.
1 INTRODUCTION
Doing activities such as payment of bills, organiza-
tion of the agenda and reading articles which used
to be performed in indoor environments can now be
done on smartphones outdoors as people move about.
As a consequence, users are now likely to pay more
attention to their devices than to the surrounding en-
vironment when navigating through busy urban areas.
This research aims to analyze the use of smart-
phones by pedestrians in urban environments. Our
work presents contributions in two aspects: (i) using
a CAVE environment, we analyze the impact of the
use of mobile devices on pedestrian situational atten-
tion; (ii) from this analysis, we developed an agent
with statistical reasoning to act in support of pedes-
trian decision making.
This paper is organized as follows: Section 2
presents relevant research context. Section 3 presents
the base experiment of Situational Awareness. Sec-
tion 4 presents the build of our decision support agent.
Section 5 presents conclusions and further work.
2 RESEARCH CONTEXT
Studies concerning mobile devices in urban envi-
ronments have considered both the pedestrian and
drivers’ perspectives. Considering the driver’s per-
spective, (Choudhary and Velaga, 2017) presents the
state-of-the-art on distraction effects considering re-
action time, caused by conversation and/or texting,
when using a mobile phone.
The work of Jiang et al. (Jiang et al., 2018),
presents the use of mobile devices in a crossing en-
vironment by pedestrians who are college students.
To achieve this, the experiment is performed in a
real-life, outdoor environment, while subjects are dis-
tracted by texting, listening to music and talking on
the phone. Data is collected from videos and an eye
tracker.
Lin and Huang (Lin and Huang, 2017) also evalu-
ate the use of smartphones in the roadside environ-
ment. The experiments are performed in a ‘semi-
virtual walking environment’. Distractions in the mo-
bile phone are texting, news-reading, or a picture-
dragging task. In the environment, the participants
had to respond with a designed hand gesture to road-
side events. The data was collected from eye tracker
and video.
Gelaim, T., Langer, G., Santos, E., Silveira, R., O’Hare, J., Kendrick, P. and Fazenda, B.
A Hybrid Intelligent Agent for Notification of Users Distracted by Mobile Phones in an Urban Environment.
DOI: 10.5220/0007397802750284
In Proceedings of the 11th International Conference on Agents and Artificial Intelligence (ICAART 2019), pages 275-284
ISBN: 978-989-758-350-6
Copyright
c
2019 by SCITEPRESS – Science and Technology Publications, Lda. All rights reserved
275
Modeling situational awareness of pedestrians can
also be viewed from the perspective of the car and
pedestrians. Neogi et al. (Neogi et al., 2017) and
Kooij et al.(Kooij et al., 2018) present an approach to
predict the intention of pedestrians crossing the street
based on contextual information.
It is clear, particularly from the works of Jiang et
al. and Lin and Huang, that mobile devices are be-
coming an increasing problem in urban environments
and solutions are needed. In the research presented
here, we are interested in distraction from the point
of view of a pedestrian, when engaged in the use of
a mobile device near traffic and how this might affect
their attention and situational awareness.
In our experiment, we have developed a scene in a
fully immersive virtual reality environment, where the
subject is required to perform a particular task, such
as crossing the road or move away from a moving
car. A virtual environment enables us to have more
control over experimental variables and also acquire
a larger amount of data. As a mobile phone distrac-
tion, we have used a game requiring constant atten-
tion. We propose a model of situational awareness of
the pedestrian based on the data obtained from their
interaction with the smartphone together with envi-
ronmental, contextual data. The model aims output is
then used to alert pedestrians and redirect their atten-
tion back to the roadside environment. To the best of
our knowledge, this is the first time such approach is
considered in this context.
3 SITUATIONAL AWARENESS
In this section, we present the study about the be-
haviour of pedestrians using smartphones in the urban
environment. This study and the data collected are the
foundation for the development of the agent presented
in section 4.
There are many theoretical perspectives to ap-
proach situational awareness. The Three Level Model
(Endsley, 1995) is composed of a chain of information
processing: perception, comprehension, and projec-
tion. The Perceptual Cycle Model (Smith and Han-
cock, 1995) consists of the interaction between the
agent and the environment. The Theory of Activity
(Bedny and Meister, 1999) uses the activities to trans-
form a current situation to the desired situation. In this
work, we followed the Three Level Model by Ends-
ley as the theoretical background for the design of our
experiment.
3.1 Experimental Design
The experiment was designed using Octave
1
, a fully
immersive, multimodal (audio and visual) CAVE en-
vironment. It enabled us to create a safe testing en-
vironment allowing control of experimental variables
and robust data collection.
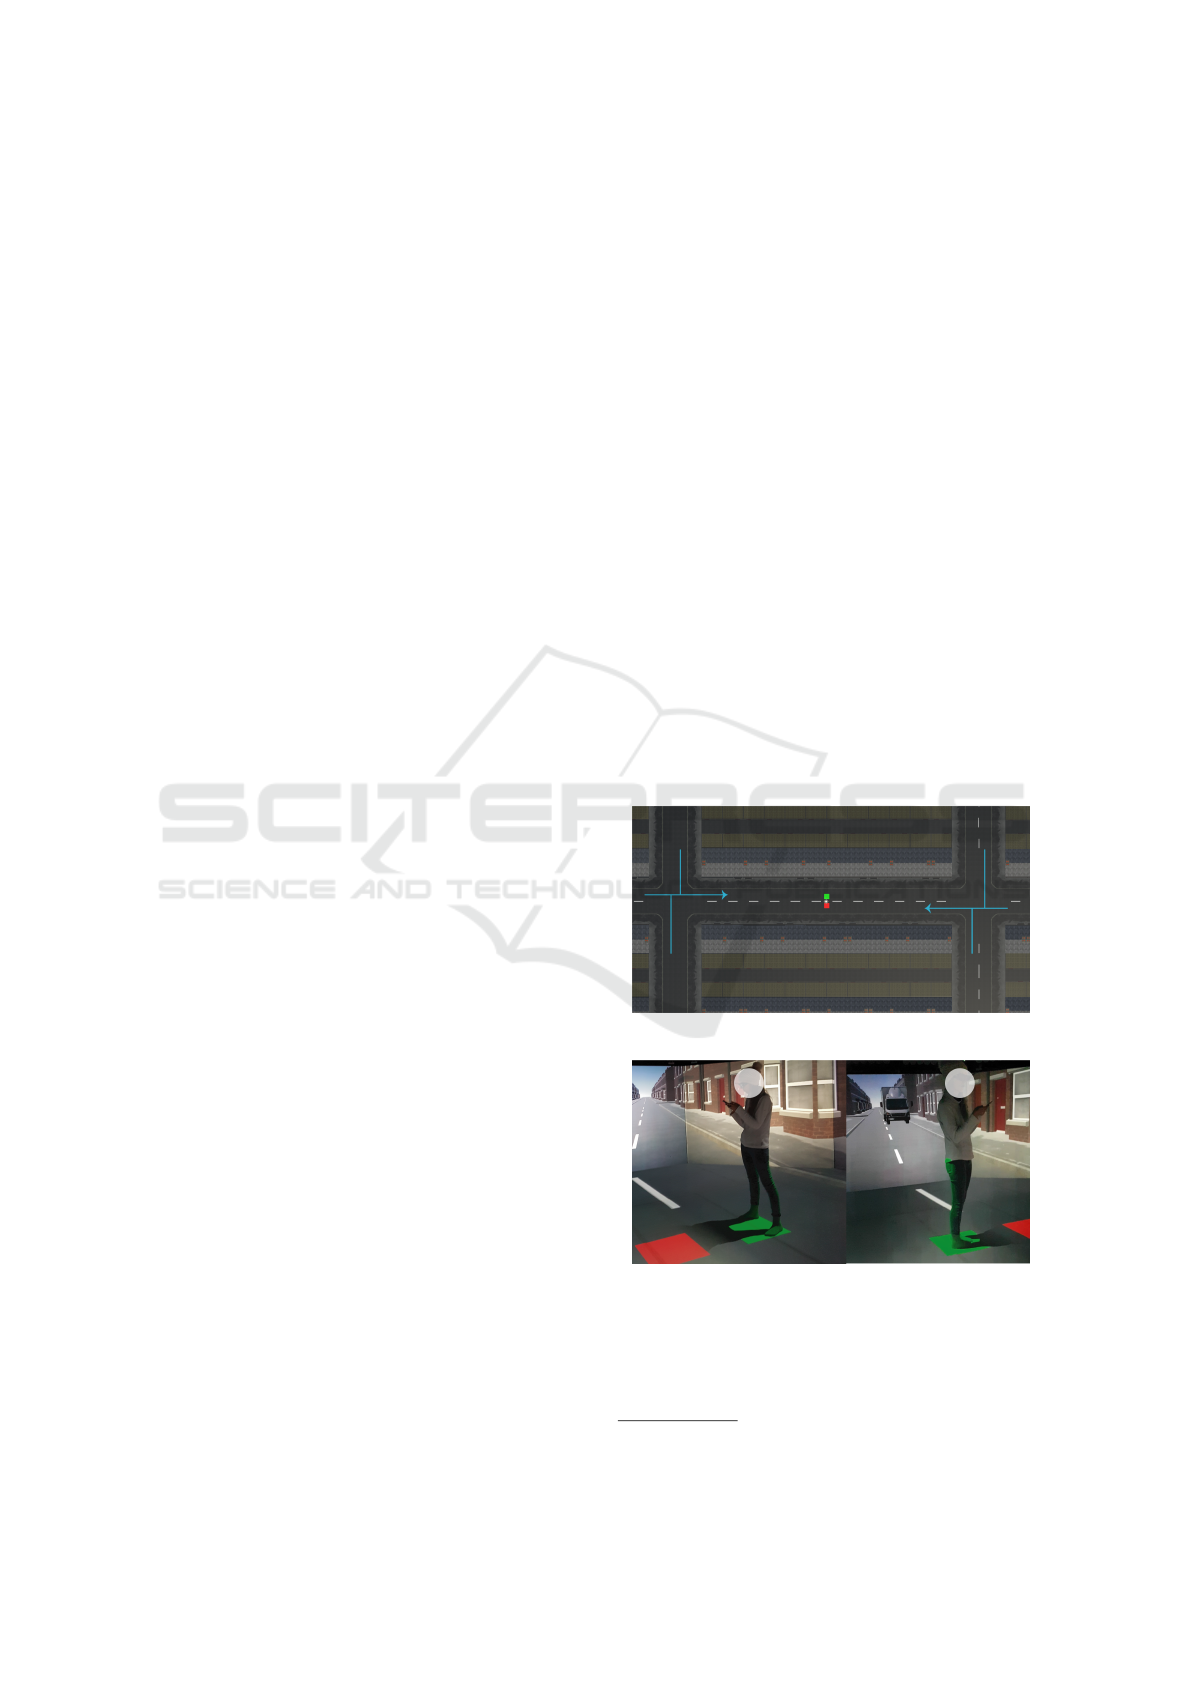
The goal of the experiment is to analyze the be-
havior of smartphone users in a scenario represent-
ing urban traffic. The testing environment consists of
two-way lanes in a residential area, where cars can
travel in any direction along these lanes. Figure 1
shows the urban scenario from above and the six pos-
sible travel directions for the cars. Participants have
been instructed to stay attentive to traffic whilst stand-
ing in one designated area and; to ‘move to the safe
lane’ if they need to avoid being hit by traveling ve-
hicles. Figure 2 shows a participant in the scenario.
The green square on the ground represents the lane of
the street in which the participant is considered safe,
and the red square is the lane that the participant be-
lieves that the car will be passing. The square colors
change according to the participant’s position. Dur-
ing the distracted conditions, the participant is addi-
tionally asked to interact with a smartphone game that
demands continuous attention.
Figure 1: Superior view of the environment.
Figure 2: A participant in the environment.
Every simulation was composed of twelve cars,
two cars for each of the six possible directions, one
with sound and one without. This is so we can test
car sound as a variable. Car instances are generated
1
https://www.salford.ac.uk/octave
ICAART 2019 - 11th International Conference on Agents and Artificial Intelligence
276

randomly from each possible direction with only one
instance possible at any one time.
Twenty participants took part, each performing
the ‘move to saftey task’ over three conditions with
the following interaction on the smartphone:
• A “CAR” button to indicate awareness of an in-
coming car; no other distractions present (type 1).
• A “CAR” button to indicate awareness of an in-
coming car and; a game that required constant in-
teraction (see Figure 3) (type 2).
• A button to indicate awareness of an incoming
car; a game that required constant interaction and;
wearing headphones with music playing (type 3).
Before the main experiment, participants could
practice in an identical scenario where five car in-
stances were generated. This allowed subjects to get
familiar with the test environment. The data collected
consists of videos, audios, object positions, actions,
and event elapsed time. The smartphone game used
as a distraction is a variation of a game called ‘Color
Switch’ and is presented in figure 3. This game con-
sists of a colored ball that has to be controlled to avoid
hitting an obstacle that has a different color. It is a
challenge that demands a high level of focus by the
user.
Figure 3: Game color switch, used for simulations 2 and 3.
3.1.1 Data Collection and Preprocessing
As only one car exists in the scenario at any one time,
we can analyze the events occurring between the ad-
dition and removal of each vehicle. Taking the car
information into consideration, the analyses use inde-
pendent events, without continuity, and users distinc-
tions. For each vehicle, the information obtained from
the environment are:
• Added: Execution time in which the car was
added;
• Removed: Experiment execution time in which
the car was removed;
• Sound: A binary variable that indicates if the car
produces sounds;
• Is Occluded: A binary variable that indicates if
the car comes from an occluded position from
the point of view of the participant (i.e.the side
streets);
• Critical AVG Speed: Average speed computed by
the car during the whole path, using the required
time to reach the participant, and the traveled dis-
tance;
• Direction: One of the six possible vehicle paths;
• Critical Time: Absolute execution time in which
the vehicle and user occupied the same position in
the scenario;
• Critical Time from Added: Variable added with
the main goal of obtaining the time of the interval
between the vehicle appearing in the scenario and
the moment that it occupies the same position of
the user in the scenario;
• Safe Lane: Lane in the street where the user is
safe;
• Simulation Type: Each of the three distraction
conditions tested;
• SoundOff: using only the game as a distraction
with no music on headphones;
• SoundOn: In addition to the distraction game, ac-
tivates the music played in the headphones;
• Moved to Current Lane: Time in which the user
crossed to the current position;
• Moved to Next Lane: Time in which the user
crossed to other position;
• Time for Aware: Required time for the user to
press the “CAR” button on the phone signaling
awareness of a vehicle; measured from the inser-
tion time of the car into the scenario. Figure 3
presents this feature;
• Run Over: Indicates if a user did not change lanes
in time and was run over by the car;
• User Movement: Sum of the total absolute dis-
placement of a user during an event;
• Head rotation: Sum of the total amount of rotation
a user’s head during an event;
• Is Aware: Indicates if user pushed the “CAR” but-
ton in time. This state shows that the user was
A Hybrid Intelligent Agent for Notification of Users Distracted by Mobile Phones in an Urban Environment
277

aware of the vehicle before it reached the critical
time (see above).
The information extracted from the app usage dur-
ing type 2 or 3 conditions are:
• Points: The total amount of points earned by the
user from playing the smartphone (distraction)
game;
• Max Obstacle: Maximum level reached by the
user during the period playing the smartphone
(distraction) game.
• Deaths: The number of times the user lost the
game;
4 DECISION SUPPORT AGENT
In this section, we present an agent for notification of
users distracted by mobile phones in an urban envi-
ronment. We use data collected from the experiment
presented in section 3 to develop a predictive model
using multiple statistical techniques. The decision of
(not) notifying the user is made by a voting system
from three approaches. The first approach uses a Tree
Augmented Naive Bayes to model the relationship be-
tween the variables and their influence to the risk. The
second approach uses categories to define user safety.
And the third uses continuous values to measure the
awareness level.
Gathering information about the pedestrian, such
as their behavior and perceptions, and contextual
knowledge about the environment, the danger is in-
ferred using previously obtained data. Based on the
output, the agent decides if the pedestrian should be
notified or not. In figure 4 we present a general
view of how our agent uses perceived information for
pedestrian decision making. The model uses artifi-
cial and statistical intelligence using different meth-
ods to find enough patterns to suggest an alert to the
user. The three models together work as a black box.
Therefore, the agent receives the sensor parameters
and indicates if it would be necessary to notify the
user.
To perform the analysis of this study satisfactorily,
it was necessary to create a scheme that would gather
important information distributed in metrics of events
that begin in the appearance of a vehicle in the sce-
nario and finalize in its withdrawal. In this way, the
purpose of the model uses independent events, with-
out continuity and without distinction between users.
By dividing the data set obtained through the experi-
ment in this way, we were able to obtain enough in-
formation to find patterns and classify if a pedestrian
is at risk.
Using the information extracted from the experi-
mental data, the objective is to make the model able
to obtain the configuration of factors that interfere in
the perception of the vehicles by pedestrians, apply-
ing methods of statistical learning. The strategy used
was to verify the correlation between the variables
and define approaches that lead to a dependent vari-
able that represents the level of situational awareness.
Once this variable is defined, the remaining work con-
sists of evaluating how information available in ur-
ban environments can aid in decision making, help-
ing to reduce the number of pedestrian accidents on
urban roads. Some variables were selected on the
pedestrian, such as their level of immersion in the app
(number of games played and obstacles), variation of
head rotation and movement in the environment as in-
dependent variables (features) of the model. Vehicle
data were also used, such as average speed, direction
and presence of sound. As a dependent variable (re-
sponse), variables of ‘Is Aware’ and ‘Run Over’ were
combined to classify the decision to notify the pedes-
trian about a possible risk of a potential accident.
4.1 Bayesian Model
The Bayesian methods are used to reason about par-
tial beliefs under the presence of uncertainty (Pearl,
1988)[pag.29]. The Bayes theorem, equation 1, states
that the probability of a hypothesis h conditioned by
some evidence e equals its probability P(e|h) multi-
plied by a priory probability for any evidence P(h)
divided by the probability of evidence P(e) (Korb and
Nicholson, 2010).
P(h|e) =
P(e|h)P(h)
P(e)
(1)
The first component of our statistical model is a
Bayesian network. It is a graphical model with nodes
and arcs. A node represents a variable, for example,
the car direction. An arc represents a direct depen-
dence between two nodes, for example, the causal
connection between nodes ‘car direction’ and ‘aware-
ness’.
In this approach, we treat the user awareness of
a car as a supervised classification problem, using
the collected data from the experiment presented in
section 3. The model is built upon Tree Augmented
Naive Bayes (TAN) (Friedman et al., 1997), in which
the nodes are aware, direction, sound, simulation
type, is occluded, run over, and max obstacle. This
algorithm is implemented on Netica and is used to
classify the ‘aware’ node based on the other nodes.
Figure 5 shows the correlation between the variable
ICAART 2019 - 11th International Conference on Agents and Artificial Intelligence
278
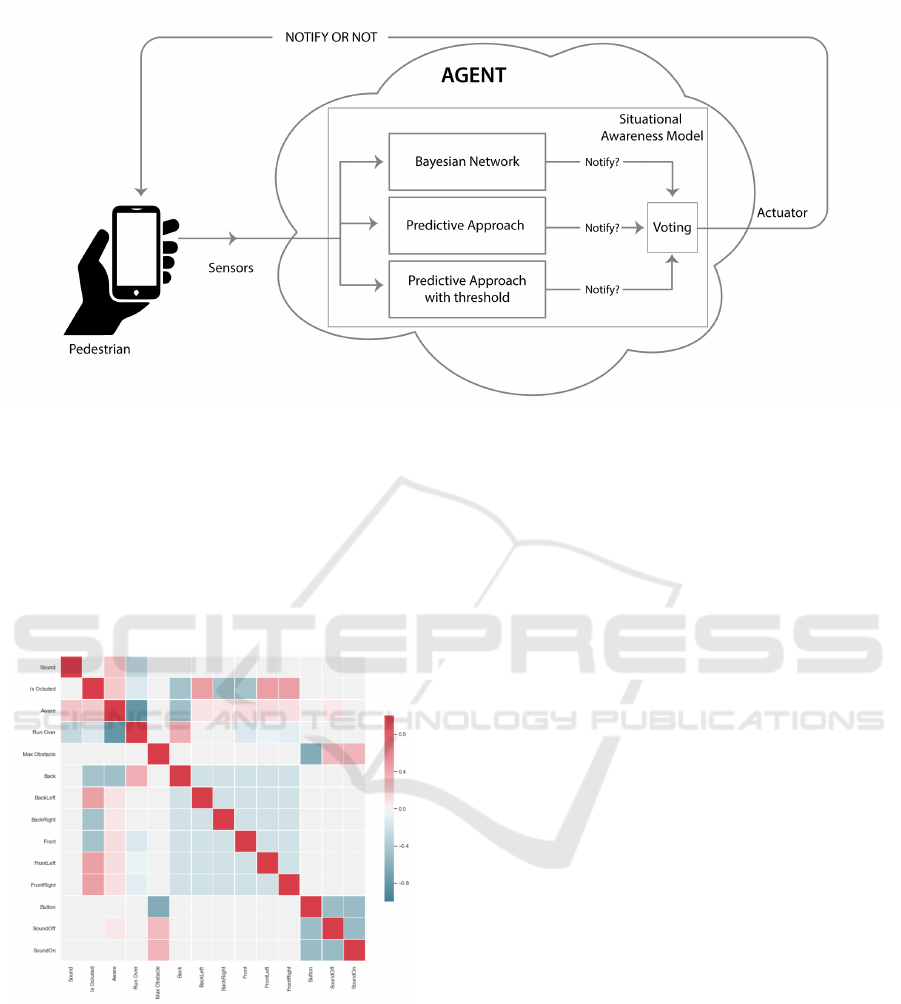
Figure 4: Decision Making on pedestrian notifications.
used during the developing of the Bayesian network
and the network is presented in figure 6.
To estimate the probability of the user being aware
of the car, this network uses the data collected by the
agent’s sensors. When the node variable ‘true’ in the
node ‘aware’ is less than 60% the Bayesian compo-
nent sends to the voting component that the user must
be notified.
Figure 5: Correlation between variables - Bayesian net-
work.
To exemplify the working of the Bayesian net-
work, the following scenario consists of the following
situation:
The agent perceives that the user is listening to
music on the smartphone and thus the interaction level
with a smartphone is 4 on a scale of 0 to 8. In the en-
vironment, there’s a car approaching and, as the mu-
sic is playing, it is unlikely the user will hear the car
sound. Figure 7 states that there’s a 48,4% chance of
the user not being aware of the car. According to our
proposal, this kind of situation requires an attention
notification be sent to the user.
4.2 Predictive Model
As the intention is to obtain the representation of risky
situations, some information from all extracted exper-
imental data is selected to be used as parameter to
create a new metric called awareness, which serves
as a reference to evaluate the correlations and pro-
vide a computational model appropriate to the project
objectives, to be used in the future. Based on the
concept that an application derived from this model
can use the information provided in real time to de-
tect risk situations and alert the pedestrian, the level
of situational awareness can be represented through
pre-defined levels, where behavioral patterns suggest
the possible warnings to the user. Another form of
representation is to create a quantitative and contin-
uous level of the situational awareness level, which
assesses whether the user is fully aware of the risks
of their surroundings, where 0 (zero) represents the
minimum possible attention, and 1 (one) represents a
completely watchful pedestrian.
As it was designed, the experiment provides
enough information to evaluate the pedestrian’s per-
ception of the components from the scenario and to
use the time it took to identify the presence of a ve-
hicle coming towardS them, to avoid a possible acci-
dent. This information comes from the variables ob-
tained in the pre-processing.
A Hybrid Intelligent Agent for Notification of Users Distracted by Mobile Phones in an Urban Environment
279
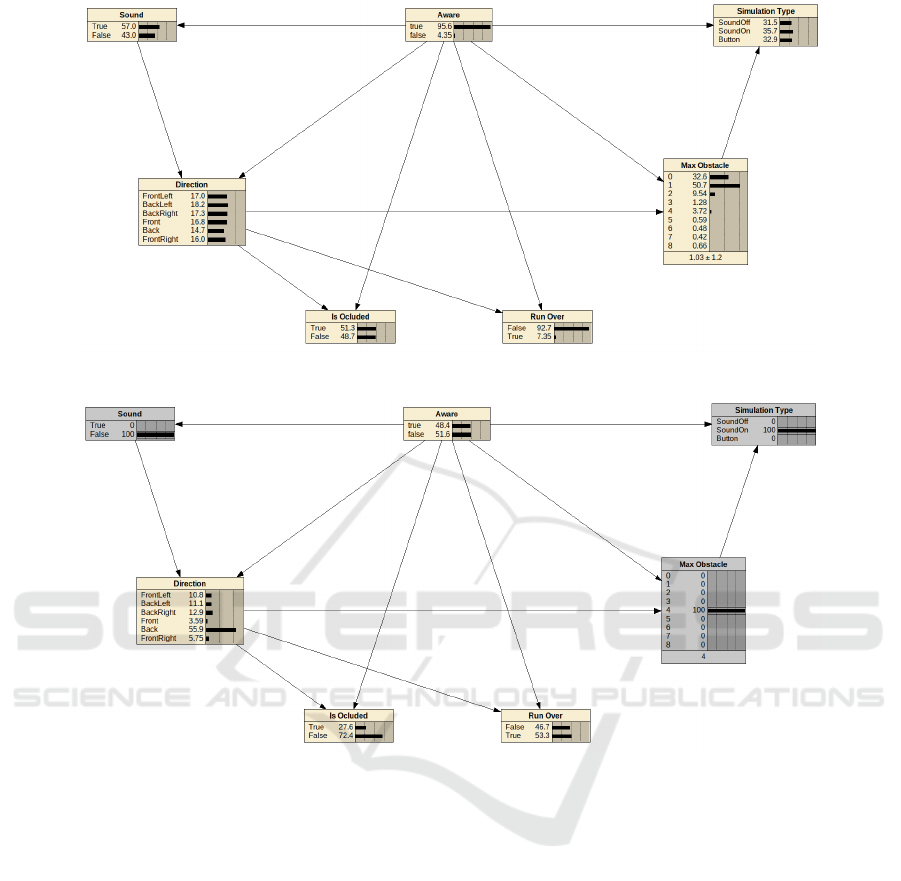
Figure 6: Bayesian network built with Netica.
Figure 7: Bayesian network example. In gray agent’s beliefs from the environment.
4.2.1 Assignment of Situational Awareness
Categories
Through the data chosen to define a dependent vari-
able for constructing the situational awareness com-
putational model, the first strategy is to create cate-
gories that demonstrate the level of pedestrian safety
based on information about their perception. Because
the ‘Is Aware’ and ‘Run Over’ variables can provide
an answer to the pedestrian risks, they have been se-
lected to compose the classes. Both variables are bi-
nary, culminating in four different combinations to
classify each sample of the experiment, giving greater
importance to the variable that represents the ‘run
over’ occurrences, based on the premise that the user
will prioritize avoiding an accident by moving lane, to
pressing the “CAR” button to state that they are aware
of the car. In this way the classes were defined as:
• danger: Category where the situation of the exper-
iment tends to a circumstance where the user does
not notice the car, nor does it avoid being run over;
• inattentive: Category where the user notices the
car through the application but does not avoid be-
ing run over;
• at risk: Category where the user does not indicate
the perception of the car but is not run over;
• safe: Category where the user notices the car and
is not run over.
The quantitative distribution of events based on
their classifications was given according to Figure 8,
where the vast majority of users were in the safe state.
Of the total of 732 data available, 53 were in danger,
12 were inattentive user situations, 88 were at risk and
the other 579 were classified as safe situations. The
data is unbalanced with ‘safe’ representing an over-
whelmingly majority of the cases which affects our
machine learning analysis.
ICAART 2019 - 11th International Conference on Agents and Artificial Intelligence
280
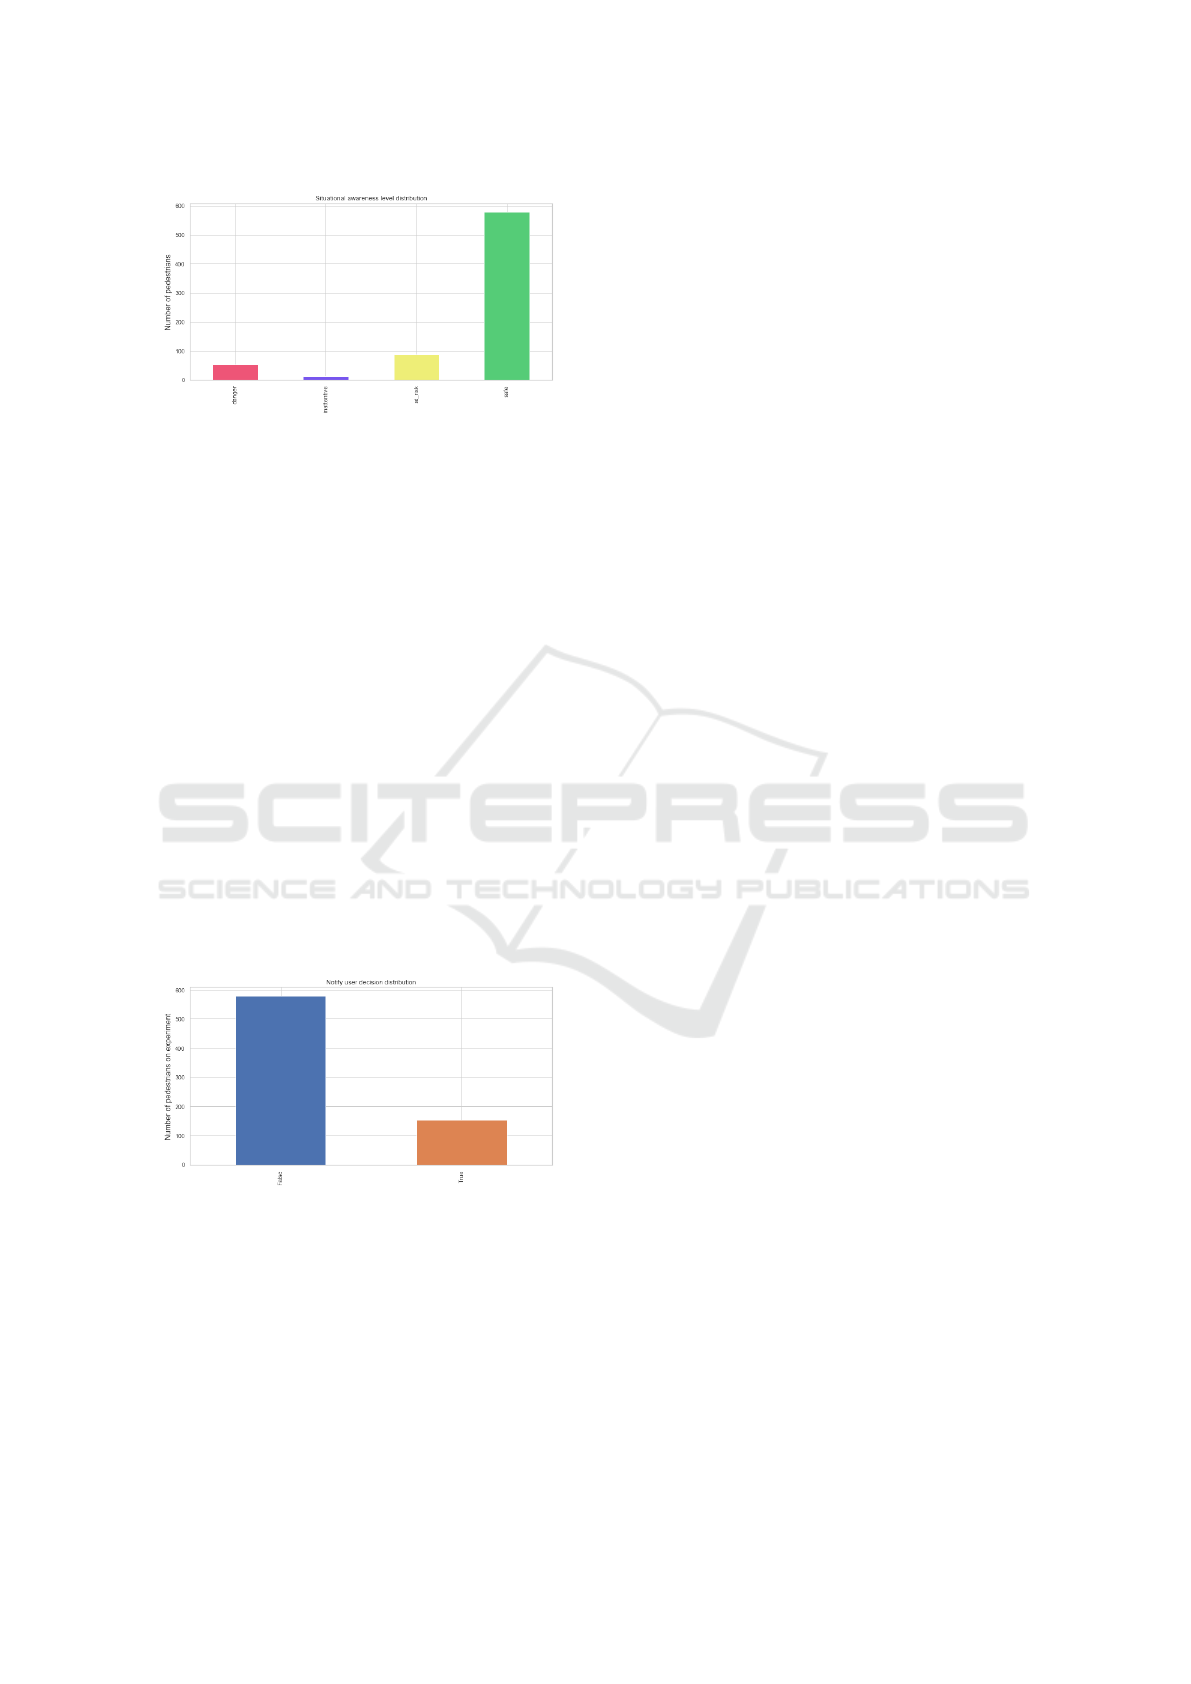
Figure 8: Distribution of pedestrian by situational aware-
ness categories.
Using the data resulting from category creation,
statistical learning techniques that work as classifiers
can be used to create a model that represents each
class according to the independent variables that are
of the highest importance. This provides precision to
enable possible notifications to aid in pedestrian deci-
sion making when the final model resulting from that
work is implemented.
However, since the final objective of the project is
to define whether the pedestrian and the driver should
be warned about the risk of an accident, it is inter-
esting that the classification is given in a binary way.
Therefore, we can train the model based on whether
a notification should be issued if the user’s class is
not safe, leading to a new boolean derived variable,
named ‘notify user’. The distribution of pedestrians
in each notification class is contained in Figure 9. In
this way, the mentioned method can be used to cre-
ate the final model. This approach does not take into
account the time required for ‘car’ perception by the
user.
Figure 9: Distribution of pedestrians by notify user deci-
sion.
4.2.2 Assignment of Situational Awareness
Continuous Level
The analysis performed through the first approach
provides modeling of the problem using discrete de-
pendent variables on the negative or positive result
of each vehicle event in the experiment. As the four
classes were used to understand the behavior and sep-
aration between a situation where a notification with
danger alert would be necessary to the user or not, the
model tends to be more restricted but this does not
mean worse performance. The second approach uses
the information regarding the user’s safety time, i.e.,
did the user notice the car with enough time to avoid
a dangerous situation?
Based on the variables generated in the data pre-
processing step, the ‘Time for Aware’ variable (which
indicates the time required for vehicle perception
since its inception in the scenario) together with the
‘Run Over’ information (which indicates a crash sit-
uation) can be used together to demonstrate a quanti-
tative level of situational awareness of pedestrians in
each situation.
Since ‘Time for Aware’ is a variable with contin-
uous values and ‘Run Over’ is a binary variable, a
formula must be used taking into account a weight
for each metric. Assuming that the time for a pedes-
trian to perceive the vehicle is inversely proportional
to their level of attention, we can use this information
to create a formula of the level of situational aware-
ness of the user and using as a multiplicative factor of
weight n as the data that the user was not run over in
the experiment, as demonstrated in equation 2.
awareness =
(maxT FA − userT FA)∗
(n − runOver ∗n + runOver) (2)
Where:
• awareness: final situational awareness level of
each user;
• maxTFA: maximum time users took to perceive
the car (constant);
• userTFA: time current user took to perceive the
car;
• n: security multiplicative factor;
• runOver: a binary value, where 1 indicates that
the user was run over in the experiment;
Then, for each event in the data set, the formula is
applied and its values are normalized, as are all inde-
pendent quantitative variables that can be used later
in the statistical learning model. The value used for
the multiplicative factor n was 2, which represents a
doubling in the assignment of the level of situational
awareness of the pedestrian case to avoid being run
over. The distribution of the normalized level of the
awareness variable occurred according to Figure 10.
4.2.3 Exploratory Data Analysis (EDA)
In this section, we provide some analysis based on
variables extracted from the experiment in different
A Hybrid Intelligent Agent for Notification of Users Distracted by Mobile Phones in an Urban Environment
281
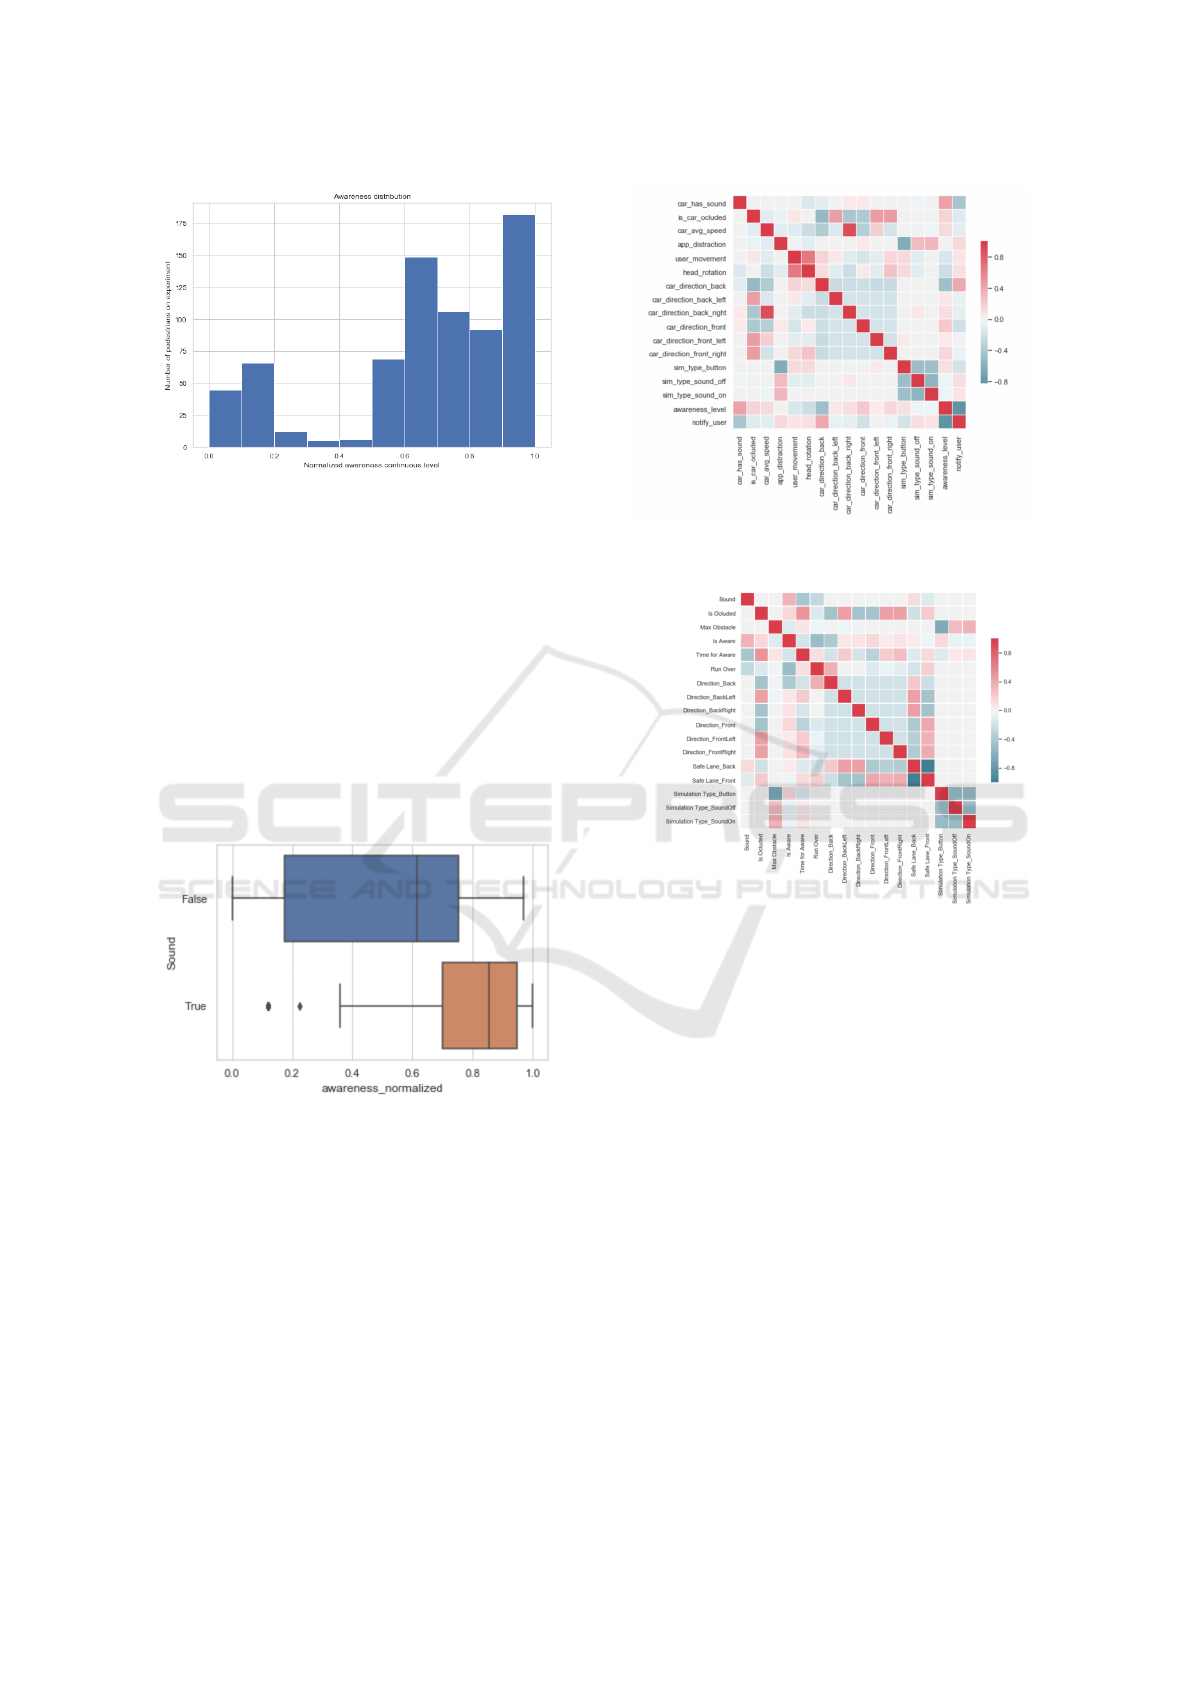
Figure 10: Pedestrian distribution by situational awareness
continuous level.
approaches. For example, using continuous data for
the dependent variable awareness obtained in the con-
tinuous approach, we can analyze how much it is in-
fluenced by the presence of sound in the car through a
Box Plot type graph, as shown in Figure 11. The influ-
ence of sound on the level of situational awareness of
a pedestrian is clear, the orange box indicates the ve-
hicles that produce sounds, and the median is close to
90% of the maximum level measured, besides having
the lower and upper quartiles near this value. Analyz-
ing the blue box, we can observe that the number of
pedestrians with a lower level of situational awareness
for cars without sound is larger.
Figure 11: Box Plot of info that car has sound and measured
awareness.
A larger view of the correlation between all vari-
ables is shown in Figure 12 (SA categories approach)
and Figure 13 (SA continuous level approach), where
the gradient in red color indicates a positive corre-
lation and the gradient in blue indicates a negative
correaltion. The data such as ‘direction’, ‘safe lane’,
and ‘simulation type’ were transformed into multiple
columns as these are categorical variables. One can
not simply enumerate the values from these categories
because they do not have an order of magnitude that
sorts them.
Figure 12: Correlation between variables (categories ap-
proach).
Figure 13: Correlation between variables (continous level
approach).
4.2.4 Applying Statistical Learning Techniques
Following the guidelines found in the theoretical ba-
sis, some learning methods were chosen according to
the characteristics found in the data extracted from the
experiment, covering techniques such as linear and
neighborhood, as well as ensemble learning methods,
which can improve prediction efficiency. The meth-
ods chosen for classification were:
• Logistic Regression;
• K Nearest Neighbors (KNN);
• Support Vector Machines (SVM);
• Decision Trees;
• Adaptive Boosting (AdaBoost);
• Bagging;
• Gradient Boosting;
• Random Forest.
ICAART 2019 - 11th International Conference on Agents and Artificial Intelligence
282

For each method used, the cross-validation
method was used (using Stratified K Folds, where
each fold contains the same number of samples repre-
senting the classes), together with a selection of vari-
ables for more accurate classification. Then, accuracy
metrics, confusion matrix for false negative and pos-
itive numbers were extracted, besides the ROC and
precision-recall curves for verification of the integrity
and reliability of the algorithms.
The best-performing techniques were those of en-
semble learning, especially Bagging and Random
Forest, which was more accurate and returned lower
false negative rate than others, which is a very impor-
tant metric since the absence of a notification can be
disastrous to the pedestrian.
4.3 How These Models Influence
Pedestrian Decision Making
Let the sensors inputs be: A = {car has sound =
true, is car ocluded = true, car avg speed = 0.227491,
app distraction = 0, user movement = 0.397433,
head rotation = 0.225124, car direction = back left,
sim type = button}. B = {car has sound = false,
is car ocluded = false, car avg speed = 0.0564026,
app distraction = 0.272997, user movement = 0.2551,
head rotation = 0.2004, car direction = front,
sim type = sound on}. C = {car has sound
= false, is car ocluded = false, car avg speed =
0.0564026, app distraction = 0.3038, user movement
= 0.4137, head rotation = 0.5741, car direction =
back, sim type = sound on}. D = {car has sound
= false, is car ocluded = false, car avg speed =
0.825519, app distraction = 0.35905, user movement
= 0.177664, head rotation = 0.107857, car direction
= back right, sim type = sound on}. In table 1 we
present a set of behavior of our agent according to
these inputs.
The Bayesian network will send a message to no-
tify only in case C, because the variable ‘true’ in the
aware node is smaller than our Bayesian threshold of
60%. The categorical predictive model uses the Bag-
ging Classifier technique, which provides an aggrega-
tion of decision trees with random samples from the
training dataset in a setting that notifies the pedestrian
only in case C and D. The predictive model with a
threshold of 50% uses the Random Forests Classifier
technique, in a way that fewer predictors are applied
to each split in the aggregation of decision trees, pro-
viding reduced variance. Predicted the notification re-
quirement on B and C inputs.
5 CONCLUSION
The use of mobile devices by pedestrians and drivers
can increase the incidence of traffic accidents. In this
research, we investigate the use of mobile devices by
pedestrians and propose an agent to act as a notifica-
tion system for critical distraction levels. The aims
of this research were twofold: 1) to develop an un-
derstanding of the impact of mobile device usage on
pedestrians’ situational awareness and; 2) to develop
an agent that can predict the level of awareness of
a pedestrian who is using a mobile device in critical
zones such as near roads.
Using a Cave Automatic Virtual Environment
(CAVE), an urban environment has been designed and
calibrated to simulate the interaction between a pedes-
trian user of smartphone and moving traffic. Based on
the data collected three models were developed and
with its outputs, a voting system defines if the user
must be notified. We have demonstrated that an agent
can effectively be built to warn a pedestrian user of
potential threats in the environment. At this stage,
our model requires explicit information from the en-
vironment that can be obtained through the vehicle to
device communication systems or other means.
In the Bayesian model, it is easier to add a new
behavior through nodes and CPT. On both predictive
models, the use of statistical learning methods gives a
whole set of different tools to enable finding data pat-
terns that indicate threatening situations. Despite the
satisfactory results, a larger and more balanced quan-
tity of samples is likely to have a positive influence
on the knowledge discovery for pedestrian situational
awareness.
5.1 Future work
Our results with the Bayesian network must be im-
proved. An approach we may try is to extend it
as a Dynamic Bayesian Network (DBN). This ap-
proach already exists for the driver’s view of pedestri-
ans (Kooij et al., 2018). We also are planning to add
online learning to fit the participant profile. Another
interesting project is to develop a smartphone applica-
tion with this agent. At this time we only define that
the user should be notified, not specifying such noti-
fication. Depending on the level of attention, or lack
thereof, the agent may have a set of actions. For ex-
ample, if the user’s attention is very low, and the user
is listening to music, a beep may be applied. Other
possible actions may be to interrupt texting, showing
a warning message or blocking the display altogether.
In a future iteration, the system can further deploy
on-device sensors such as camera and microphone to
A Hybrid Intelligent Agent for Notification of Users Distracted by Mobile Phones in an Urban Environment
283

Table 1: Awareness model output.
Input Bayesian Network Predictive Model Predictive Model with Threshold Output
A Not Notity (100%) Not Notify (level 3) Not Notify (0.7876) Not Notify
B Not Notify (99%) Not Notify (level 3) Notify (0.4887) Not Notify
C Notify (37.7%) Notify (level 0) Notify (0.0707) Notify
D Not Notify (96.2%) Notify (level 2) Not Notify (0.708979) Not Notify
detect the threats. Also, with the evolution of technol-
ogy, involving concepts such as Big Data and Smart
Cities, cities tend to provide more and more informa-
tion urban environment, making it possible to advance
the potential of the model in representing the events of
the context that relate to the level of situational aware-
ness of pedestrians. In addition, if obtaining more
distraction data through smartphones is possible, the
model can become progressively more accurate to the
decision-making process, as it will more satisfactorily
the concentration level of the user.
ACKNOWLEDGEMENTS
The authors acknowledge support of the Royal So-
ciety International Exchange Award Nr. IE150542.
This study was financed in part by the Coordenac¸
˜
ao
de Aperfeic¸oamento de Pessoal de N
´
ıvel Superior -
Brasil (CAPES) - Finance Code 001.
REFERENCES
Bedny, G. and Meister, D. (1999). Theory of activity and
situation awareness. International Journal of cogni-
tive ergonomics, 3(1):63–72.
Choudhary, P. and Velaga, N. R. (2017). Modelling driver
distraction effects due to mobile phone use on reac-
tion time. Transportation Research Part C: Emerging
Technologies, 77:351–365.
Endsley, M. R. (1995). Toward a theory of situation aware-
ness in dynamic systems. Human Factors: The Jour-
nal of the Human Factors and Ergonomics Society,
37(1):32–64.
Friedman, N., Geiger, D., and Goldszmidt, M. (1997).
Bayesian network classifiers. Machine learning, 29(2-
3):131–163.
Jiang, K., Ling, F., Feng, Z., Ma, C., Kumfer, W., Shao,
C., and Wang, K. (2018). Effects of mobile phone
distraction on pedestrians’ crossing behavior and vi-
sual attention allocation at a signalized intersection:
An outdoor experimental study. Accident Analysis &
Prevention, 115:170–177.
Kooij, J. F., Flohr, F., Pool, E. A., and Gavrila, D. M. (2018).
Context-based path prediction for targets with switch-
ing dynamics. International Journal of Computer Vi-
sion, pages 1–24.
Korb, K. B. and Nicholson, A. E. (2010). Bayesian artificial
intelligence. CRC press.
Lin, M.-I. B. and Huang, Y.-P. (2017). The impact of walk-
ing while using a smartphone on pedestrians’ aware-
ness of roadside events. Accident Analysis & Preven-
tion, 101:87–96.
Neogi, S., Hoy, M., Chaoqun, W., and Dauwels, J. (2017).
Context based pedestrian intention prediction using
factored latent dynamic conditional random fields. In
Computational Intelligence (SSCI), 2017 IEEE Sym-
posium Series on, pages 1–8. IEEE.
Pearl, J. (1988). Probabilistic reasoning in intelligent sys-
tems: networks of plausible inference. Morgan Kauf-
mann.
Smith, K. and Hancock, P. A. (1995). Situation awareness
is adaptive, externally directed consciousness. Human
Factors: The Journal of the Human Factors and Er-
gonomics Society, 37(1):137–148.
ICAART 2019 - 11th International Conference on Agents and Artificial Intelligence
284
