
An Experimental Investigation Comparing Age-Specific and Mixed-Age
Models for Wearable Assisted Activity Recognition in Women
Pratool Bharti
1
, Arup Kanti Dey
1
, Sriram Chellappan
1
and Theresa Beckie
2
1
Dept. of Computer Science and Engineering, University of South Florida, Tampa, FL, U.S.A.
2
College of Nursing, University of South Florida, Tampa, FL, U.S.A.
Keywords:
Wearable Computing, Activity Recognition, Health Informatics, Machine Learning, Algorithms, Aging.
Abstract:
In this paper, we investigate the impact of age diversity on accuracy for activity recognition among women
with wrist-worn wearables. Using a sample of 10 elder women and 10 younger women, and by monitoring
five activities related to cardiac care (Running, Brisk Walking, Walking, Standing and Sitting), we show
that while personalized models are best, activities classification based on age specific models are definitely
superior in terms of accuracy compared to classification using mixed age models. We do so by a) extracting 11
features from inertial sensing data; b) reducing dimensionality using Linear Discriminant Analysis methods;
c) quantifying variance among features using Principal Component Analysis; d) clustering activities; and
finally e) comparing classification accuracies of all activities for personalized, age-specific and mixed-age
models. We believe that our study is unique, and potentially important for superior healthcare for women, a
demographic that is largely underserved today across the world.
1 INTRODUCTION
Consistent physical activity is important for human
health across all ages. To cater to this need, billions
of dollars and significant human resources have been
invested by industry and academia to advance the
field of wearable assisted activity recognition. Chief
among these are wrist-worn wearables like the FitBit
band, Apple Watch, Samsung Gear etc., that are very
popular today. The global demand of wearable tech-
nologies is estimated to be around 200 million devices
in 2021 (Beaver, 2016).
1.1 State of the Art in Wearable Tech
w.r.t. Elders and Identified Gap
As of today, the wearable tech market is dominated
by sensory devices worn on the wrist for recogniz-
ing basic physical activities like walking, running, sit-
ting, standing and sleeping. These wearables typ-
ically come with pre-trained models, but do suffer
from accuracy problems to a certain degree. This
lack of accuracy is unavoidable, since each person
performs the same activity a little differently, and it
is virtually impossible for an algorithm in a wearable
to correctly identify all possible modes of diversity
across all humans. However, when it comes to el-
ders, both patients and physicians have very high ac-
curacy expectations, since physical activities are ex-
tremely important, but can simultaneously be strenu-
ous for elders, and so there is an expectation that every
“step” be counted, and counted correctly. However,
despite studies showing that aging causes diversities
in the way humans perform and perceive physical ac-
tivities (Borg, 1998), (Bar-Or, 1977), (Levy and My-
ers, 2004) there is no careful study yet on impact of
age diversities on accuracy in wearable assisted activ-
ity recognition.
1.2 Our Contributions
In this paper, we investigate the importance of con-
sidering age diversities in wearable assisted activity
classification for women, and identify critical obser-
vations. Each physical activity we investigate in this
paper is vital for health, and specifically cardiac care.
We specifically focus on women subjects in this paper
since they are an underserved population in cardiac
care (Valencia et al., 2011), (Benz Scott et al., 2002),
and we can retain problem scope.
Our specific contributions are as follows. We con-
duct an experiment with 20 women subjects, where
10 subjects were younger in the age group of 21−26,
Bharti, P., Dey, A., Chellappan, S. and Beckie, T.
An Experimental Investigation Comparing Age-Specific and Mixed-Age Models for Wearable Assisted Activity Recognition in Women.
DOI: 10.5220/0007398003670374
In Proceedings of the 12th International Joint Conference on Biomedical Engineering Systems and Technologies (BIOSTEC 2019), pages 367-374
ISBN: 978-989-758-353-7
Copyright
c
2019 by SCITEPRESS – Science and Technology Publications, Lda. All rights reserved
367

and the other 10 subjects were older in the age group
of 65 − 75. Each subject was asked to wear a wrist
wearable, and they performed a series of five activi-
ties: Brisk Walking, Running, Sitting, Standing and
Walking. During this time, the accelerometer and gy-
roscope readings were collected from the wearable
device and later exported to high end server for fur-
ther processing.
Subsequently, a) we extract 11 contextually rele-
vant features each from the three axes of accelerom-
eter and gyroscope sensory data, and analyze them
extensively; b) perform dimensionality reduction us-
ing Principal Component Analysis; c) perform clus-
ter analysis via Linear Discriminant Analysis; and d)
implement several machine learning algorithms for
classification. We make several interesting findings.
We find that among principal components, only very
few components contain large portions of variance in
datasets for the younger cohort, compared to the elder
cohort. The conclusion here is higher similarities in
activities when performed by younger women, com-
pared to elder women. The distribution of variances
in the mixed-age cohort was the worst, hence making
a case for age-specific models. After clustering, we
find that the activity clusters on the younger cohort
are highly separable with minimal overlap, while the
elder only cohort had more than reasonable overlaps
among activities classified, and the mixed-age model
again performed the worst with significant confusion.
Finally, we find that classification accuracies for the
age-specific models outperform mixed-age models by
an average of 20%. Models personalized for each in-
dividual are much more accurate.
To the best of our knowledge, our study is the first
to comprehensively investigate impact of age dispar-
ities on accuracies in terms of wearable assisted ac-
tivities classification, and present a formal need for
age-specific, or even better, personalized models. The
exclusive focus on women is a further salience of our
contributions.
2 RELATED WORK
In this section, we elaborate on important related
work in two broad topics: technology assisted activ-
ity recognition in general, and works that specifically
consider impact of diversities on wearable assisted
physical activities recognition.
2.1 Physical Activity Recognition using
Computing Technologies
Human Activity Recognition is a very well studied
topic, with some good surveys in (Avci et al., 2010),
(S
´
anchez et al., 2008). There are broadly three classes
of work in this realm. The first one is to use sen-
sors emplaced in the ambient infrastructure for ac-
tivity recognition. Typically, the sensors are video
cameras, WiFi receivers, PIR sensors, etc. Such sys-
tems have been used to detect activities like walking,
sitting, standing, running in (Bao and Intille, 2004),
gait study in (Lee and Grimson, 2002), activities per-
formed by healthcare professionals in clinical settings
in (S
´
anchez et al., 2008) and more. The second class
of work detects activities using only wearables em-
placed in different body positions like wrists, fingers,
neck, feet and more. Among these, there are works
like (Bharti et al., 2018a) that recognizes basic ac-
tivities like walking, sitting, standing, running etc.,
and complex ones like cooking, cleaning etc. There
are also works that detect more fine grained activi-
ties like self-harming activities (Bharti et al., 2018b);
walking upstairs, walking downstairs, taking elevator
up/ down, lying down (Jiang and Yin, 2015); lie-to-
sit, stand-to-lie, lie-to-stand, cycling, ironing clothes
etc. (Reyes-Ortiz et al., 2016). Finally, there are
works that use a combination of wearable sensors
and infrastructure sensors for recognizing activities
like cooking, cleaning utensils and many more (De
et al., 2015). From reading extensive related work in
this space, we observed that the elder demographic is
largely under-represented in existing studies today in
wearable assisted activity recognition, as summarized
in Table 1.
2.2 Impact of Diversities in Wearable
Assisted Activity Recognition
We find that most works that look at wearable assisted
activity recognition for elder subjects are specific for
Fall Detection only (de la Concepci
´
on et al., 2017),
(Kaur and Kaur, 2017), (Wang et al., 2017). From the
perspective of detecting basic physical activities using
wearables, there are very limited works that consider
elder subjects. For instance, one very recent work in
(Alinia et al., 2017), evaluate three different types of
Fitbit activity trackers and concluded that these de-
vices are accurate when subject walks/ runs on tread-
mill, but the accuracy goes down when the subject is
walking with an assisted device, or walks very slowly,
which are representative with elders.
In fact, we are aware of only one work
(Del Rosario et al., 2014), where there was an at-
HEALTHINF 2019 - 12th International Conference on Health Informatics
368

Table 1: Related work in space of human activity recognition using wearables.
Publications Sensors Age group (in years.)
(de la Concepci
´
on et al., 2017) 3-axis Accelerometer 19-48
(Jiang and Yin, 2015) 3-axis Accelerometer and Gyroscope 19-49
(Bharti et al., 2018a)
3-axis Accelerometer, 3-axis Gyroscope,
Barometer pressure sensor, Temperature,
Humidity, iBeacon, GPS 20-25
(Bharti et al., 2018b) 3-axis Accelerometer, 3-axis Gyroscope 25-30
(Reyes-Ortiz et al., 2016) 3-axis Accelerometer, 3-axis Gyroscope 19-48
(Alinia et al., 2017) FitBit wearables 21-31
(Wang et al., 2017) Wi-Fi signal NA
tempt to study the efficacy of an age-specific model
and a mixed-age model for activity recognition using
smartphone sensors. The authors showed that accu-
racy is significantly higher when a model is trained
and tested on age-specific datasets, compared to a
mixed-age datasets. Our work in this paper is related
to (Del Rosario et al., 2014), but there are compelling
differences. In our paper here, we employ a wrist-
worn device, which is more realistic and practical,
when compared to smart-phones for activity recogni-
tion. Secondly, the work in (Del Rosario et al., 2014)
does not look at statistical properties of features ex-
tracted (which will give more context to the results),
and does not not consider activities like brisk walking
and running, which we do in our paper, hence making
our contributions significant and relevant.
3 EXPERIMENTAL SETTING
We now present our experimental set-up. We col-
lected a dataset for five ADL (Activities of Daily Liv-
ing) activities, namely Brisk Walking, Walking, Run-
ning, Standing and Sitting. Each one of these activ-
ities is vital for health across ages, and more so for
cardiac care. Ten younger (age range: 21-26) and ten
elder female participants (age range: 65-75) took part
in our experiments. All the younger subjects did all
of the activities, as did four elder subjects. Six el-
der subjects (in the higher age group) did not run (for
obvious reasons), but did all the four other activities.
Each activity was performed for 4 minutes by every
individual. Thus, around 20 minutes of data were
collected from each participant. A wearable device
called Shimmer (Burns et al., 2010) equipped with
tri-axial accelerometer and tri-axial gyroscope sensor
was worn by each subject on their right wrist. Data
was sampled from the accelerometer and gyroscope
sensor at a frequency of 50Hz (samples per second).
Data from both sensors were directly streamed and
stored to server for processing and analysis.
Note that the Shimmer device is widely used
in research today for its miniature size and power-
ful sensing/ computing/ wireless transmission abili-
ties. The central element of the platform is the low-
power MSP430F5437A microprocessor with 24MHz
clock rate which controls the operation of the de-
vice. The CPU has an integrated 16-channel 12-bit
analog-to-digital converter (ADC) which is used to
constantly sample and capture triaxial acceleration
signals from an in-built accelerometer in the unit.
These accelerometers have a range of ±16g (where
g is gravitational acceleration) and were sampled at
50Hz. Note that the frequency of most human ac-
tivities lie within range of 15Hz (San-Segundo et al.,
2016). As such, this sensor sampling rate is ideal for
our problem, since according to the Nyquist rule for
lossless reconstruction of a signal, it needs to be sam-
pled at a rate that is at-least twice its highest frequency
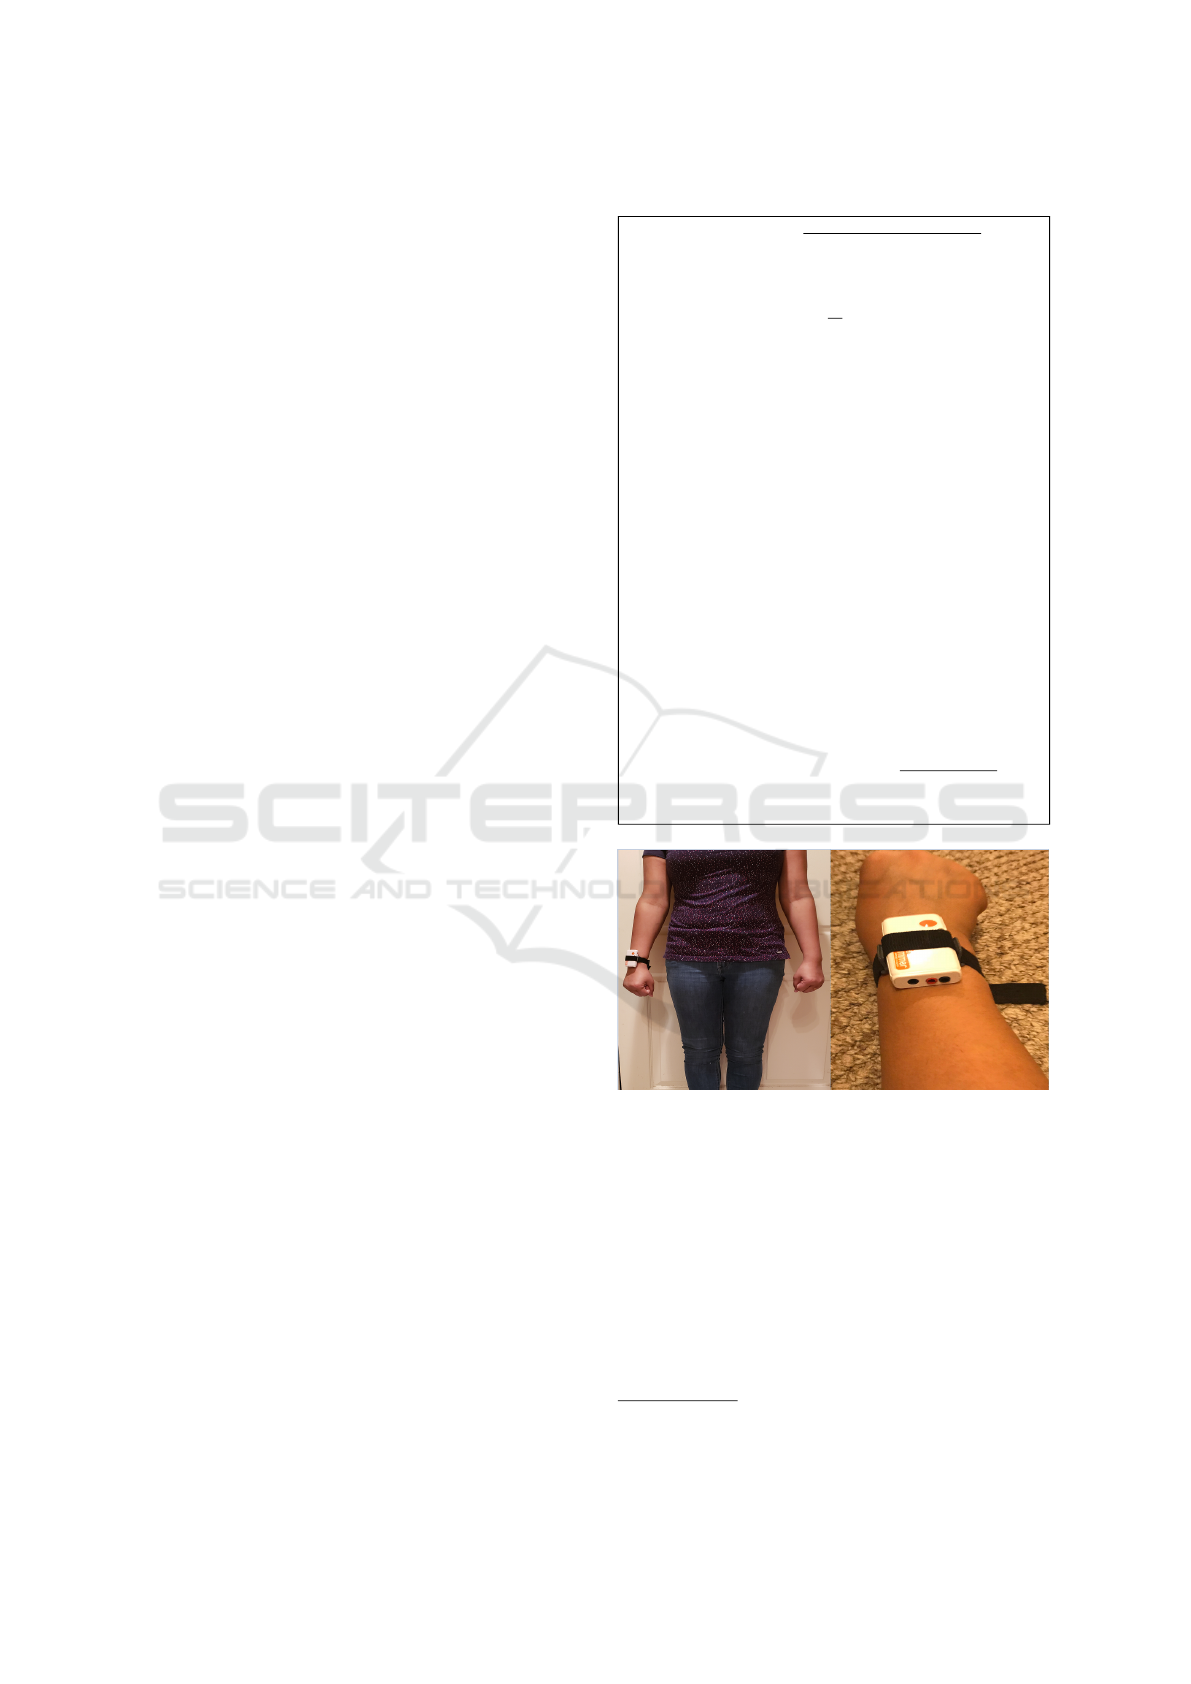
(Landau, 1967). Figure 1 shows one subject in our ex-
periments actually wearing the Shimmer wearable.
4 DATA PRE-PROCESSING,
FEATURE EXTRACTION AND
DIMENSIONALITY
REDUCTION
We now present details on how we pre-processed the
sensory data, followed by feature extraction, and re-
duction of data dimensionality for tractability.
4.1 Data Pre-processing
The first step after data collection is the pre-
processing of raw accelerometer and gyroscope data
collected from the Shimmer wearable. Depending on
the orientation of device, gravity can influence the
readings on one or more of the components of ac-
celerometer data. To avoid this issue, Shimmer API
provides methods to sample linear acceleration di-
rectly and hence eliminating the influence of grav-
ity. Once the linear acceleration data is extracted, we
An Experimental Investigation Comparing Age-Specific and Mixed-Age Models for Wearable Assisted Activity Recognition in Women
369
further pre-process both the accelerometer and gyro-
scope data using an adaptive median filter (Hwang
and Haddad, 1995) to remove noise, and we further
feed the signal to a low pass filter using a 15Hz cut-off
4
th
order Butterworth filter to limit the bandwidth of
the signal to the frequencies common in human mo-
tion, hence removing high frequency noise.
After noise removal, the next step is to determine
a sliding window size for the signals to attempt clas-
sification. A window size, W = 150 samples (ap-
proximately 3 seconds) with 50% overlap was used
to create a new database that was used as the train-
ing/testing data for activity classification, also sug-
gested by prior related work on human activity recog-
nition (Banos et al., 2014) it is found that 2-5 seconds
window works best for human activity recognition us-
ing accelerometer data. Hence, we conducted our ex-
periment with window length from 2 to 5 seconds
having 0.5 second intervals and found that window
length of 3 seconds is working best for our problem.
Subsequently, the segmented window is forwarded to
next steps for feature extraction and selection.
4.2 Feature Extraction
We extracted 11 features (Table 2) for each window
along three axes of tri-axial accelerometer and tri-
axial gyroscope sensor. Each of the features we ex-
tract is contextually relevant, and extensively used in
the literature for classifying physical activities (Gupta
and Dallas, 2014), (De et al., 2015), (Sousa et al.,
2017). For example, variance, entropy and mean
crossing rate features have very good discriminating
power to classify activities like running, walking and
standing. The energy feature is very useful for dis-
criminating more intense activities like brisk walk-
ing and running. Features like variance, entropy and
mean crossing rate also can give vital information
about activities of interest to this paper. Maximum
frequency, skewness, percentile, min and max fea-
ture values captures information from signals that dif-
ferentiate the activities of interest to this paper from
other physical activities that humans perform. As
such, a total 66 features were computed for our prob-
lem, which comes from 11 features in Table 2 for ac-
celerometer and gyroscope across all the axes.
4.3 Dimensionality Reduction with PCA
and LDA
Processing high dimensional data sets (66 features
for our problem) can be noisy, harder to visualize
and computationally demanding. To ensure accuracy
and tractability, dimensionality reduction is a popu-
Table 2: Feature set.
Norm =
N
∑
i=1
q
(a
xi
)
2
+ (a
yi
)
2
+ (a
zi
)
2
Variance =
1
N
N
∑
i=1
(a
i
− µ)
2
Max = argmax
i∈{1,2..N}
(a
i
)
Min = argmin
i∈{1,2..N}
(a
i
)
Entropy = −
N
∑
i=1
p
i
(log p
i
)
Max reduced Mean = ( argmax
i∈{1,2..N}
a
i
) − ¯a
Mean crossing rate = Count o f signal crossing mean
in each window
Spectral energy =
f s/2
∑
f =0
|a[ f ]|
2
Maximum Frequency = argmax
i∈{1,2..N}
FFT (a
x
,a
y
,a
z
)
Mean absolute Deviation =
∑
N
i=1
|a
i
− µ|
N
IQR = 3rd Quartile
median
− 1st Quartile
median
Figure 1: Shimmer wireless sensor device worn on a partic-
ipant’s wrist.
lar approach, for which we use two techniques in this
paper
1
. The first is Principal Component Analysis
(PCA), where the overall goal is to identify ‘prin-
cipal components’, each of which quantify a notion
variance among features, while also being orthogo-
nal to other components (Mika et al., 1999) The sec-
ond technique is Linear discriminant analysis (LDA),
where the overall goal is to find a linear combina-
tion of features that characterizes or separates two or
more classes of objects or events. The resulting com-
1
Both techniques we use in this paper are well estab-
lished, and so we don’t present details.
HEALTHINF 2019 - 12th International Conference on Health Informatics
370

bination may then be used as a linear classifier (Wold
et al., 1987).
5 DATA ANALYSIS OF ELDER VS
YOUNGER ACTIVITY
RECOGNITION
In this section, we show the impact of age-specific,
mixed-age and personalized model development for
classifying physical activities. We do so by a) demon-
strating that variance of features are concentrated
among fewer PCA components only for younger spe-
cific model compared to elder specific model, both of
which are better than mixed-age models; b) results
from clustering activities that demonstrate superior
performance for younger group, followed by the el-
der group and the mixed age group; c) classification
results from many machine learning algorithms that
validate the above results; and d) finally demonstrat-
ing that models personalized for each user have much
higher accuracies compared to any model that mixes
data from subjects.
5.1 Difference in Variance in Each
Category
For all the 66 (2 sensors×3 axes×11 features) fea-
tures listed in Table 2 for our problem, we applied
PCA to transform the feature set into orthogonal PCA
components. Recall that PCA components have vari-
ances of features in decreasing order. If the data is too
noisy or have many orthogonal features, then PCA
components have variances distributed across more
components. When data is more consistent, then most
of the variances are present in very few PCA compo-
nents only. In Figure 2, we immediately see that a sig-
nificant portion (i.e., 90%) of the variances are present
in only one principal component in the left most fig-
ure (i.e., the younger cohort), compared to the other
two cohorts, which are 76.2% and 72.4% respectively.
To quantify further, for the case of the younger cohort,
only 7% of variance are distributed among other com-
ponents other than the principal component. But for
the elder and mixed-age cohorts, we see 20% and 22%
of variances are distributed among components other
than the principal component. This validates our in-
tuition that features of the younger only cohort have
the least amount of noise. The features among the el-
der only cohort is more noisy, but it is worse than the
mixed-age cohort.
5.2 Clustering Activities
Now that we understand the impact of age-specific
models on noise, we leverage Linear Discriminant
Analysis (LDA) to create compact clusters for each
activity, while keeping center of each cluster as sepa-
rated as possible. The LDA approach outputs a list of
transformed components for our problem scope. Out
of these, the first two components, namely LDA1 and
LDA2 are used to draw the clusters for each activity
for younger, elder and mixed-age dataset. Using just
two components helps in better visualization, with-
out losing the generality of our results. Clusters are
plotted in Figure 3. As we can see in the figure, for
younger dataset, each activity cluster is well separated
except brisk-walking and walking. Even these two
activities have less than 10% of samples overlapping.
The reason we believe is very minimal difference in
these two activities which are hard to distinguish by
using just 2 sensors. On the other hand, the activities
in the elder dataset can be seen as more spread apart
from the center of each cluster, indicating more noise.
Furthermore, there are more overlapping points. Es-
pecially brisk-walking with walking, and sitting with
standing have more than 70% samples overlapped.
Running cluster is also not as well separated in elder
dataset as it is compared to the younger dataset. The
mixed-age dataset performs the worst overall.
5.3 Cross-validation Classification
Accuracy
Finally, to delve deeper towards understanding the
impact of age of activities classification, we lever-
age state-of-the-art classification techniques to clas-
sify the activities within younger, elder, and mixed-
age cohort. Unlike in the previous clustering scenario,
here we use 4 LDA components to classify activi-
ties. Classification results using the cross-validation
approach for each algorithm for younger, elder and
mixed cohorts are shown in Figure 4. The machine
learning algorithms used are Linear Support Vector
Machines (Suykens and Vandewalle, 1999) , Sup-
port Vector Machine with Radial Basis Function Ker-
nel (Scholkopf et al., 1997), K-nearest Neighbors
(Larose, 2005), Decision Trees (Safavian and Land-
grebe, 1991) and Random Forests (Breiman, 2001).
Note that the metrics we use, Precision, Recall
and F1-score are standard metrics in evaluating per-
formance of machine learning algorithms for classifi-
cation. The precision is the ratio of correctly classi-
fied positive instances to the total number of instances
classified as positive. Recall is the ratio of correctly
classified positive instances to the total number of
An Experimental Investigation Comparing Age-Specific and Mixed-Age Models for Wearable Assisted Activity Recognition in Women
371
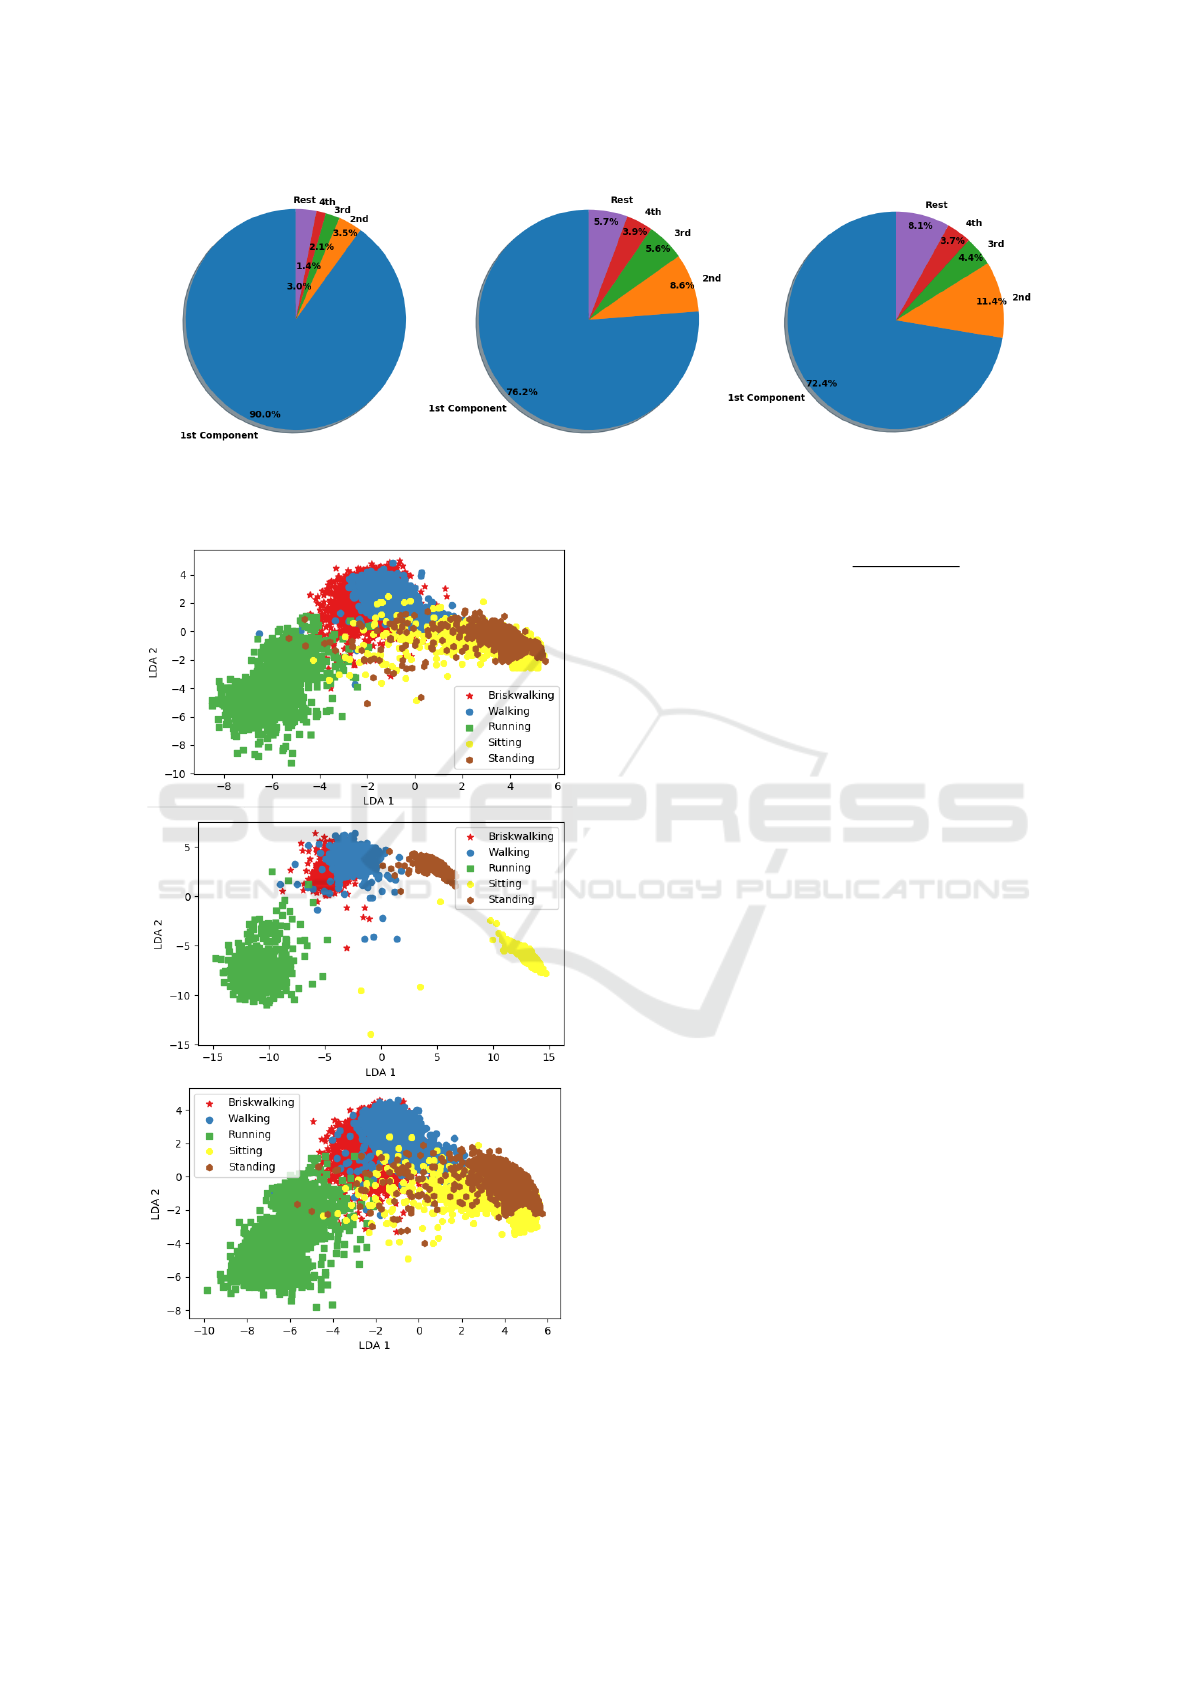
Figure 2: Variance distribution in PCA components for Younger (on left), Elder (on middle) and Mixed (on right) age group
dataset.
Figure 3: Activity cluster for elder (on top), younger (on
middle) and mixed (on bottom) dataset.
positive instances. The F1-score balances precision
as recall, and is given by 2 ×
Precision×Recall
Precision+Recall
.
We see from Figure 4 that while the algorithms do
yield similar classification performance (Recall), we
can see that the Younger only model performs much
better, compared to the Elder only model, while the
Mixed-age model performs the worst overall in all
cases. Most confusion happens between walking and
brisk-walking, which is understandable.
5.4 Personalized Classification Model
for Elder People
With the diversities in activities as performed by el-
ders compromising classification accuracy (when data
from all elders was used for modeling) as presented
above, we now attempt to investigate if personalized
models can help improve classification accuracy for
the elder cohort. In Figure 5, we present classification
accuracy results based on the Random Forest learn-
ing algorithm (which performed the best). As we can
see, the accuracy of all activities is much higher when
a model is trained for each elder subject exclusively
- with an average improvement of 30% in activities
classification.
6 DISCUSSIONS AND
CONCLUSIONS
In this paper, we investigate the impact of age-specific
and personalized algorithms on accuracy for classi-
fying physical activities among women using a wrist
worn wearable device. Using only accelerometer and
gyroscope sensory data, and leveraging state of the
art data mining, and classification algorithmic tech-
niques, we demonstrate that models focusing on a
younger cohort (21-26 age group) were superior in
terms of activities classification compared to an elder
HEALTHINF 2019 - 12th International Conference on Health Informatics
372
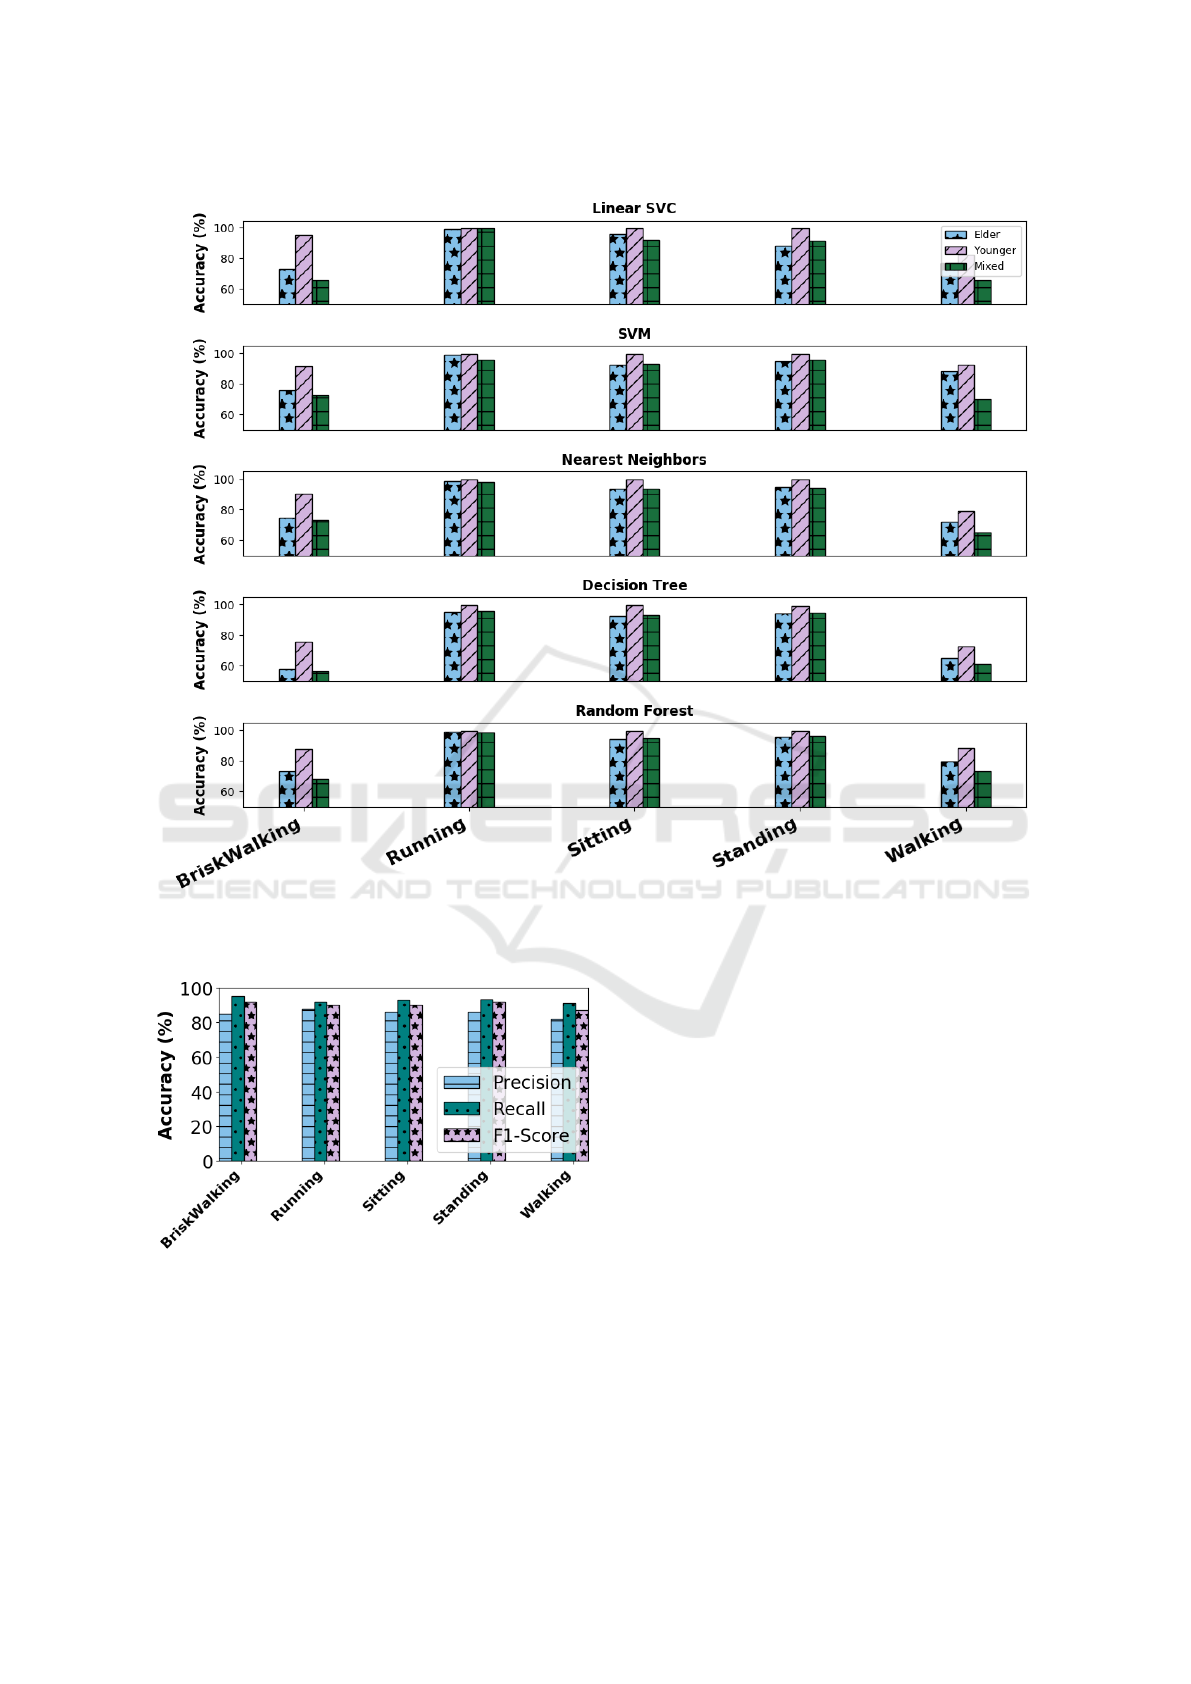
Figure 4: Comparison between accuracy (recall) of activities classification for elder, younger and mixed data using different
classifiers.
Figure 5: Personalized classification accuracy using Ran-
dom Forest on elder data.
only cohort (65-75 age group), with the mixed age
cohort performing the worst. We finally also showed
that for the elder only cohort, a personalized model
performed much better.
REFERENCES
Alinia, P., Cain, C., Fallahzadeh, R., Shahrokni, A., Cook,
D., and Ghasemzadeh, H. (2017). How accurate is
your activity tracker? a comparative study of step
counts in low-intensity physical activities. JMIR
mHealth and uHealth, 5(8).
Avci, A., Bosch, S., Marin-Perianu, M., Marin-Perianu, R.,
and Havinga, P. (2010). Activity recognition using
inertial sensing for healthcare, wellbeing and sports
applications: A survey. In Architecture of computing
systems (ARCS), 2010 23rd international conference
on, pages 1–10. VDE.
Banos, O., Galvez, J.-M., Damas, M., Pomares, H., and Ro-
jas, I. (2014). Window size impact in human activity
recognition. Sensors, 14(4):6474–6499.
Bao, L. and Intille, S. S. (2004). Activity recognition
from user-annotated acceleration data. In Interna-
tional Conference on Pervasive Computing, pages 1–
17. Springer.
Bar-Or, O. (1977). Age-related changes in exercise percep-
An Experimental Investigation Comparing Age-Specific and Mixed-Age Models for Wearable Assisted Activity Recognition in Women
373

tion. Physical Work and Effort G. Borg (ED), pages
255–256.
Beaver, L. (2016). The smartwatch report: Forecasts,
adoption trends, and why the market isn’t living
up to the hype. https://www.businessinsider.
com/smartwatch-and-wearables-research-\
forecasts-trends-market-use-cases-2016-9.
Benz Scott, L. A., Ben-Or, K., and Allen, J. K. (2002). Why
are women missing from outpatient cardiac rehabilita-
tion programs? a review of multilevel factors affect-
ing referral, enrollment, and completion. Journal of
Women’s Health, 11(9):773–791.
Bharti, P., De, D., Chellappan, S., and Das, S. K. (2018a).
Human: Complex activity recognition with multi-
modal multi-positional body sensing. IEEE Transac-
tions on Mobile Computing, pages 1–1.
Bharti, P., Panwar, A., Gopalakrishna, G., and Chellappan,
S. (2018b). Watch-dog: detecting self-harming activi-
ties from wrist worn accelerometers. IEEE Journal of
Biomedical and Health Informatics, 22/3:686–696.
Borg, G. (1998). Borg’s perceived exertion and pain scales.
Human kinetics.
Breiman, L. (2001). Random forests. Machine learning,
45(1):5–32.
Burns, A., Greene, B. R., McGrath, M. J., O’Shea, T. J.,
Kuris, B., Ayer, S. M., Stroiescu, F., and Cionca, V.
(2010). Shimmer–a wireless sensor platform for non-
invasive biomedical research. IEEE Sensors Journal,
10(9):1527–1534.
De, D., Bharti, P., Das, S. K., and Chellappan, S. (2015).
Multimodal wearable sensing for fine-grained activity
recognition in healthcare. IEEE Internet Computing,
19(5):26–35.
de la Concepci
´
on, M.
´
A.
´
A., Morillo, L. M. S., Garc
´
ıa, J.
A.
´
A., and Gonz
´
alez-Abril, L. (2017). Mobile activ-
ity recognition and fall detection system for elderly
people using ameva algorithm. Pervasive and Mobile
Computing, 34:3–13.
Del Rosario, M. B., Wang, K., Wang, J., Liu, Y., Brodie,
M., Delbaere, K., Lovell, N. H., Lord, S. R., and Red-
mond, S. J. (2014). A comparison of activity classi-
fication in younger and older cohorts using a smart-
phone. Physiological measurement, 35(11):2269.
Gupta, P. and Dallas, T. (2014). Feature selection and ac-
tivity recognition system using a single triaxial ac-
celerometer. IEEE Transactions on Biomedical En-
gineering, 61(6):1780–1786.
Hwang, H. and Haddad, R. A. (1995). Adaptive median
filters: new algorithms and results. IEEE Transactions
on image processing, 4(4):499–502.
Jiang, W. and Yin, Z. (2015). Human activity recognition
using wearable sensors by deep convolutional neural
networks. In Proceedings of the 23rd ACM interna-
tional conference on Multimedia, pages 1307–1310.
ACM.
Kaur, R. and Kaur, P. D. (2017). Review on fall detection
techniques based on elder people. International Jour-
nal of Advanced Research in Computer Science, 8(3).
Landau, H. (1967). Sampling, data transmission, and the
nyquist rate. Proceedings of the IEEE, 55(10):1701–
1706.
Larose, D. T. (2005). K-nearest neighbor algorithm. Dis-
covering Knowledge in Data: An Introduction to Data
Mining, pages 90–106.
Lee, L. and Grimson, W. E. L. (2002). Gait analysis for
recognition and classification. In Automatic Face and
Gesture Recognition, 2002. Proceedings. Fifth IEEE
International Conference on, pages 155–162. IEEE.
Levy, B. R. and Myers, L. M. (2004). Preventive health be-
haviors influenced by self-perceptions of aging. Pre-
ventive medicine, 39(3):625–629.
Mika, S., Ratsch, G., Weston, J., Scholkopf, B., and
Mullers, K.-R. (1999). Fisher discriminant analysis
with kernels. In Neural Networks for Signal Process-
ing IX, 1999. Proceedings of the 1999 IEEE Signal
Processing Society Workshop., pages 41–48. IEEE.
Reyes-Ortiz, J.-L., Oneto, L., Sam
`
a, A., Parra, X., and
Anguita, D. (2016). Transition-aware human activ-
ity recognition using smartphones. Neurocomputing,
171:754–767.
Safavian, S. R. and Landgrebe, D. (1991). A survey of de-
cision tree classifier methodology. IEEE transactions
on systems, man, and cybernetics, 21(3):660–674.
San-Segundo, R., Montero, J. M., Barra-Chicote, R., Fer-
nandez, F., and Pardo, J. M. (2016). Feature extrac-
tion from smartphone inertial signals for human activ-
ity segmentation. Signal Processing, 120:359 – 372.
S
´
anchez, D., Tentori, M., and Favela, J. (2008). Activity
recognition for the smart hospital. IEEE intelligent
systems, 23(2).
Scholkopf, B., Sung, K.-K., Burges, C. J., Girosi, F.,
Niyogi, P., Poggio, T., and Vapnik, V. (1997). Com-
paring support vector machines with gaussian kernels
to radial basis function classifiers. IEEE transactions
on Signal Processing, 45(11):2758–2765.
Sousa, W., Souto, E., Rodrigres, J., Sadarc, P., Jalali, R.,
and El-Khatib, K. (2017). A comparative analysis of
the impact of features on human activity recognition
with smartphone sensors. In Proceedings of the 23rd
Brazillian Symposium on Multimedia and the Web,
pages 397–404. ACM.
Suykens, J. A. and Vandewalle, J. (1999). Least squares
support vector machine classifiers. Neural processing
letters, 9(3):293–300.
Valencia, H. E., Savage, P. D., and Ades, P. A. (2011). Car-
diac rehabilitation participation in underserved pop-
ulations. Journal of cardiopulmonary rehabilitation
and prevention, 31(4):203–210.
Wang, Y., Wu, K., and Ni, L. M. (2017). Wifall: Device-
free fall detection by wireless networks. IEEE Trans-
actions on Mobile Computing, 16(2):581–594.
Wold, S., Esbensen, K., and Geladi, P. (1987). Principal
component analysis. Chemometrics and intelligent
laboratory systems, 2(1-3):37–52.
HEALTHINF 2019 - 12th International Conference on Health Informatics
374
