
A 3D Lung Nodule Candidate Detection by Grouping DCNN 2D
Candidates
Fernando Roberto Pereira
1
, David Menotti
2
and Lucas Ferrari de Oliveira
2
1
Informatic Department, Federal Institute of Education, Science and Technology of Santa Catarina, Canoinhas, Brazil
2
Informatic Department, Federal University of Paran
´
a, Curitiba, Brazil
Keywords:
Computer-Aided Detection, Lung Nodule Candidate Detection, Deep Convolutional Neural Network, Single
Shot MultiBox Detector.
Abstract:
Lung cancer has attracted the attention of scientific communities as being the main causes of morbidity and
mortality worldwide. Computed Tomography (CT) scan is highly indicated to detect patterns such as lung
nodules, where their correct detection and accurate classification is paramount for clinical decision-making.
In this paper, we propose a two-step method for lung nodule candidate detection using a Deep Convolutional
Neural Network (DCNN), more specifically the Single Shot MultiBox Detector, for candidate detection in 2D
images/slices, and then a fusion technique to group the inter-slice adjacent detected candidates. The DCNN
system was trained and validated with data from Lung Image Database Consortium and Image Database
Resource Initiative, we also use LUng Nodule Analysis 2016 challenge data and metrics to evaluate the system.
We had as result sensitivity of 96.7% and an average of 77.4 False Positives (FPs) per scan (an entire set of
CT images/slices for a patient). The sensitivity result is ranking two in the state of art (rank one is 97.1%) but
with FPs/scan rate which is almost three times smaller than the first one (219.1).
1 INTRODUCTION
Cancer is one of the leading causes of death world-
wide. Studies of the World Health Organization sho-
wed that in 2015 lung cancer caused approximately
1.69 million deaths. Globally, nearly 1 in 6 deaths is
due to cancer (world Health Organization, 2018). The
Computed Tomography (CT) scan is indicated for the
diagnosis of lung cancer. Based on this exam radiolo-
gists evaluate and decide the best strategy for patient
follow-up. The recurrent use of CT scan image di-
agnosis clinics produces an unprecedented amount of
CT scans (Ciompi et al., 2016).
One of the main challenges to radiologists is the
early detection of solitary lung nodules (i.e., small
nodules). This type of nodule has high probabilities
to become malignant nodule. Early-stage lung can-
cer diagnosis is very important for clinical decision-
making (Li et al., 2016). CT scan exams analysis is
very difficult, repetitive and error-prone task by the
specialist. The Computer-Aided Detection (CAD) sy-
stems are being developed to assist radiologists in no-
dules detection, measurement and those are the se-
cond opinions in diagnoses (Awai et al., 2004).
The absence of standardization in CAD systems
validation has negatively influenced its use for he-
alth professionals. The development of images da-
tabases, such as the Lung Image Database Consor-
tium (LIDC) and Image Database Resource Initiative
(IDRI) (LIDC-IDRI), becomes possible the validation
of techniques based on expert diagnoses to consis-
tently perform (Brown et al., 2014). The LIDC-IDRI
imaging database consists of chest exams performed
by CT scan, documenting the diagnosis of the lesions
found. This database is public for the development,
learning, and evaluation of CAD systems. The Na-
tional Cancer Institute initiated the project, and the
Foundation for the National Institutes of Health and
Food and Drug Administration have continued the
project. Seven academic centers and eight medical
imaging companies collaborated to create the data-
base, which contains 1010 patients from 1018 cases,
totaling 244,527 images. Each case includes chest
CT images and an eXtensible Markup Language file
which records the results of the diagnoses of an image
annotation process performed by up to four experien-
ced radiologists (Armato et al., 2011).
In this sense, there are several relevant studies
found in the literature on the development of CAD
systems for lung nodules detection. In general, CAD
Pereira, F., Menotti, D. and Ferrari de Oliveira, L.
A 3D Lung Nodule Candidate Detection by Grouping DCNN 2D Candidates.
DOI: 10.5220/0007398705370544
In Proceedings of the 14th International Joint Conference on Computer Vision, Imaging and Computer Graphics Theory and Applications (VISIGRAPP 2019), pages 537-544
ISBN: 978-989-758-354-4
Copyright
c
2019 by SCITEPRESS – Science and Technology Publications, Lda. All rights reserved
537

solutions involves stages: i) lung nodule candidate de-
tection; ii) feature extraction; and iii) lung nodule can-
didate classification. The stages of feature extraction
and lung nodule candidate classification belong to the
False Positive (FP) reduction step (Li et al., 2016).
According to (Duggan et al., 2015), the use of ty-
pical approaches for nodule candidate detection such
as multi-thresholding methods and spherical shape fil-
ters are limited. It is very difficult isolating nodules
connected to other high-density structures with inten-
sity thresholds. In the same way, incorporating spher-
ical constraints early into a detection scheme can be
limiting especially in the case of nodules which exhi-
bit a high degree of vascular attachment, since this
type of region has a complex form.
Traditional approaches use hand-designed featu-
res or descriptors that require domain expertise (Lo-
pez Torres et al., 2015). With the advancement of
Deep Convolutional Neural Network (DCNN), se-
veral works have been proposed using learning-based
features, and these works show better results than tra-
ditional approaches (Zhu et al., 2018). Currently,
solutions to object detection in natural images using
DCNN are being proposed to perform nodule candi-
date detection, such as the ones using Faster Region-
based Convolutional Neural Network (Faster R-CNN)
(Ding et al., 2017), (Zhu et al., 2018), and Fully Con-
volutional Networks (FCN) (Dou et al., 2017), (Zhao
et al., 2018).
In this paper, we propose the use of a DCNN,
more specifically the Single Shot MultiBox Detector
(SSD), for the lung nodule candidate detection. The
proposed detector receives a slice of the CT scan and
outputs a squared region (i.e., a Bounding Box - BB)
that delineates the position of the candidate nodules.
Imaging database used was LIDC-IDRI. For learning
purposes, the LIDC-IDRI database is extended crea-
ting three databases by using different ways of resca-
ling the Hounsfield Unit (HU) scale intensity of the
CT images. More specifically, we evaluate two diffe-
rent aspects: i) 2D, using the list of nodules annotati-
ons described in (Reeves and Biancardi, 2011); and ii)
3D, using the list of nodules and metric of the LUng
Nodule Analysis 2016 (LUNA16) challenge (Setio
et al., 2017). LUNA16 is a subset of LIDC-IDRI da-
tabase, where their CT scans with slice thickness are
less than or equal 2.5 mm. Inconsistent slice spacing
or missing slices were excluded from the subset data-
base, leading to a final list of 888 CT scans.
Using the extended databases, we evaluate 2D
candidate detections per images/slices, and compute
the findings by different size category, both informa-
tion has extreme relevance in clinical practice. The
evaluation with the LUNA16 challenge metric is ba-
sed on 3D coordinate. Thus, we propose an algorithm
to merge the inter-slice adjacent detected candidates.
To the best of our knowledge, this is the first time
that this kind of fusion is done. In the nodule candi-
date detection step, CAD systems should provide high
sensitivity even with high False positive detection per
scan (FPs/scan). because, in the FPs reduction step,
usually True Positives (TPs) are also eliminated, re-
ducing even further the system sensitivity.
The rest of this paper is organized as follows.
Section 2 analyzes the related works. The methodo-
logy for lung nodule candidate detection is described
in Section 3. The experimental results obtained are
discussed in Section 4. We conclude this paper in
Section 5.
2 RELATED WORK
The available literature offers acknowledged studies
dealing with the problem of lung nodule candidate de-
tection. The following is a summary of some works.
The work proposed by (Duggan et al., 2015), for
lung nodule candidate detection was based on the ap-
plication of global segmentation methods combined
with mean curvature minimization and simple rule-
based filtering. The proposed method is composed of
some steps: i) a global two-phase segmentation, di-
viding the CT scan into two classes (i.e., tissue and
air). Followed by morphological techniques impro-
ved segmentation of tissue into lung wall and interior
lobe data; ii) to isolate connected nodules was applied
the technique mean curvature smoothing; and iii) de-
tection is carried out by applying the rule-based clas-
sifier and method of Merriman-Bence-Osher smoo-
thing. A testing set of 16 exams were selected in the
LIDC database (includes a total of 27 nodules), com-
posed of nodules exhibiting vascular attachment as
well as isolated nodules. For the evaluation were used
the annotations of the specialists provided with the da-
tabase. The authors obtained an average detection rate
of 96.0%, with an average of 16 candidates per scan
(FPs/scan).
The authors (Ding et al., 2017), proposed a CAD
system based on DCNN for accurate pulmonary no-
dule detection, with two stages: i) candidate detection
on axial axis slices by Faster R-CNN; and ii) FP re-
duction using a 3D DCNN. In the second stage was
used 3D patches for learned feature extraction and
classification. They performed their experiments with
LUNA16 Challenge database. The authors obtained
a sensitivity of 94.6% with 15.0 FPs/scan, in nodule
candidate detection. Considering the detection of no-
dules, they achieved average Free-Response Recei-
VISAPP 2019 - 14th International Conference on Computer Vision Theory and Applications
538
ver Operating Characteristic Curves (FROC) score of
0.8910.
The work proposed by (Zhu et al., 2018), present a
fully automated lung CT cancer diagnosis system cal-
led DeepLung. This work combined two neural net-
works, one for nodule detection and one for nodule
classification (i.e., diagnosis of the detected nodules
into either malignant or benign). To generate candi-
date nodules they used 3D Faster R-CNN. Next, to
deep feature extract from detections was used deep
3D Dual Path Network (DPN). Lastly, they use Gra-
dient Boosting Machine in the output features of the
3D DPN network for the diagnosis. They performed
their experiments with LUNA16 Challenge database.
The authors obtained a sensitivity of 95.8%, in nodule
candidate detection. Considering the detection of no-
dules, they achieve average FROC score of 0.8420.
The authors (Dou et al., 2017), present a DCNN
based system for nodule detection. The system has
two stages. In the first one, a 3D FCN was used in
volumetric CT scans to nodule candidate detection.
In the second stage, for FP reduction was created a
hybrid-loss 3D residual network. Thus, exploiting the
location and size information to improve the lung no-
dule recognition accuracy. They performed their ex-
periments with LUNA16 Challenge database. The
authors obtained a sensitivity of 97.1% with 219.1
FPs/scan, in nodule candidate detection. Considering
the detection of nodules, they achieve average FROC
score of 0.8390.
The work proposed by (Zhao et al., 2018), present
an automatic all size pulmonary nodule detection sy-
stem using two artificial neural networks. First, they
use a U-net 3D network to generate nodule candidates
from CT images. After, they refine the nodule candi-
dates location using another 3D neural network. They
used two public CT database: i) LUNA16 database;
and ii) Kaggle Data Science Bowl 2017 (Kaggle) da-
tabase. To train the nodule candidate system, the aut-
hors selected 1232 and 466 CT scans of the Kaggle
database and of LUNA16 database, respectively. 466
CT scans of LUNA16 database were used to train the
nodule candidates location system . 135 CT scans
from LUNA16 database were used to system evalu-
ation. Considering the detection of nodules, the aut-
hors obtained a sensitivity of 90.0% with 4.0 FPs/scan
and they achieve an average FROC score of 0.8300.
The authors (Huang et al., 2017), proposed a
new CAD system that uses 3D DCNN for detecting
lung nodules in CT scan. The system has two
steps: i) generating nodule candidates using a lo-
cal geometric-model-based filter; and ii) classifying
candidates using 3D DCNN. The proposed CAD sy-
stem use CT scans from the LIDC database, in accor-
dance with the recommended National Lung Scree-
ning Trial screening protocols. They used 99 CT
scans with ≤ 1.25 mm slice thickness. As a limitation
of the experiments performed, they excluded Ground
Glass Opacity and juxta-pleural nodules attached to
the lung boundary. Considering the detection of no-
dules, the authors obtained a sensitivity of 90.0% with
5.0 FPs/scan.
3 METHODOLOGY
3.1 Image Database
Our experiments were performed using the CT scans
from LIDC-IDRI database. We used one CT scan per
patient (981 exams). The CT scans were to divide into
three disjoint datasets, training dataset has 728 scans
(10085 images), 80 scans for the validation dataset
(21984 images) and 173 scans for the testing dataset
(49309 images). Only axial axis slices were used.
We performed two evaluations: i) based on the
list of nodules described in (Reeves and Biancardi,
2011). The list was created to ensure multiple rese-
arch groups using the same dataset of nodules (evalu-
ation is based nodules annotations performed by ex-
perts); and ii) based on the list of nodules and me-
trics of the LUNA16 challenge (evaluation based on
the centroid of the nodules determined by experts, 3D
coordinates) (Setio et al., 2017). We define a centroid
as the center of mass of a geometric object.
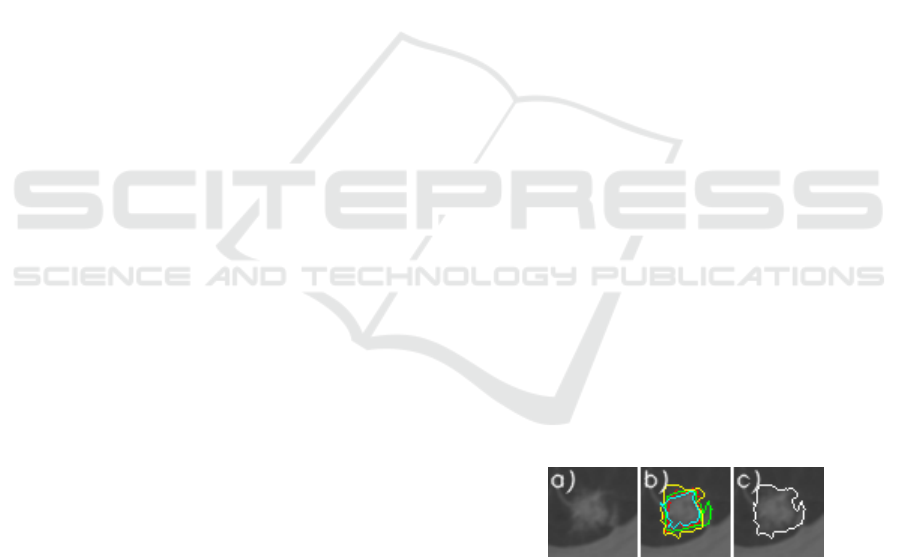
In this work, for standardization, the union of the
annotations of the experts to a nodule in a slice is cal-
led a marker. Figure 1a) shows the example of a no-
dule, Figure 1b) shows the annotation of each expert
and Figure 1c) shows the union of the annotations of
the experts, which in our work is called a marker.
Figure 1: Example of a nodule viewed on the axial axis slice
(a). Annotation of each expert (b). Union of the annotations
of the experts (c).
Only slices with the marker are used in the trai-
ning phase to identify the patterns of interest. The
size of the nodules (i.e., markers) was calculated ba-
sed on the larger number of pixels between width and
height, multiplied by the spacing of slice, the unit of
length in millimeters (mm). The size of the nodules
was calculated and not obtained by the annotations
lists in (Reeves and Biancardi, 2011) or (Setio et al.,
A 3D Lung Nodule Candidate Detection by Grouping DCNN 2D Candidates
539

2017), which provides an estimate of nodules volume.
Figure 2 shows examples of the different nodules fe-
atures and sizes in the testing dataset, organized by
size category.
3.2 Image Pre-processing
The Digital Imaging and Communications in Medi-
cine (DICOM) images were rescaled and converted to
Portable Network Graphics (PNG) format with three
channels of eight bits depth. Three different image
databases were generated, applies pixel-wise a linear
transformation to the intensity values of input DI-
COM image pixels. Equation (1) gives the mapping
of the intensity values
1
.
α = (β − γ) ∗
(δ − ζ)
(λ − γ)
+ ζ (1)
where α is the output value of the pixel, β is the input
value of the pixel. ζ is the minimum output value
and δ is the maximum output value, in all cases, the
values 0 and 255 were used, respectively. The γ and λ
are determined based on the training dataset.
In the same exam, the slices had different values
to minimum and maximum. Thus, we highlight para-
meters γ and λ of the Equation (1). The three image
databases created based on linear transformations are
described in detail, as follows (Figure 3):
• Type I: The parameters γ and λ were computed
based on the minimum and maximum values of
slice. The three channels of the image have the
same values (Figure 3a);
• Type II: The parameters γ and λ were determined
on training dataset (DICOM format). The images
were rescaled using the parameters γ and λ with
values -32768 and 32767 HU, respectively. The
three channels of the image are the same (Figure
3b);
• Type III: The image was composed of three dif-
ferent channels. The first channel uses the format
of the Type I image database (Figure 3a). The se-
cond channel uses the format of the Type II image
database (Figure 3b). The third channel was seg-
mented using thresholds -160 and 240 HU (high
attenuation)(Figure 3c).
According to (Gao et al., 2016), the attenuation
ranges provide better visibility or visual separation
between patterns of pulmonary abnormality. The high
attenuation range models patterns with higher intensi-
ties. Thus, highlight patterns such as nodules.
1
Linear transformation computed with the library Sim-
ple ITK (available in http://www.simpleitk.org/).
3.3 DCNN Architecture
In our our experiments the method used for detecting
objects in images was the SSD
2
(Liu et al., 2016).
This approach uses a single DCNN through of the
Caffe
3
(Jia et al., 2014). framework. According (Liu
et al., 2016), the approach analyzes images to iden-
tify patterns of interest. Thus, it produces a collection
of BBs and scores for representing the presence of
object class instances in those boxes, followed by a
Non-Maximum Suppression (NMS) step to produce
the final detections. The VGG16, without classifica-
tion layers, is the base of this network architecture.
The transfer learning technique that improves the
performance of machine learning by harnessing the
knowledge obtained by another task was used for trai-
ning task (Yaniv Bar, 2015). The VGG16 architecture
received the weights pre-trained of Imagenet Large
Scale Visual Recognition Challenge (ILSVRC) data-
set, after the DCNN was trained with our own dataset.
The problem was modeled with only one class, i.e.,
nodule. The parameters to train network were 1.5e5
iterations, batch size 8, the learning rate of 4e−6 and
rate decay policy is multistep (with steps values 8e4,
1e5 and 1.2e5), weight decay of 5e−4, gamma 0.1
and momentum of 0.9. The coefficients of the para-
meters were based on (Liu et al., 2016). The para-
meters of the threshold for generating and evaluating
detection output were NMS 0.45 and Jaccard overlap
0.5.
3.4 Grouping 2D Candidate Detections
in 3D Nodules
To use the metric of LUNA16 was necessary to join
the candidate detections on each axial slice to de-
termine the 3D nodule centroid. The proposed al-
gorithm computes Jaccard overlap between the de-
tections found for two adjacent axial axis slices, to
determine if two adjacents detections belong to the
same nodule, Jaccard overlap must be greater than the
threshold 0.5. Details of the algorithm is shown in Al-
gorithm 1.
Figure 4 illustrates the algorithm proposed to
group 2D candidate detections on nodule. The ex-
ample show an hypothetical exam with only three
slices S = {s
0
, s
1
, s
2
}, where in slice s
0
there are
five detections D = {d
0
, d
1
, d
2
, d
3
, d
4
} and at slice s
1
there are three detections E = {e
0
, e
1
, e
2
}. The sli-
ces s
0
and s
1
are adjacents. After the interaction
2
SSD method is available in https://github.com/
weiliu89/caffe/tree/ssd.
3
Caffe is a deep learning framework
VISAPP 2019 - 14th International Conference on Computer Vision Theory and Applications
540
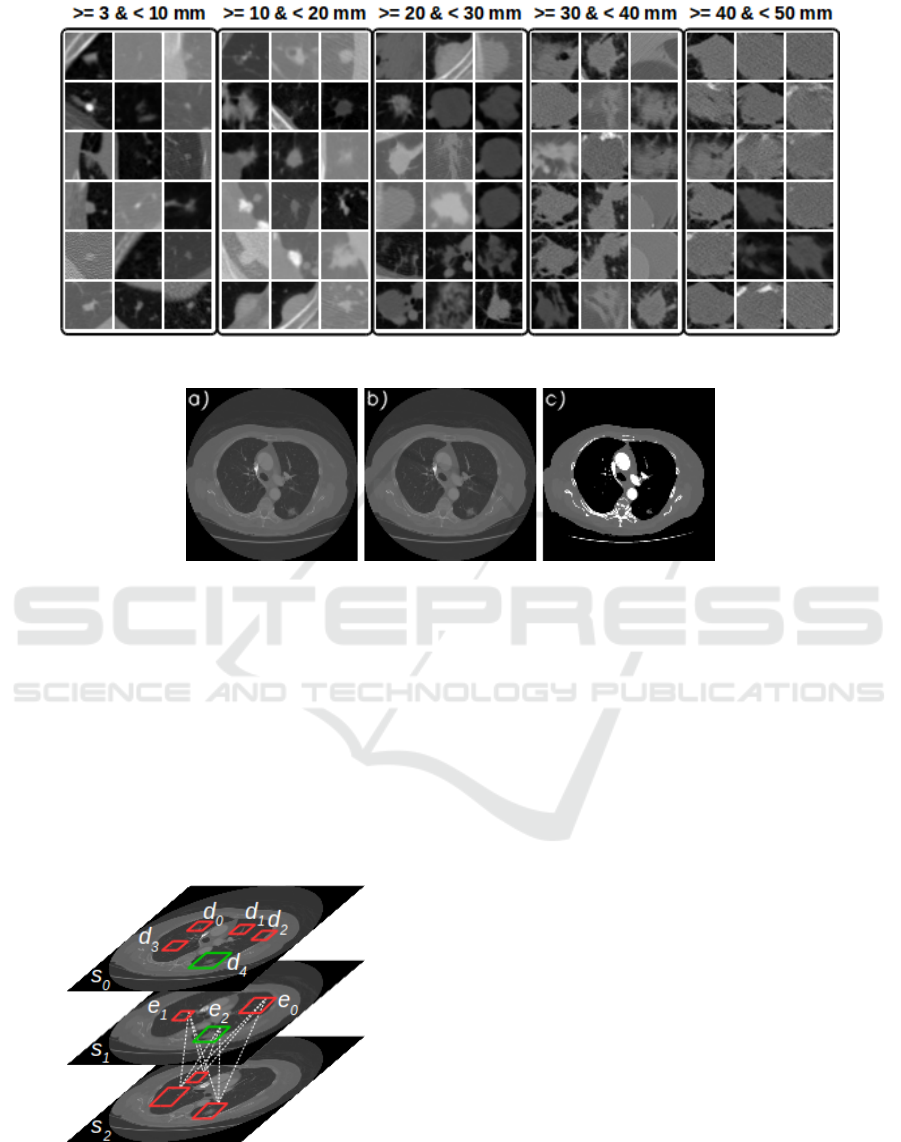
Figure 2: Example of nodules in the axial axis organized by size category.
Figure 3: Type I (a). Type II (b). Type III (a, b and c).
of the algorithm in slice s
0
, that considers the de-
tections found in the slices s
0
and s
1
, the algo-
rithm determines that there are four nodules N =
{{d
0
}
0
, {d
1
}
1
, {d
2
}
2
, {d
3
}
3
, {d
4
, e
2
}
4
}. A 2D candi-
date detection can consist of more than one nodule.
The dashed lines between detections of the slices s
1
and s
2
illustrate that all combinations are tested. In
short, a nodule is a set of 2D candidate detections,
where their center (i.e., centroid) is the median de-
tection. Thus, only one point to represent nodule.
Figure 4: Example how to grouping the 2D candidate de-
tections in nodules.
4 EXPERIMENTS
The proposed nodule candidate detection system was
trained and validated with the various kind of nodules,
where there have different features. The nodules pre-
sent different features regarding texture, shape, and
appearance. These features are: i) calcification pat-
terns; ii) internal structure; iii) lobulation; iv) margin;
v) sphericity; vi) spiculation; and vii) texture.
The validation dataset was used to evaluate the
classifiers, regarding the three databases created. To
validate our technique were calculated the sensitivity
and Area Under Curve (AUC) (an approximation of
the Receiver Operating Characteristic (ROC) curve)
metrics. The validation dataset has 1383 markers with
different size categories. The best model was obtai-
ned with images Type II, considering the all-candidate
detection (i.e., threshold 0.0). We were able to de-
tect 1132 markers, getting a sensitivity of 81.8% and
AUC 0.7929. Table 1 shows the quantitative results.
The model generated with Type I database obtained
the better result of sensitivity with detections of the
markers of size >= 30mm & < 40mm, the difference
was small from 95.5% (i.e., Type I) to 93.3% (i.e.,
Type II).
Some markers were not detected, being them in
A 3D Lung Nodule Candidate Detection by Grouping DCNN 2D Candidates
541

Algorithm 1: Grouping 2D candidate detections in 3D nodules.
Input: Set of slices S = {s
0
, s
1
, s
i
, . . . , s
a
} to one scan; threshold
Output: Set of nodules N = {n
0
, n
1
, n
j
, . . . , n
b
} to one scan where n
j
is set of detections indexes
1 D ← getDetection(s
i
) /* return all the detections of the slice s
i
, D = {d
0
, d
1
, . . . , d
z
} */
2 E ← getDetection(s
i+1
) /* slice s
i+1
, E = {e
0
, e
1
, . . . , e
w
} */
3 foreach d ∈ D do
4 if d ∈ N then
5 T ← getNoduleIdenti f ier(d) /* returns all nodules indexes of which d belongs */
6 else
7 T ← createNodule(d) /* creates a nodule to d and returns nodule index */
8 end
9 foreach e ∈ E do
/* calculates Jaccard overlap between d and e */
10 if JaccardOverlap(d, e) > threshold then
11 updateNodule(N, T, e) /* inserts e into all the nodule where T is part */
12 end
13 end
14 end
15 return N
a
Table 1: Comparison of the three databases created regar-
ding validation dataset.
Size of
marker
(mm)
Amount
of
marker
Sensitivity by
size category
I II III
>= 3 & <10 891 75.4% 77.2% 74.5%
>= 10 & <20 314 87.2% 88.5% 85.0%
>= 20 & <30 129 90.6% 93.0% 89.1%
>= 30 & <40 45 95.5% 93.3% 91.1%
>= 40 & <50 3 100.0% 100.0% 100.0%
>= 50 & <60 1 100.0% 100.0% 100.0%
Amount of detections 5576421 624959 544457
True positive (TP) 1110 1132 1091
False negative (FN) 273 251 292
Sensitivity 80.2% 81.8% 78.8%
The best interaction 129000 130000 100000
AUC 0.7792 0.7929 0.7612
majority the small markers. The SSD method was not
able to identify and to determine BBs for these mar-
kers. This fact justifies the AUC of only 0.7929. See
in Table 1, the evaluation/comparison of the sensiti-
vity by size category o the makers.
We used the metric of the LUNA16 challenge to
evaluate the nodule candidate detection in the testing
dataset. Using the SSD method to detect markers (Ta-
ble 2) and the proposed algorithm to group the candi-
date detections into nodules, we obtained the best re-
sult with FPR of 0.002, the sensitivity of 96.7% with
an average of 77.4 FPs/scan (Table 3).
Even with the higher amount of detections of TPs
markers with FPR of 1.0, we did not obtain better re-
sult regarding nodule detection. This fact is explained
due to a large number of erroneous detections (i.e.,
FPs), the algorithm proposed to grouping candidate
detections in nodules generated a high number of can-
didate nodules using only FPs detections and inserts
many errors in grouping the TPs detections. By eli-
minating some FPs detections, just by changing the
operating point, we were able to get a better result on
nodule candidate detection.
Table 4 shows the quantitative results between our
CAD system and other methods CAD for lung no-
dule candidate detection. Our proposal presents re-
sults comparable to the state-of-the-art CAD systems
in the task of nodule candidate detection. It is remar-
kable that CAD systems that exhibit excellent FROC
metric have at the stage of nodule candidate detection
the strategy to achieve high sensitivity indices with
the smallest possible number of FPs/scan. In this way,
making the FPs reduction step easier.
5 CONCLUSIONS
Lung cancer deserves special attention from other ty-
pes of cancer because it presents one of the highest in-
cidence rates and one of the highest rates of mortality.
Nevertheless, early diagnosis results in a considerable
increase in the patient’s survival probability.
In this paper, the technique proposed use the SSD
method for lung nodule candidate detection on chest
CT scans. Different rescaling CT scans in DICOM
format was used to extended the LIDC-IDRI creating
three databases. A method to join lung nodule candi-
date detections in the 3D space were developed to im-
prove the results. The candidate detections were eva-
VISAPP 2019 - 14th International Conference on Computer Vision Theory and Applications
542

Table 2: Comparison of the amount of markers detections using different operating points in the Type II testing dataset.
Size of
marker (mm)
Amount
of marker
False Positive Rate (FRP)
1.0 0.02 0.01 0.002 0.001 0.0002 0.0001
>= 3 & <10 1698 78.6% 66.4% 64.4% 53.8% 46.9% 27.8% 20.3%
>= 10 & <20 888 88.2% 82.9% 81.8% 75.1% 69.9% 45.8% 32.6%
>= 20 & <30 306 86.2% 81.0% 80.3% 78.4% 77.1% 71.5% 65.3%
>= 30 & <40 71 81.6% 78.8% 76.0% 69.0% 67.6% 59.1% 57.7%
>= 40 & <50 31 100.0% 96.7% 93.5% 83.8% 80.6% 48.3% 32.2%
Threshold 0.0000 0.1112 0.1201 0.1618 0.2013 0.3916 0.5310
Amount of detections 14217187 277493 133647 27358 14741 3944 2257
True positive (TP) 2473 2200 2151 1896 1727 1156 887
False negative (FN) 521 794 843 1098 1267 1838 2107
Sensitivity 82.5% 73.4% 71.8% 63.3% 57.6% 38.6% 29.6%
Table 3: Comparison of the amount of nodules detections using different operating points in the Type II testing dataset.
Nodule candidate detection
False Positive Rate (FPR)
1.0 0.02 0.01 0.002 0.001 0.0002 0.0001
True positive 195 200 198 202 196 151 132
False positive 15169 15477 15499 11737 6754 1248 545
Total number of candidates 17135 17298 17299 13390 8090 1930 1032
Ignored candidates on
excluded nodules
1671 1564 1551 1407 1108 498 328
Ignored candidates which were
double detections on a nodule
100 57 51 44 32 33 27
Sensitivity 93.3% 95.7% 94.7% 96.7% 93.8% 72.2% 63.2%
Average number of
candidates per scan
99.0 100.0 100.0 77.4 46.8 11.2 6.0
Table 4: Comparison of research in the task of lung nodule candidate detection.
Work Database Scans Nodules
Nodule candidate detection
Sensitivity Average FPs/scan
(Duggan et al., 2015) LIDC 16 27 96.0% 16.0
(Ding et al., 2017) LUNA16 888 - 94.6% 15.0
(Zhu et al., 2018) LUNA16 888 - 95.8% -
(Dou et al., 2017) LUNA16 888 - 97.1% 219.1
Our proposed LUNA16 173 209 96.7% 77.4
luated in two aspects: using the list of nodules anno-
tations described in (Reeves and Biancardi, 2011) and
using the list of nodules and metrics of the LUNA16
challenge (Setio et al., 2017). This is an important
contribution, since there are few works in the litera-
ture with quantitative results about lung nodule can-
didate detection step, a fundamental step in the deve-
lopment of CAD systems.
In our experiments, we obtained the best result as
the Type II database model with sensitivity of 96.7%
and an average of 77.4 FPs/scan evaluate with the
LUNA16 metric, for nodule candidate detection with
different diameters and features. From the analysis of
our experiments, we also identified a limitation of our
proposal, i.e., the detection of small markers.
Other strategies can be evaluated to mitigate the
low accuracy for detection of small markers, for in-
stance, the use of FCN with patch input. In prelimi-
nary experiments, this strategy has presented interes-
ting results.
ACKNOWLEDGEMENTS
This research has been supported by Coordination
for the Improvement of Higher Education Person-
nel (CAPES) and the National Council for Scien-
tific and Technological Development (CNPq) grant
465586/2014-7. In addition, we gratefully acknow-
ledge the support of NVIDIA Corporation with the
donation of the Titan Xp GPU used for this research.
A 3D Lung Nodule Candidate Detection by Grouping DCNN 2D Candidates
543

REFERENCES
Armato, S. G., McLennan, G., Bidaut, L., McNitt-Gray,
M. F., Meyer, C. R., Reeves, A. P., Zhao, B., Aberle,
D. R., Henschke, C. I., Hoffman, E. A., Kazerooni,
E. A., MacMahon, H., Beek, E. J. R., Yankelevitz,
D., Biancardi, A. M., Bland, P. H., Brown, M. S.,
Engelmann, R. M., Laderach, G. E., Max, D., Pais,
R. C., Qing, D. P.-Y., Roberts, R. Y., Smith, A. R.,
Starkey, A., Batra, P., Caligiuri, P., Farooqi, A., Gla-
dish, G. W., Jude, C. M., Munden, R. F., Petkovska,
I., Quint, L. E., Schwartz, L. H., Sundaram, B., Dodd,
L. E., Fenimore, C., Gur, D., Petrick, N., Freymann,
J., Kirby, J., Hughes, B., Vande Casteele, A., Gupte,
S., Sallam, M., Heath, M. D., Kuhn, M. H., Dharaiya,
E., Burns, R., Fryd, D. S., Salganicoff, M., Anand, V.,
Shreter, U., Vastagh, S., Croft, B. Y., and Clarke, L. P.
(2011). The lung image database consortium (lidc)
and image database resource initiative (idri): A com-
pleted reference database of lung nodules on ct scans.
Medical Physics, 38(2):915–931.
Awai, K., Murao, K., Ozawa, A., Komi, M., Hayakawa,
H., Hori, S., and Nishimura, Y. (2004). Pulmonary
nodules at chest ct: Effect of computer-aided diagno-
sis on radiologists detection performance. Radiology,
230(2):347–352.
Brown, M. S., Lo, P., Goldin, J. G., Barnoy, E., Kim, G.
H. J., McNitt-Gray, M. F., and Aberle, D. R. (2014).
Toward clinically usable cad for lung cancer screen-
ing with computed tomography. European Radiology,
24(11):2719–2728.
Ciompi, F., Chung, K., van Riel, S. J., Setio, A. A. A.,
Gerke, P. K., Jacobs, C., Scholten, E. T., Schaefer-
Prokop, C., Wille, M. M. W., Marchiano, A., Pasto-
rino, U., Prokop, M., and van Ginneken, B. (2016).
Towards automatic pulmonary nodule management in
lung cancer screening with deep learning. CoRR,
abs/1610.09157.
Ding, J., Li, A., Hu, Z., and Wang, L. (2017). Accurate
pulmonary nodule detection in computed tomography
images using deep convolutional neural networks. In
Descoteaux, M., Maier-Hein, L., Franz, A., Jannin,
P., Collins, D. L., and Duchesne, S., editors, Medi-
cal Image Computing and Computer-Assisted Inter-
vention MICCAI 2017, pages 559–567, Cham. Sprin-
ger International Publishing.
Dou, Q., Chen, H., Jin, Y., Lin, H., Qin, J., and Heng, P.-A.
(2017). Automated pulmonary nodule detection via 3d
convnets with online sample filtering and hybrid-loss
residual learning. In Descoteaux, M., Maier-Hein, L.,
Franz, A., Jannin, P., Collins, D. L., and Duchesne,
S., editors, Medical Image Computing and Computer-
Assisted Intervention MICCAI 2017, pages 630–638,
Cham. Springer International Publishing.
Duggan, N., Bae, E., Shen, S., Hsu, W., Bui, A., Jones, E.,
Glavin, M., and Vese, L. (2015). A technique for lung
nodule candidate detection in ct using global minimi-
zation methods. In Tai, X.-C., Bae, E., Chan, T. F., and
Lysaker, M., editors, Energy Minimization Methods in
Computer Vision and Pattern Recognition, pages 478–
491, Cham. Springer International Publishing.
Gao, M., Bagci, U., Lu, L., Wu, A., Buty, M., Shin, H.-C.,
Roth, H., Papadakis, G. Z., Depeursinge, A., Sum-
mers, R. M., Xu, Z., and Mollura, D. J. (2016). Ho-
listic classification of ct attenuation patterns for in-
terstitial lung diseases via deep convolutional neural
networks. Computer Methods in Biomechanics and
Biomedical Engineering: Imaging & Visualization,
0(0):1–6.
Huang, X., Shan, J., and Vaidya, V. (2017). Lung nodule de-
tection in ct using 3d convolutional neural networks.
In 2017 IEEE 14th International Symposium on Bio-
medical Imaging (ISBI 2017), pages 379–383.
Jia, Y., Shelhamer, E., Donahue, J., Karayev, S., Long, J.,
Girshick, R., Guadarrama, S., and Darrell, T. (2014).
Caffe: Convolutional architecture for fast feature em-
bedding. arXiv preprint arXiv:1408.5093.
Li, W., Cao, P., Zhao, D., and Wang, J. (2016). Pulmonary
nodule classification with deep convolutional neural
networks on computed tomography images. Com-
putational and Mathematical Methods in Medicine,
2016(0):7.
Liu, W., Anguelov, D., Erhan, D., Szegedy, C., Reed, S.,
Fu, C.-Y., and Berg, A. C. (2016). Ssd: Single shot
multibox detector. In Leibe, B., Matas, J., Sebe, N.,
and Welling, M., editors, Computer Vision – ECCV
2016, pages 21–37, Cham. Springer International Pu-
blishing.
Lopez Torres, E., Fiorina, E., Pennazio, F., Peroni, C., Sa-
letta, M., Camarlinghi, N., Fantacci, M. E., and Ce-
rello, P. (2015). Large scale validation of the m5l
lung cad on heterogeneous ct datasets. Med Phys,
42(4):1477–1489.
Reeves, A. P. and Biancardi, A. M. (2011). The lung
image database consortium (lidc) nodule size report.
http://www.via.cornell.edu/lidc/.
Setio, A. A. A., Traverso, A., de Bel, T., Berens, M. S.,
van den Bogaard, C., Cerello, P., Chen, H., Dou, Q.,
Fantacci, M. E., Geurts, B., van der Gugten, R., Heng,
P. A., Jansen, B., de Kaste, M. M., Kotov, V., Lin,
J. Y.-H., Manders, J. T., Sora-Mengana, A., Garca-
Naranjo, J. C., Papavasileiou, E., Prokop, M., Saletta,
M., Schaefer-Prokop, C. M., Scholten, E. T., Schol-
ten, L., Snoeren, M. M., Torres, E. L., Vandemeule-
broucke, J., Walasek, N., Zuidhof, G. C., van Gin-
neken, B., and Jacobs, C. (2017). Validation, com-
parison, and combination of algorithms for automatic
detection of pulmonary nodules in computed tomo-
graphy images: The luna16 challenge. Medical Image
Analysis, 42:1 – 13.
world Health Organization (2018). Cancer.
http://www.who.int/mediacentre/factsheets/fs297/en/.
Accessed: 2018-09-03.
Yaniv Bar, Idit Diamant, L. W. H. G. (2015). Deep lear-
ning with non-medical training used for chest patho-
logy identification.
Zhao, Y., Zhao, L., Yan, Z., Wolf, M., and Zhan, Y. (2018).
A deep-learning based automatic pulmonary nodule
detection system.
Zhu, W., Liu, C., Fan, W., and Xie, X. (2018). Deeplung:
Deep 3d dual path nets for automated pulmonary no-
dule detection and classification. In 2018 IEEE Win-
ter Conference on Applications of Computer Vision,
WACV 2018, Lake Tahoe, NV, USA, March 12-15,
2018, pages 673–681.
VISAPP 2019 - 14th International Conference on Computer Vision Theory and Applications
544
