
Understanding How Video Quality Affects Object Detection Algorithms
Miloud Aqqa, Pranav Mantini and Shishir K. Shah
Quantitative Imaging Laboratory, Department of Computer Science, University of Houston,
4800 Calhoun Road, Houston, TX 77021, U.S.A.
Keywords:
Object Detection, Deep Learning, Video Quality, Visual Surveillance, Public Safety and Security (PSS).
Abstract:
Video quality is an important practical challenge that is often overlooked in the design of automated video
surveillance systems. Commonly, visual intelligent systems are trained and tested on high quality image
datasets, yet in practical video surveillance applications the video frames can not be assumed to be of high
quality due to video encoding, transmission and decoding. Recently, deep neural networks have obtained
state-of-the-art performance on many machine vision tasks. In this paper we provide an evaluation of 4 state-
of-the-art deep neural network models for object detection under various levels of video compression. We
show that the existing detectors are susceptible to quality distortions stemming from compression artifacts
during video acquisition. These results enable future work in developing object detectors that are more robust
to video quality.
1 INTRODUCTION
The increasing diversity and sophistication of threats
to public security have increased the demand for de-
veloping and deploying reliable, secure, and efficient
machine vision systems. Examples include automa-
ted video surveillance platforms and smart camera
networked systems that are monitoring the behavior,
activities, or other changing information for the pur-
pose of protecting people and infrastructure. Howe-
ver, some core applications such as object detection
in intelligent surveillance are still affected by a num-
ber of practical problems. In particular, quality dis-
tortions originated from spatial and temporal artifacts
during video compression.
Recent progress in computer vision techniques ba-
sed on deep neural networks (DNN) and related vi-
sual analytics offers new research directions to under-
stand visual content. For example, recurrent neural
networks have shown promise in modeling temporal
dynamics in videos (Donahue et al., 2015), while con-
volutional neural networks have demonstrated superi-
ority on modeling high-level visual concepts (Krizhe-
vsky et al., 2012).
Regardless of their breathtaking performance,
deep networks have been shown to be susceptible to
adversarial perturbations (Goodfellow et al., 2015).
Adversarial samples are generated with high percep-
tual quality by adding small-magnitude noise to in-
puts and can mislead the learning system (Goodfellow
et al., 2015). They present an interesting problem, ho-
wever in automated video surveillance systems such
carefully chosen noise is unlikely to be encountered.
It is much more likely to encounter quality distortions
stemming from spatial artifacts (i.e., blocking, blur-
ring, color bleeding, and ringing) during video acqui-
sition and transmission.
In this paper, we examine the impact of these dis-
tortions on detection performance of 4 state-of-the-art
object detectors and at which levels of video compres-
sion they can provide reliable results. This provides
guidance on their detection ability in automated video
surveillance platforms.
In order to evaluate the performance of object de-
tection algorithms, many valuable benchmarks have
been proposed in the literature. Among these are
COCO (Lin et al., 2014), PASCAL VOC 2007 and
2012 (Everingham et al., 2010). However, they all
contains still images that have distinctly different cha-
racteristics as compared to video frames encountered
in video surveillance systems. Therefore, we believe
that creating a dataset designed with this purpose in
mind is necessary and it was one of our motivations
in this work.
Our contributions are listed as follows.
• We introduce a novel benchmark dataset that will
be made publicly available with uncompressed vi-
deos and their compressed counterparts under dif-
ferent levels of compression.
96
Aqqa, M., Mantini, P. and Shah, S.
Understanding How Video Quality Affects Object Detection Algorithms.
DOI: 10.5220/0007401600960104
In Proceedings of the 14th International Joint Conference on Computer Vision, Imaging and Computer Graphics Theory and Applications (VISIGRAPP 2019), pages 96-104
ISBN: 978-989-758-354-4
Copyright
c
2019 by SCITEPRESS – Science and Technology Publications, Lda. All rights reserved
• We evaluate 4 state-of-the-art object detectors on
this novel dataset.
• We provide a detailed analysis of the common fai-
lure cases with respect to object characteristics to
help future work in developing detectors that are
more robust to compression artifacts.
In section 2, we review some of the related stu-
dies. In section 3, we describe the dataset, the algo-
rithms and the experimental methodology used in this
work. Section 4 reports the results obtained from our
experiments. In section 5, we conclude our work.
2 RELATED WORK &
BACKGROUND
Since recognition benchmarks perform their evalua-
tion on held-out sets of the same dataset, the reported
performance of state-of-the-art algorithms can at
best be interpreted to accurately characterize their
expected accuracy on similar high-quality image
data. Therefore, it is interesting to investigate their
performance on input images with quality distortions.
Effects of Noise on Deep Neural Networks:
Szegedy et al. found that carefully optimized
small-magnitude perturbations could cause network
models to produce erroneous estimates (Szegedy
et al., 2014). Dodge and Karam evaluated a variety
of state-of-the-art classification networks under noise
and blur and found a substantial drop in performance
(Dodge and Karam, 2016). Zhou et al. also discuss
loss in accuracy caused by various image degra-
dations, and include preliminary experiments that
suggest that this can be overcome to some extent by
fine-tuning the initial layers of Alexnet (Krizhevsky
et al., 2012) on degraded data (Zhou et al., 2017).
Similarly Vasiljevic et al. showed that blur decreased
classification and segmentation performance for deep
networks, though much of the lost performance was
regained by fine-tuning on blurry images (Vasiljevic
et al., 2016). Recent work has also considered the
effect of image degradations on networks trained for
face recognition (Karahan et al., 2016). Karam and
Zhu present a face recognition dataset that considers
five different types of quality distortions. They
however do not evaluate the performance of any
models on this new dataset (Karam and Zhu, 2015).
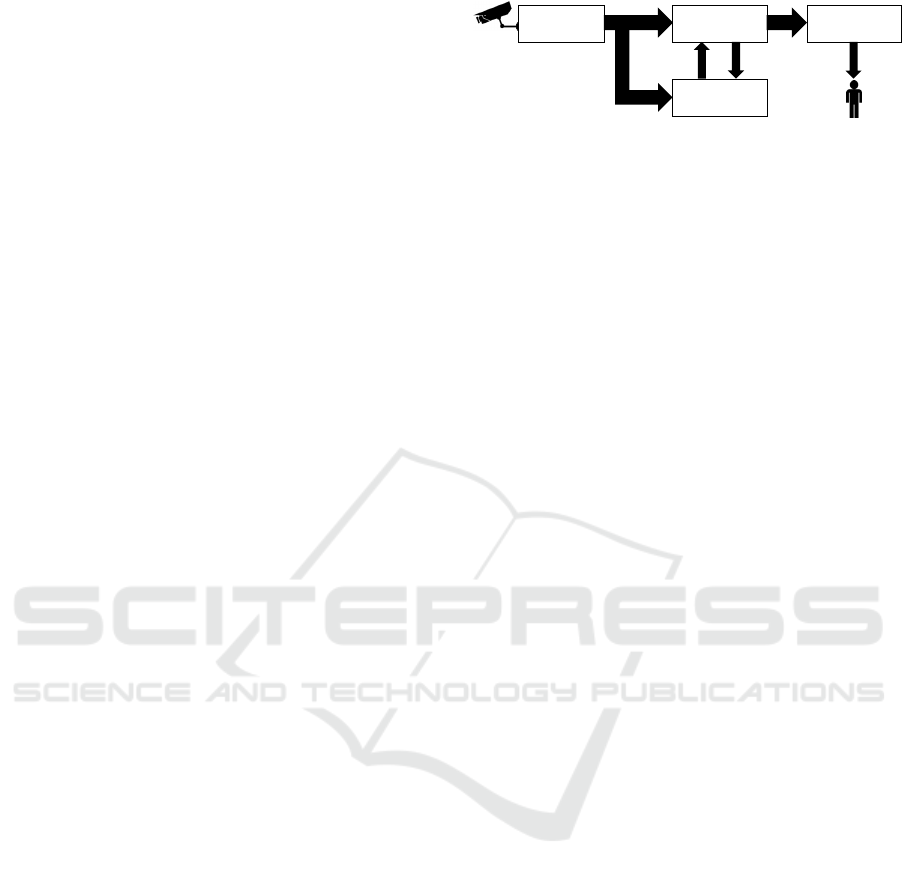
Video Compression in Surveillance Systems: In au-
tomated video surveillance platforms, two key aspects
have an initial impact on video analytics algorithms,
namely, the encoding parameters that facilitate acqui-
Quality Encoding
(H.264)
Video Management
System (VMS)
Wireless
Backhaul
Video Analytics
Algorithms
Physical Security
Info. Management
(PSIM)
Figure 1: Data/Information flow in a typical automated vi-
deo surveillance system.
sition of video stream, and the network characteris-
tics that facilitate data transmission. In real deploy-
ments of public safety video systems, cameras are of-
ten backhauled via wireless links, where packet loss
and signal jitter impact video quality. In addition,
due to bandwidth constraints, video is generally enco-
ded at the camera prior to transmission, thereby pos-
sibly reducing the quality of video available for video
analytics. A high-level schematic of data/information
flow is characterized in Figure 1.
Video transportation from the camera to the
VMS/video analytics compute engine is performed
over an IP network infrastructure. Often times these
transmission channels have limited bandwidth and are
allowed a certain quota per camera. Video is compres-
sed allowing for its transmission over the bandwidth
limited channels. Most video surveillance cameras
adopt the H.264 standard (Wiegand et al., 2003) for
video encoding, which is a lossy compression techni-
que. H.264 exploits spatial redundancy within images
and temporal redundancy in videos to achieve appea-
ling compression ratios, making it a widely accepted
standard for video transmission for a myriad of ap-
plications. A video consists of images; an image is
divided into slices and blocks. A block is a square
part (16×16, 8×8 and 4×4) of the images. H.264
is a block based coder/decoder, meaning that a se-
ries of mathematical functions are applied on indivi-
dual blocks to achieve compression and decompres-
sion (Juurlink et al., 2012). We study the effect of this
degradation in quality on object detection algorithms.
To the best of our knowledge we are the first to
conduct evaluation of object detection algorithms on
surveillance videos under different levels of compres-
sion artifacts. We use a new dataset that consists of
thirty uncompressed videos recorded in different sur-
veillance scenarios (indoor and outdoor). The video
frames from these videos are considered to be of high-
quality. We augment this dataset by introducing arti-
facts under different levels of video compression and
then evaluate the detection performance of state-of-
the-art object detectors on these compressed videos.
Understanding How Video Quality Affects Object Detection Algorithms
97
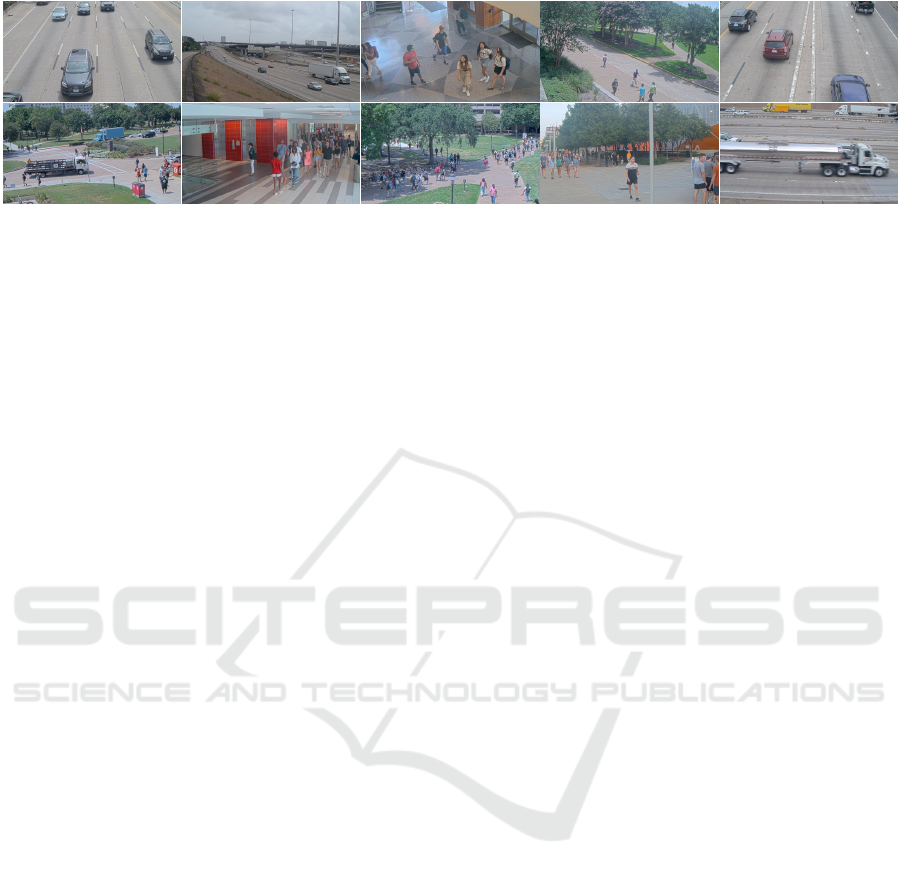
Figure 2: Samples of video frames from uncompressed videos recorded in indoor and outdoor surveillance scenarios.
3 EXPERIMENTAL SETUP
3.1 Dataset
We have collected thirty uncompressed videos that re-
present common scenarios where video surveillance
cameras are deployed with the goal of advancing the
state-of-the-art in object detection by placing the que-
stion of object recognition in the context of public sa-
fety systems. The dataset contains 7 object categories
(person, car, bicycle, truck, bus, handbag, and back-
pack) spread over 240,000 video frames. The videos
are 5 minutes long movie clips and were recorded
with different viewpoints and distance with respect to
the objects of interest. Samples of video frames are
shown in Figure 2.
The videos were acquired using AXIS P3227-
LVE network camera, which is a streamlined,
outdoor-ready 5 MP fixed dome camera that featu-
res a varifocal lens with remote zoom and focus. The
AXIS camera can acquire a video with different reso-
lutions. We have opted to record the videos in 1080p
high definition (1920×1080) at 30fps.
To simulate video compression in surveillance ca-
meras, we have used the FFmpeg tool, which is a
multimedia software that allows for H.264 encoding
in Constant Rate Factor (CRF) mode. CRF achieves
constant quality by compressing different frames by
different amounts, thus varying the Quantization Pa-
rameter (QP) as necessary to maintain a certain level
of perceived quality. It does this by taking motion
into account similar to the encoder on a surveillance
camera. CRF ranges between 0 and 51, where lower
values would result in better quality and higher values
lead to more compression. With different videos, dif-
ferent CRF values result in different bitrates. We have
used CRF in conjunction with Video Buffer Verifier
(VBV) mode to ensure that the bitrate is constrained
to a certain maximum as in real-world settings. This
is crucial in determining the trade-off between qua-
lity and bitrate. An exhaustive combination of CRF
values (29, 35, 41, 47) and maximum bitrate values
(2Mb/s, 1.5Mb/s, 1Mb/s) are selected to create a to-
tal of 12 data variants. An uncompressed video frame
and its compressed variants are depicted in Figure 3.
3.2 Object Detectors
CNN-based detectors have been the mainstream in
current academia and industry. We can divide existing
CNN-based detectors into two categories: two-stage
detectors such as Faster R-CNN (Ren et al., 2015),
R-FCN (Dai et al., 2016) or Mask R-CNN (He et al.,
2017), and singe-stage detectors like SSD (Liu et al.,
2016), YOLO (Redmon and Farhadi, 2018) or Retina-
Net (Lin et al., 2017b). These models are usually fas-
ter than two-stage object detectors. In this paper we
study the impact of video quality on four representa-
tive object detectors: Faster R-CNN, SSD, YOLO and
RetinaNet.
Faster R-CNN is a region-based deep detection mo-
del that improves Fast R-CNN (Girshick, 2015) by
introducing the Region Proposal Network (RPN). It
uses a fully convolutional network to predict object
bounds at every location to generate regions of in-
terest. In the second stage, the region proposals by
the RPN are sent down the pipeline as an input for
the Fast R-CNN model to provide the final object de-
tection results.
SSD is a single-stage detector that uses a set of pre-
defined boxes of different aspect ratios and scales in
order to predict the presence of an object in a certain
image. SSD does not include the traditional proposal
generation and resampling stages, common for two-
stage detectors, but it encapsulates all computations
in a single network, thus being faster than the two-
stage models.
YOLO is a single-stage model that treats the de-
tection task as a regression problem. It uses a single
neural network to predict the bounding boxes and the
corresponding classes, taking the full image as an in-
VISAPP 2019 - 14th International Conference on Computer Vision Theory and Applications
98
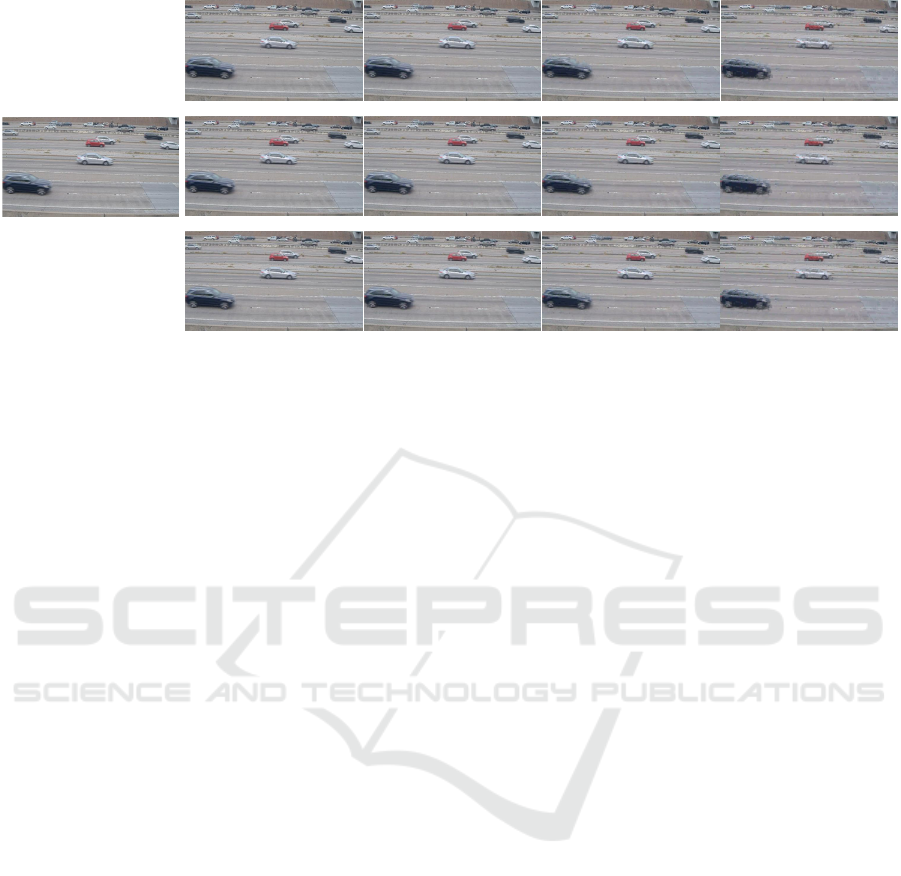
Uncompressed frame
CRF=29, bitrate=2Mb/s
CRF=29, bitrate=1Mb/s
CRF=29, bitrate=1.5Mb/s
CRF=35, bitrate=2Mb/s CRF=41, bitrate=2Mb/s CRF=47, bitrate=2Mb/s
CRF=35, bitrate=1.5Mb/s
CRF=41, bitrate=1.5Mb/s
CRF=47, bitrate=1.5Mb/s
CRF=35, bitrate=1Mb/s CRF=41, bitrate=1Mb/s CRF=47, bitrate=1Mb/s
Figure 3: An uncompressed video frame and its 12 compressed versions. The compression artifacts can be visually perceived
as CRF value increases and bitrate decreases. The combination CRF=29 and maximum bitrate of 2Mb/s results in lower com-
pression, thus better video quality. The combination CRF=47 and maximum bitrate of 1Mb/s results in higher compression,
thus worst video quality.
put. The fact that it does not use sliding window or
region proposal techniques provides more contextual
information about classes. YOLO works by dividing
each image into a fixed grid, and for each grid loca-
tion, it predicts a number of bounding boxes and a
confidence for each bounding box. The confidence
reflects the accuracy of the bounding box and whet-
her the bounding box actually contains an object.
RetinaNet is a single-stage detector based on the fo-
cal loss, which can significantly reduce false positives
in one-stage detectors. It uses a Feature Pyramid Net-
work (FPN) (Lin et al., 2017a) backbone on top of
a feedforward ResNet architecture (He et al., 2015)
to generate a rich, multi-scale convolutional feature
pyramid. To this backbone RetinaNet attaches two
subnetworks, one for classifying anchor boxes and
one for regressing from anchor boxes to ground-truth
object boxes.
These networks have all been trained on the
COCO dataset (Lin et al., 2014) which contains 80
object categories. We use the pre-trained model of
each one of the selected detectors and we limit to a
subset of 7 object categories in our experiments.
3.3 Evaluation Measure and Settings
According to the common practice in object detection
community, we adopt the mean Average Precision
(mAP) over classes, which is based on the ranking
of detection scores for each class (Everingham et al.,
2010). For each object class, the Average Precision
is given by the area under the precision-recall (PR)
curve for the detected objects. The PR curve is con-
structed by first mapping each detected bounding box
to the most-overlapping ground-truth bounding box,
according to the Intersection over Union (IoU) mea-
sure, but only if the IoU is higher than 50% (Evering-
ham et al., 2015). Then, the detections are sorted in
decreasing order of their scores. Precision and recall
values are computed each time a new positive sample
is recalled. The PR curve is given by plotting the pre-
cision and recall pairs as lower scored detections are
progressively included.
For the following experiments, we consider the
detections of a detector i on uncompressed videos as
ground-truth bounding boxes and we compare them
against the detections of the same detector on the
12 compressed variants to assess the impact of video
compression on the detection performance.
All detectors were executed using the default pa-
rameters and run on a Linux machine with Intel
Xeon E5-2680v4 CPU, NVIDIA Tesla V100 GPU
and 16GB RAM.
4 RESULTS
The evaluation results of our experiments are shown
in Table 1. All of the detectors are very sensitive to
compression artifacts. Even for moderate compres-
sion levels (i.e, CRF value of 29), the performance of
the detectors decreases by at least 16.9%. This de-
gradation in performance can be explained because
compression artifacts (e.g, blocking, blurring) remo-
ves textures and details in these video frames. These
high-frequency features represent edges and shapes of
objects that the detector may be looking for to classify
Understanding How Video Quality Affects Object Detection Algorithms
99

Table 1: Percentage decrease in the mean average precision (mAP) for the four detectors that were trained on high quality
images.
Bitrate 2Mb/s Bitrate 1.5 Mb/s Bitrate 1Mb/s
CRF-29 CRF-35 CRF-41 CRF-47 CRF-29 CRF-35 CRF-41 CRF-47 CRF-29 CRF-35 CRF-41 CRF-47
Faster R-CNN 31.5% 38.2% 54.0% 78.2% 33.3% 38.3% 54.2% 78.2% 38.7% 41.3% 54.2% 78.4%
SSD512 16.8% 25.5% 42.2% 69.3% 19.7% 25.4% 42.4% 69.5% 23.7% 27.4% 43.0% 70.2%
YOLOv3 17.9% 22.6% 33.9% 55.4% 19.5% 23.0% 34.0% 55.4% 23.0% 24.6% 33.9% 55.6%
RetinaNet 21.8% 29.1% 49.0% 77.7% 24.2% 29.7% 49.1% 77.8% 29.3% 32.8% 48.9% 78.1%
an object. Compression artifacts cause the filter re-
sponses in the first convolutional layer to change slig-
htly. These changes in the first layer response are pro-
pagating to create larger changes at the higher layer
which explains why these detectors could not learn
features invariant to quality distortions even though
they have a deeper structure.
Interestingly, the drop is steeper for Faster R-CNN
that has a separate stage for region proposals compa-
red to other detectors. YOLO appears more robust
particularly at higher compression levels benefiting
probably from the fact that it does not use sliding win-
dow or region proposal techniques, which provides
more contextual information about object categories.
In order to understand the reasons behind the drop
in performance, we examine false positive errors si-
milar to (Hoiem et al., 2012). False positives are de-
tections that do not correspond to the target category.
For the rest of the experiments, we selected YOLO
as the object detector, which is the top performer and
more resilient to compression artifacts compared to
other detectors.
4.1 Analysis of False Positives
We investigate how much of the performance degra-
dation seen in the previous section is due compres-
sion artifacts. There are different types of false posi-
tives (Hoiem et al., 2012). Localization error occurs
when an object from the target category is detected
with a misaligned bounding box (0.1 ≤ IoU < 0.5).
Duplicate detections are also counted as localization
error because they are avoidable with good localiza-
tion. Remaining false positives that have at least 0.1
overlap with an object from a similar category are
counted as confusion with similar objects. We consi-
der two categories to be semantically similar if they
are both within one of these sets: {person}, {car,
truck, bus, bicycle}, {backpack, handbag}. Confu-
sion with other objects describes remaining false po-
sitives that have at least 0.1 overlap with another la-
beled object. All other false positives are conside-
red to be confusion with background. These could be
detections within highly textured areas or confusions
with unlabeled objects.
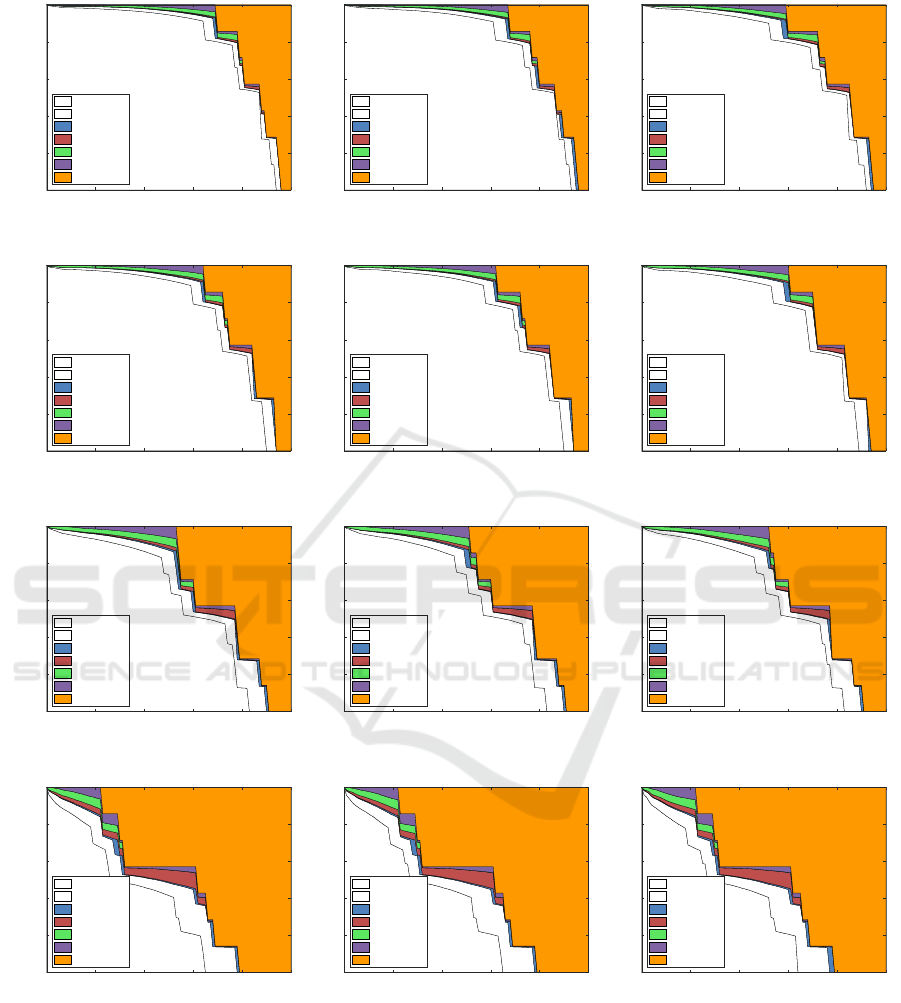
In Figure 4, we show a breakdown of errors of
YOLO averaged over all object categories. In the
case of the highest compression (i.e., CRF=29 and
Bitrate=1Mb/s), overall mAP at IoU=.50 is .444 and
perfect localization would only increase mAP by 1%
to .454. Interesting, removing all class confusions
(both within supercategory and across supercatego-
ries) would only raise mAP slightly by 3.8% to .492.
Removing background false positives would bump
performance to .511 mAP. The rest of the errors are
detections with lower confidence score or missing de-
tections due to quality degradations stemming from
compression artifacts. In other words, YOLO’s errors
are dominated by missing detections and its detection
performance is reduced roughly by 50% due to higher
compression.
4.2 Per-category Analysis of Object
Characteristics
An object may be difficult to detect due to occlusion,
truncation, small size, or unusual viewpoint. In this
section, we measure the sensitivity of YOLO to ob-
ject size and aspect ratio at the lowest compression
(CRF=29, Bitrate=2Mb/s) and the highest compres-
sion (CRF=47, Bitrate=1Mb/s).
Similar to (Hoiem et al., 2012), object size is me-
asured as the pixel area of the bounding box. We
assign each object to a size category, depending on
the objects percentile size within its object category:
extra-small (XS: bottom 10%); small (S: next 20%);
medium (M: next 40%); large (L: next 20%); extra-
large (XL: next 10%). Aspect ratio is defined as ob-
ject width divided by object height, computed from
the ground-truth bounding box. Similarly to object
size, objects are categorized into extra-tall (XT), tall
(T), medium (M), wide (W), and extra-wide (XW),
using the same percentiles.
Upon careful inspection of Figure 5, we can le-
VISAPP 2019 - 14th International Conference on Computer Vision Theory and Applications
100
CRF=29, Bitrate=2Mb/s CRF=29, Bitrate=1.5Mb/s CRF=29, Bitrate=1Mb/s
overall-all-all
0 0.2 0.4 0.6 0.8 1
recall
0
0.2
0.4
0.6
0.8
1
precision
[.789] C75
[.821] C50
[.824] Loc
[.826] Sim
[.838] Oth
[.847] BG
[1.00] FN
overall-all-all
0 0.2 0.4 0.6 0.8 1
recall
0
0.2
0.4
0.6
0.8
1
precision
[.772] C75
[.805] C50
[.813] Loc
[.816] Sim
[.828] Oth
[.839] BG
[1.00] FN
overall-all-all
0 0.2 0.4 0.6 0.8 1
recall
0
0.2
0.4
0.6
0.8
1
precision
[.732] C75
[.770] C50
[.777] Loc
[.781] Sim
[.795] Oth
[.808] BG
[1.00] FN
CRF=35, Bitrate=2Mb/s CRF=35, Bitrate=1.5Mb/s CRF=35, Bitrate=1Mb/s
overall-all-all
0 0.2 0.4 0.6 0.8 1
recall
0
0.2
0.4
0.6
0.8
1
precision
[.733] C75
[.774] C50
[.780] Loc
[.785] Sim
[.798] Oth
[.809] BG
[1.00] FN
overall-all-all
0 0.2 0.4 0.6 0.8 1
recall
0
0.2
0.4
0.6
0.8
1
precision
[.729] C75
[.770] C50
[.776] Loc
[.781] Sim
[.794] Oth
[.806] BG
[1.00] FN
overall-all-all
0 0.2 0.4 0.6 0.8 1
recall
0
0.2
0.4
0.6
0.8
1
precision
[.708] C75
[.754] C50
[.759] Loc
[.765] Sim
[.779] Oth
[.792] BG
[1.00] FN
CRF=41, Bitrate=2Mb/s CRF=41, Bitrate=1.5Mb/s CRF=41, Bitrate=1Mb/s
overall-all-all
0 0.2 0.4 0.6 0.8 1
recall
0
0.2
0.4
0.6
0.8
1
precision
[.598] C75
[.661] C50
[.671] Loc
[.682] Sim
[.698] Oth
[.716] BG
[1.00] FN
overall-all-all
0 0.2 0.4 0.6 0.8 1
recall
0
0.2
0.4
0.6
0.8
1
precision
[.598] C75
[.660] C50
[.669] Loc
[.680] Sim
[.696] Oth
[.713] BG
[1.00] FN
overall-all-all
0 0.2 0.4 0.6 0.8 1
recall
0
0.2
0.4
0.6
0.8
1
precision
[.597] C75
[.661] C50
[.668] Loc
[.678] Sim
[.694] Oth
[.711] BG
[1.00] FN
CRF=47, Bitrate=2Mb/s CRF=47, Bitrate=1.5Mb/s CRF=47, Bitrate=1Mb/s
overall-all-all
0 0.2 0.4 0.6 0.8 1
recall
0
0.2
0.4
0.6
0.8
1
precision
[.359] C75
[.446] C50
[.456] Loc
[.483] Sim
[.494] Oth
[.511] BG
[1.00] FN
overall-all-all
0 0.2 0.4 0.6 0.8 1
recall
0
0.2
0.4
0.6
0.8
1
precision
[.359] C75
[.446] C50
[.455] Loc
[.482] Sim
[.494] Oth
[.511] BG
[1.00] FN
overall-all-all
0 0.2 0.4 0.6 0.8 1
recall
0
0.2
0.4
0.6
0.8
1
precision
[.357] C75
[.444] C50
[.454] Loc
[.481] Sim
[.492] Oth
[.511] BG
[1.00] FN
Figure 4: An overall analysis of errors of YOLO averaged over all object categories. Each plot is a series of precision recall
curves (PR) where each PR curve is guaranteed to be strictly higher than the previous as the evaluation setting becomes
more permissive. The area under each curve is shown in brackets in the legend. The curves are as follows: C75: PR at
IoU=.75. C50: PR at IoU=.50. Loc: PR at IoU=.10 (localization errors ignored, but not duplicate detections). All remaining
settings use IoU=.10. Sim: PR after supercategory false positives (fps) are removed. Oth: PR after all class confusions are
removed. BG: PR after all background (and class confusion) fps are removed. FN: PR after all remaining errors are removed.
Interesting, removing all BG and class confusion (both within supercategory and across supercategories) would only raise
mAP from 0.444 to 0.511 at the highest compression (CRF=47, Bitrate= 1Mb/s). In summary, YOLO’s errors are dominated
by FN (Detections with lower confidence score or missing detections).
Understanding How Video Quality Affects Object Detection Algorithms
101
XS S M L XL XS S M L XL XS S M L XL XS S M L XL XS S M L XL XS S M L XL XS S M L XL
0
0.2
0.4
0.6
0.8
1
Average Precision (AP)
0.85
0.89
0.95
0.98
0.98
Person
0.87
0.93
0.96
0.97
0.96
Car
0.74
0.82
0.90
0.92
0.92
Truck
0.55
0.63
0.51
0.76
0.84
Bicycle
0.59
0.65
0.79
0.82
0.77
Backpack
0.65
0.74
0.80
0.78
0.75
Handbag
0.70
0.85
0.91
0.87
0.84
Bus
0.50
0.64
0.79
0.87
0.90
0.47
0.60
0.66
0.75
0.74
0.15
0.32
0.44
0.61
0.72
0.12
0.10
0.12
0.40
0.47
0.11
0.12
0.28
0.43
0.28
0.08
0.15
0.16
0.27
0.28
0.34
0.50
0.72
0.58
0.44
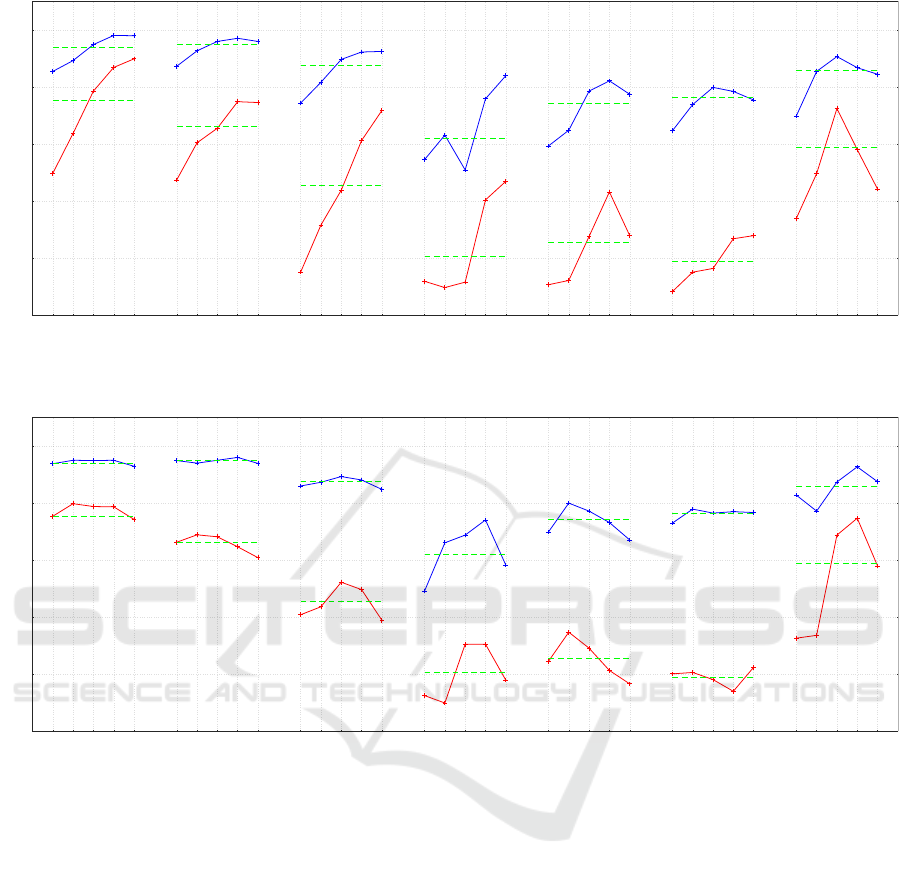
Figure 5: Per-Category Analysis of Object Size: Blue AP (’+’) for the lowest compression (CRF=29, Bitrate=2Mb/s). Red
AP (’+’) for the highest compression (CRF=47, Bitrate=1Mb/s). Green dashed lines indicate overall AP. Key: XS=extra-
small; S=small; M=medium; L=large; XL =extra-large.
XT T M W XW XT T M W XW XT T M W XW XT T M W XW XT T M W XW XT T M W XW XT T M W XW
0
0.2
0.4
0.6
0.8
1
Average Precision (AP)
0.94
0.95
0.95
0.95
0.93
Person
0.95
0.94
0.95
0.96
0.94
Car
0.86
0.87
0.89
0.88
0.85
Truck
0.49
0.66
0.69
0.74
0.58
Bicycle
0.70
0.80
0.77
0.73
0.67
Backpack
0.73
0.78
0.76
0.77
0.77
Handbag
0.83
0.77
0.87
0.93
0.87
Bus
0.75
0.80
0.79
0.79
0.74
0.66
0.69
0.68
0.65
0.61
0.41
0.44
0.52
0.50
0.39
0.12
0.10
0.30 0.30
0.18
0.24
0.35
0.29
0.21
0.17
0.20
0.21
0.18
0.14
0.22
0.33
0.34
0.69
0.75
0.58
Figure 6: Per-Category Analysis of Aspect Ratio: Blue AP (’+’) for the lowest compression (CRF=29, Bitrate=2Mb/s). Red
AP (’+’) for the highest compression (CRF=47, Bitrate=1Mb/s). Green dashed lines indicate overall AP. Key: XT=extra-tall;
T=tall; M=medium; W=wide; XW =extra-wide.
arn the following about the truck detector: prefer me-
dium to extra-large trucks at both compression levels
(the top 70th percentile in area). The performance
for very small trucks is poor due to higher compres-
sion as mAP drops by 59% from 0.74 at (CRF=29,
Bitrate=2Mb/s) to 0.15 at (CRF=47, Bitrate=1Mb/s).
This can be due to block-artifacts that are introdu-
ced to a pixel block during block transform coding
to achieve lossy compression, which results in blurry,
low-resolution blocks. These blocks might hide ma-
jor parts of small objects, which make them difficult
to be detected. We can learn similar things about the
other categories. For example, YOLO works best for
large people and cars. The difficulty with extra-large
objects may initially surprise, but they are usually
highly truncated or have unusual viewpoints. Note
that YOLO seems to vary in similar ways at both com-
pression levels, indicating that its sensitivity may be
due to some objects being intrinsically more difficult
to recognize like handbags and backpacks.
In Figure 6, we show a per-category analysis of
aspect ratio. YOLO is less sensitive to aspect ratio at
both compression levels and tends to recognize better
objects at their more natural properties. For example,
the backpack detector tends to prefer taller backpacks
than wide ones as expected.
5 DISCUSSION AND
CONCLUSION
Our results show that of the CNN-based object de-
tectors tested, all are susceptible to compression arti-
facts. This is an interesting result because it shows
that the reduced performance under quality distor-
VISAPP 2019 - 14th International Conference on Computer Vision Theory and Applications
102

tions is not limited to a particular network, but is
common to the considered detectors. These state-
of-the-art models trained on high-quality image data-
sets make unreliable predictions when they encounter
compression artifacts in their inputs due to an inabi-
lity to generalize from their sharp training sets. To
create object detectors that are more robust to these
degradations, new designs may need to be introdu-
ced. One obvious solution to this problem is to fine-
tune/train these detectors on images with artifacts,
which may boost their performance when applied on
video frames, but perhaps this may decrease their per-
formance on high-quality images. An investigation of
the benefits of fine-tunning with video frames is left
for future work.
Our analysis provides guidance for developing
machine vision systems in practical, non-idealized,
applications where quality distortions may be present.
We expect our findings to be relevant in make decisi-
ons on video compression in the design of automated
video surveillance systems.
ACKNOWLEDGEMENTS
This work was performed in part through the finan-
cial assistance award, Multi-tiered Video Analytics
for Abnormality Detection and Alerting to Improve
Response Time for First Responder Communications
and Operations (Grant No. 60NANB17D178), from
U.S. All statements of fact, opinion or conclusions
contained herein are those of the authors and should
not be construed as representing the official views or
policies of the sponsors Department of Commerce,
National Institute of Standards and Technology.
REFERENCES
Dai, J., Li, Y., He, K., and Sun, J. (2016). R-fcn: Object de-
tection via region-based fully convolutional networks.
In Neural Information Processing Systems (NIPS).
Dodge, S. and Karam, L. (2016). Understanding how image
quality affects deep neural networks. arXiv preprint
arXiv:1604.04004.
Donahue, J., Hendricks, L. A., Guadarrama, S., Rohrbach,
M., Venugopalan, S., Saenko, K., and Darrell, T.
(2015). Long-term recurrent convolutional networks
for visual recognition and description. In CVPR.
Everingham, M., Eslami, S. M. A., Gool, L. V., Williams, C.
K. I., Winn, J., and Zisserman, A. (2015). The pascal
visual object classes challenge: A retrospective. In-
ternational Journal of Computer Vision, 111:98136.
Everingham, M., Gool, L. V., Williams, C. K. I., Winn,
J., and Zisserman, A. (2010). The pascal visual ob-
ject classes (voc) challenge. International Journal of
Computer Vision, 88:303–338.
Girshick, R. (2015). Fast r-cnn. In International Conference
on Computer Vision (ICCV).
Goodfellow, I. J., Shlens, J., and Szegedy, C. (2015). Ex-
plaining and harnessing adversarial examples. In In-
ternational Conference on Learning Representations
(ICLR).
He, K., Gkioxari, G., Dollar, P., and Girshick, R. (2017).
Mask r-cnn. In International Conference on Computer
Vision (ICCV).
He, K., Zhang, X., Ren, S., and Sun, J. (2015). Deep re-
sidual learning for image recognition. arXiv preprint
arXiv:1512.03385.
Hoiem, D., Chodpathumwan, Y., and Dai, Q. (2012). Diag-
nosing error in object detectors. In European Confe-
rence on Computer Vision (ECCV).
Juurlink, B., Alvarez-Mesa, M., Chi, C. C., Azevedo, A.,
Meenderinck, C., and Ramirez, A. (2012). Under-
standing the application: An overview of the h.264
standard. Scalable Parallel Programming Applied to
H.264/AVC Decoding, pages 5–15.
Karahan, S., Yldrm, M. K., Krtac, K., Rende, F. S., Butun,
G., and Ekenel, H. K. (2016). How image degrada-
tions affect deep cnn-based face recognition? arXiv
preprint arXiv:1608.05246.
Karam, L. J. and Zhu, T. (2015). Quality labeled faces in the
wild (qlfw): a database for studying face recognition
in real-world environments. In International Society
for Optics and Photonics, volume 9394.
Krizhevsky, A., Sutskever, I., and Hinton, G. E. (2012).
Imagenet classification with deep convolutional neu-
ral networks. In Advances in neural information pro-
cessing systems, pages 1097–1105.
Lin, T.-Y., Dollar, P., Girshick, R., He, K., Hariharan, B.,
and Belongie, S. (2017a). Feature pyramid networks
for object detection. In CVPR.
Lin, T.-Y., Goyal, P., Girshick, R., He, K., and Dollar, P.
(2017b). Focal loss for dense object detection. In
International Conference on Computer Vision (ICCV).
Lin, T.-Y., Maire, M., Belongie, S., Hays, J., Perona, P.,
Ramanan, D., Dollar, P., and Zitnick, C. L. (2014).
Microsoft coco: Common objects in context. In Euro-
pean Conference on Computer Vision (ECCV), pages
740–755.
Liu, W., Anguelov, D., Erhan, D., Szegedy, C., Reed, S., Fu,
C.-Y., and Berg, A. C. (2016). Ssd: Single shot mul-
tibox detector. In European Conference on Computer
Vision (ECCV).
Redmon, J. and Farhadi, A. (2018). Yolov3: An incremental
improvement. arXiv preprint arXiv:1804.02767.
Ren, S., He, K., Girshick, R., and Sun, J. (2015). Faster
r-cnn: Towards real-time object detection with region
proposal networks. In Neural Information Processing
Systems (NIPS).
Szegedy, C., Zaremba, W., Sutskever, I., Bruna, J., Erhan,
D., Goodfellow, I., and Fergus, R. (2014). Intriguing
properties of neural networks. In CVPR.
Understanding How Video Quality Affects Object Detection Algorithms
103

Vasiljevic, I., Chakrabarti, A., and Shakhnarovich, G.
(2016). Examining the impact of blur on recog-
nition by convolutional networks. arXiv preprint
arXiv:1611.05760.
Wiegand, T., Sullivan, G. J., Bjntegaard, G., , and Luthra,
A. (2003). Overview of the h.264/avc video coding
standard. IEEE Transactions on Circuits and Systems
for Video Technology, 13:560–576.
Zhou, Y., Song, S., and Cheung, N.-M. (2017). On clas-
sification of distorted images with deep convolutional
neural networks. arXiv preprint arXiv:1701.01924.
VISAPP 2019 - 14th International Conference on Computer Vision Theory and Applications
104
