
A MapReduce-like Deep Learning Model
for the Depth Estimation of Periodontal Pockets
Yusuke Moriyama
1
, Chonho Lee
2
, Susumu Date
2
, Yoichiro Kashiwagi
3
, Yuki Narukawa
3
,
Kazunori Nozaki
4
and Shinya Murakami
3
1
Graduate School of Information Science and Technology, Osaka University, Osaka, Japan
2
Cybermedia Center, Osaka University, Osaka, Japan
3
Graduate School of Dentistry, Osaka University, Osaka, Japan
4
Osaka University Dental Hospital, Osaka, Japan
{yoichiro, y narukawa, ipshinya}@dent.osaka-u.ac.jp, knozaki@dent.osaka-u.ac.jp
Keywords:
Periodontal Disease, Periodontal Pocket, Convolutional Neural Networks, Deep Learning, Object Detection.
Abstract:
This paper explores the feasibility of diagnostic imaging using a deep learning-based model, applicable to
periodontal disease, especially periodontal pocket screening. Having investigated conventional approaches,
we find two difficulties to estimate the pocket depth of teeth from oral images. One is the feature extraction of
Region of Interest (ROI), which is pocket region, caused by the small ROI, and another is tooth identification
caused by the high heterogeneity of teeth (e.g., in size, shape, and color). We propose a MapReduce-like
periodontal pocket depth estimation model that overcomes the difficulties. Specifically, a set of MapTasks
is executed in parallel, each of which only focuses on one of the multiple views (e.g., front, left, right, etc.)
of oral images and runs an object detection model to extract the high-resolution pocket region images. After
a classifier estimates pocket depth from the extracted images, ReduceTasks aggregate the pocket depth with
respect to each pocket. Experimental results show that the proposed model effectively works to achieve the
estimation accuracy to 76.5 percent. Besides, we verify the practical feasibility of the proposed model with
91.7 percent accuracy under the condition that a screening test judges severe periodontitis (6 mm or more).
1 INTRODUCTION
Deep learning algorithms such as convolutional neu-
ral networks (CNN) (LeCun et al., 2015), have
rapidly become a promising methodology for diag-
nostic imaging. This methodology can be used to au-
tomatically diagnose the presence of tuberculosis in
chest radiographs (Ting et al., 2018), to detect mac-
ular degeneration from fundus images (Burlina et al.,
2017), and to locate malignant melanoma in skin im-
ages (Esteva et al., 2017).
Such diagnostic imaging is also important in the
field of dentistry due to increasing demands on den-
tal health care. Periodontal disease is one of the most
pervasive infections in the world and reported 80 per-
cent adults are infected with. It is mainly caused of
tooth loss by the chronic periodontal inflammation
resulting in the destruction of tooth support tissues.
Moreover, it has recently become apparent that the
disease may be one of the risk factors of diabetes and
stroke (Khader et al., 2006)(Wu et al., 2000). The dis-
ease progresses chronically over a number of years, so
usually, patients have no clear symptom until patho-
logical severe condition resulting in loosening or loss
of teeth. To notice the disease in its early stages that
the patients have rare subjective symptoms is effec-
tive for preventing the progression. An application
that people easily self-check the risk of severity with-
out imparting burdens enhances patient participation
in dental consultations.
This paper explores the feasibility of diagnostic
imaging applicable to periodontal disease. Specifi-
cally, we design a deep learning model to estimate
the depth of periodontal pockets that dentists gener-
ally measures with a probe to examine the severity of
periodontal disease.
In order to efficiently extract and study the disease
conditions from the image, we focused on two data
features, hierarchy and regression, observed in oral
images. Hierarchy means that teeth are numbered 1
to 8 in the up and down, left and right, and there are
388
Moriyama, Y., Lee, C., Date, S., Kashiwagi, Y., Narukawa, Y., Nozaki, K. and Murakami, S.
A MapReduce-like Deep Learning Model for the Depth Estimation of Periodontal Pockets.
DOI: 10.5220/0007405703880395
In Proceedings of the 12th International Joint Conference on Biomedical Engineering Systems and Technologies (BIOSTEC 2019), pages 388-395
ISBN: 978-989-758-353-7
Copyright
c
2019 by SCITEPRESS – Science and Technology Publications, Lda. All rights reserved
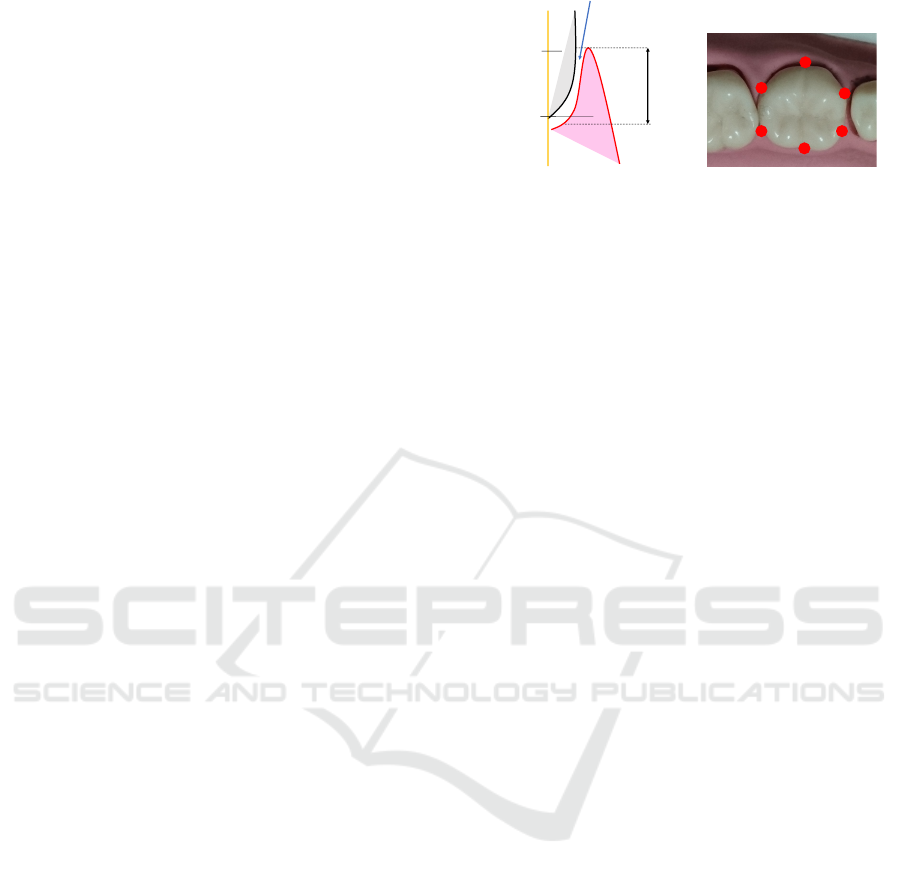
6 measuring points in each tooth. Regression means
that the 6 measurement points represent the state of
the tooth, 1 to 8 teeth indicate the state of the jaw, and
the four regions (upper left, upper right, downer left
and downer right) represent the oral cavity.
Due to the complex features of the data observed
in oral images, the required accuracy can not be ob-
tained by merely using the image recognition algo-
rithm. In fact, as a preliminary investigation, we have
trained a conventional CNN model on oral images.
However, the estimation accuracy was around 44 per-
cent. There is a need to implement a model to learn
the periodontal disease condition consisting of two
features collectively.
Besides, we looked at two difficulties leading to
such low accuracy; a difficulty in the Region of In-
terest (ROI) extraction caused by small pocket region
images, and a difficulty in tooth identification caused
by a high heterogeneity among teeth.
Based on the lessons learned from our prelim-
inary investigation, we propose a MapReduce-like
deep learning model that automatically assesses the
severity of periodontal disease from oral images. It
is a computational framework for data structures hav-
ing the aforementioned features, and it overcomes the
two difficulties. Specifically, the proposed model ex-
tracts pocket region images following tooth identifi-
cation, processed in parallel with respect to each mul-
tiple view of oral images, and then estimates pocket
depth from the extracted pocket region images.
This paper is structured as follows. Section 2 pro-
vides the prior knowledge on periodontal disease for
further discussion later. Section 3 shows the pre-
liminary results when applying a conventional CNN
model, and then clarifies the two difficulties we tackle
to improve the estimation accuracy. Section 4 de-
scribes the proposed MapReduce-like deep learning
model. Section 5 shows the evaluation results to
verify the effect of the proposed model. Section 6
presents related work and discusses future work.
2 PRIOR KNOWLEDGE ON
PERIODONTAL DISEASE
Periodontal disease or Pyorrhea is a chronic inflam-
mation affecting the gums surrounding the teeth. In
its early stage called Gingivitis, the gums become
swollen and may bleed. In an advanced stage of gin-
givitis called Periodontitis, the teeth can become de-
tached from the gums and loosen.
Generally and traditionally, dentists examine the
severity of periodontal disease by measuring the
depth of periodontal pockets for all teeth using a
P1
P2
P3
P4
P5
P6
Lingual
Buccal
Figure 1: Illustration of periodontal pocket measurement
(left) and 6 point measuring point (right).
probe (Figure 1-left). The measured depth is recorded
in millimeters as a pocket chart. Under a common 6-
point method, dentists measure six pockets: the distal
buccal (P1), central buccal (P2), medial buccal (P3),
medial lingual (P4), central lingual (P5), and distal
lingual (P6) (Yoshie et al., 2013), as illustrated in Fig-
ure 1-right. In this paper, P1∼P6 are called pocket
numbers and the gum region surrounding the pockets
is called the pocket region.
In this paper, we define tooth number with three
letters, for example, as in UL1 and DR8. The first
letter is U or D for upper and downer, the second letter
is L or R for left and right from the patient’s view, and
the third letter indicates the number from the median,
respectively. For example, if the tooth number is UL1,
UL1 represents the first tooth from the median in the
upper left of the patient.
3 PRELIMINARY
INVESTIGATION
To investigate the feasibility of applying deep learn-
ing techniques into the pocket depth estimation, we
trained a conventional CNN model, called VGG-
16 (Simonyan and Zisserman, 2014) with a set of oral
images from 1333 patients acquired at the Osaka Uni-
versity Dental Hospital. The trained model estimates
the depth of 12 pockets, which is the buccal side of 4
upper front teeth. Using 80 percent of the oral images
as training, and 20 percent as the test, we observed
the estimation accuracy of approximately 44 percent
according to precision in millimeters.
In order to improve the accuracy, we have found
ways to overcome the two difficulties in Region of
Interest (ROI) feature extraction and tooth identifica-
tion, which led to such low accuracy.
Difficulty in ROI Feature Extraction: The first
problem is a small ROI in the oral image. According
to dentists, the correlation between different pockets
is weak even for the same teeth. So, for estimating
a pocket depth, we better focus on the corresponding
A MapReduce-like Deep Learning Model for the Depth Estimation of Periodontal Pockets
389
pocket region. However, each pocket region is small
in an oral image, and the “noise” unrelated to the esti-
mation is large. Examples of the noise include teeth,
lips, and other pocket regions. In addition, due to the
high computational cost and large memory size, the
input image size of the CNN model is limited in gen-
eral. The size of the original oral image used in this
study is large (e.g. 1600 × 1200 and 2080 × 1560),
so it is necessary to reduce the image size to adjust
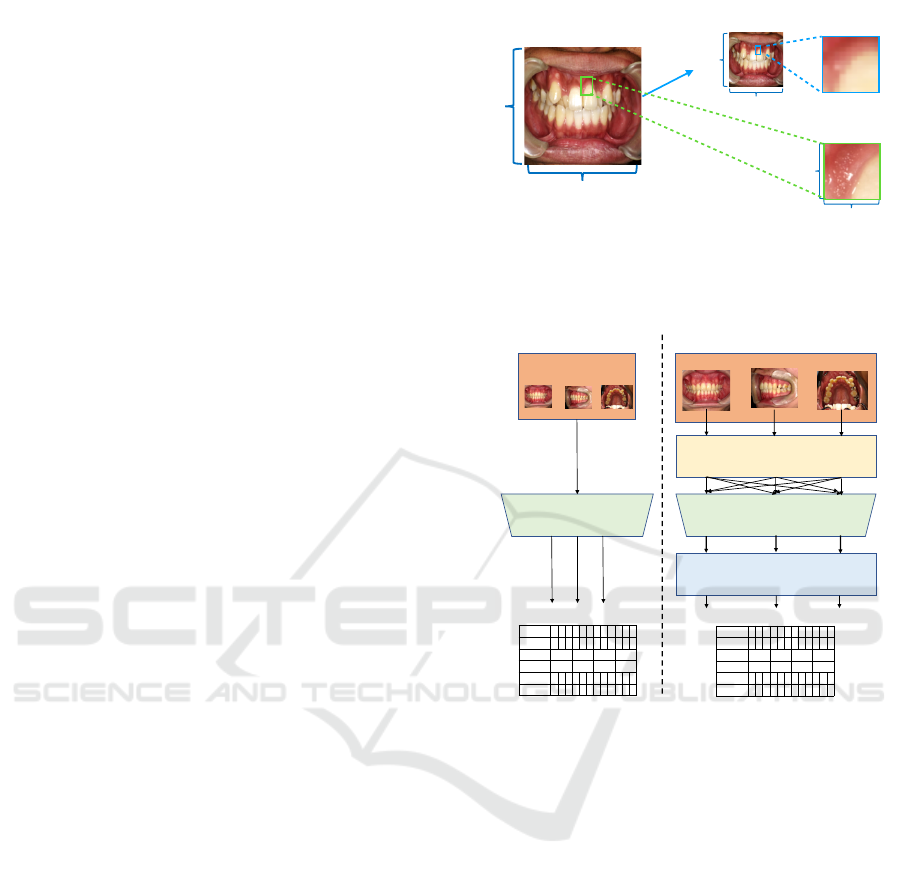
to the size of model input. Therefore, as illustrated in
Figure 2, if the entire oral image is the model input,
the image resolution of ROI becomes lower than that
of ROI in the original image.
Difficulty in Tooth Identification: The second
problem is tooth heterogeneity. We focus on a pocket
region to estimate a pocket depth, so we need to iden-
tify the corresponding teeth to extract the pocket re-
gion images. The training dataset contains a set of
oral images taken from different directions for each
of the patients. Depending on the direction, tooth fea-
tures such as color, size and shape vary in those im-
ages even for the same teeth. In the case of general
objects such as dog, cat, etc., that have large feature
differences, the direction is not a problem. However,
in the case of teeth, since the features are inherently
similar, it becomes difficult to identify the teeth.
4 DESCRIPTION OF THE
PROPOSED MODEL
This section describes the proposed MapReduce-like
periodontal pocket depth estimation model together
with the design principles. Figure 3 illustrates the
overview flow of the proposed model, where CNN
pre-processing and post-processing are added. To
overcome the first difficulty in ROI feature extraction,
we extract high resolution pocket region images, pro-
vided to CNN. To overcome the second difficulty in
tooth identification, we parallelize the pocket region
extraction. The details of the process are explained in
the following subsections.
4.1 Design Principles
First, we consider the extraction of pocket region im-
ages. To extract the pocket region images, we fur-
ther need to identify tooth numbers which represent
tooth location and pocket numbers, which represent
the pocket location of the teeth. In order to identify
the tooth numbers, we perform tooth detection first.
A few methods exist for the detection of teeth,
such as image processing, segmentation, and object
!
!
Figure 2: Quality of pocket region image (i.e., ROI). Note
that we consider the CNN accepts a size of 128 ×128 input.
The resolution of ROI input to the CNN is lower than that
of ROI in the original image, and the information is lost.
Figure 3: Overview flow of the pocket depth estimation.
detection. In image processing, teeth can be detected,
but it is difficult to classify tooth numbers. This is
because the tooth numbers must be identified accord-
ing to the coordinates of the detected teeth. How-
ever, image processing does not work when the align-
ment of the teeth is bad or the teeth are missing. The
segmentation approach also is not suitable because
when specifying tooth coordinates, this approach re-
quires a contour acquisition process after pixel classi-
fication, which increases labor and processing time.
For these reasons, we use object detection, named
YOLOv2 (Redmon and Farhadi, 2017), which makes
it possible to identify tooth numbers and acquire the
coordinate of teeth. By obtaining teeth coordinates,
we can extract sub-images of the pocket regions from
the oral images based on the teeth coordinates.
Secondly, we parallelize the pocket region extrac-
tion process on the per-viewpoint of oral images. In
other words, each pocket region extraction process
uses oral images with one of the multiple viewpoints.
This way of processing eliminates the necessity of
learning tooth features in multiple directions with one
HEALTHINF 2019 - 12th International Conference on Health Informatics
390
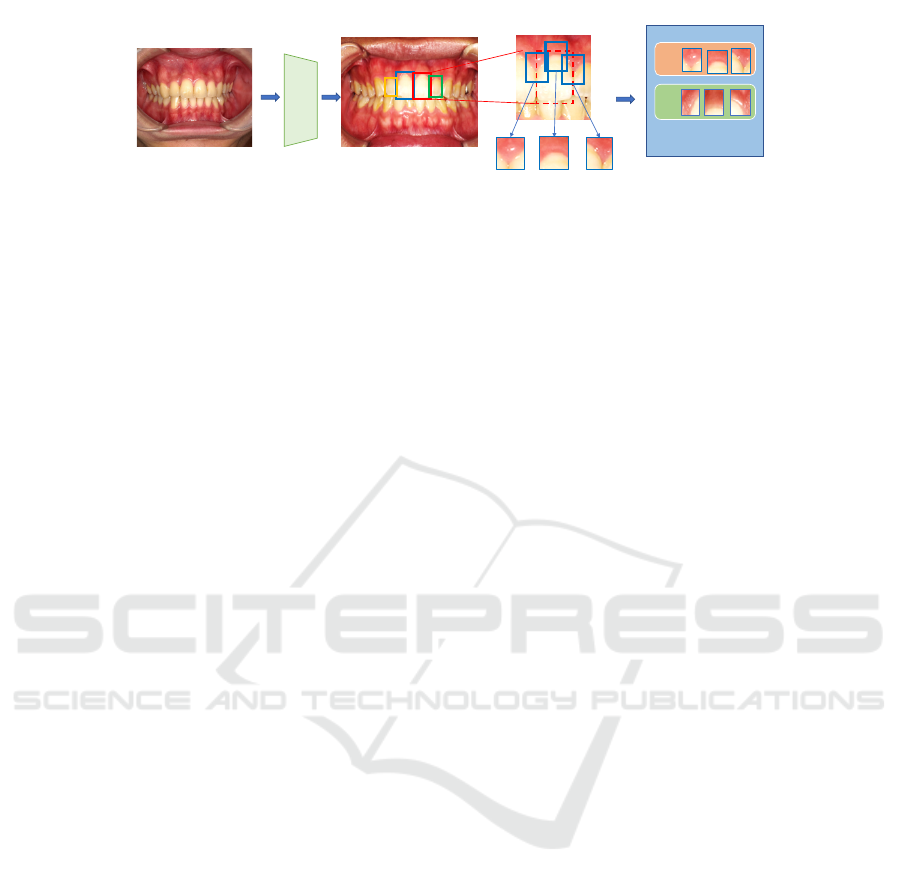
Figure 4: Pocket region extraction process (MapTask).
YOLOv2, and limits the range of tooth numbers. For
example, in the oral image taken from the left direc-
tion, the right teeth are not included, so the classifica-
tion can be limited to only the left teeth. As a result,
we can reduce the misclassification of tooth numbers,
which leads to an improvement in accuracy.
4.2 Design of the Proposed Model
In this subsection, we describe the proposed
MapReduce-like periodontal pocket depth estimation
model. The proposed model is divided mainly into
three parts: the Mapping phase, the CNN phase,
and the Reducing phase. The Mapping phase identi-
fies tooth numbers and extracts pocket region images
from oral images. The CNN phase estimates pocket
depth from the pocket region images. The Reducing
phase aggregates the estimated depth with respect to
each identical pocket.
Mapping Phase: In this phase, a set of MapTasks
that recognize teeth and extract pocket region images
from oral images, is executed in parallel. Figure 4
shows our proposed pocket region extraction process
that addresses the difficulty in ROI feature extrac-
tion. The process basically uses YOLOv2, known as
a model capable of high-precision, high-speed object
detection, to obtain the high resolution pocket region
images.
YOLOv2 learns the features of each tooth so that
it can detect the teeth and identify the tooth number,
as illustrated in the red dotted box of Figure 4. Since
three pocket regions exist at even intervals as shown
in Figure 1-right, each of the detected tooth images
is equally divided into three so as to correspond to
those three pockets. Then, discarding the lower part
of the tooth and including the gum, we can obtain the
rectangular sub-images of pocket regions, which are
a high resolution of large ROI images.
However, it is difficult for YOLOv2 to identify
teeth with the same number (i.e., similar teeth such as
upper front teeth, UL1 and UR1) because YOLOv2
recognizes objects by looking at features of size,
color, and shape, but not its location. Therefore, in
the case of the front view of the image, we compare
the x-coordinate of the center of the detected rectan-
gular to classify teeth into the left and right.
Each MapTask deals with one of the multiple
viewpoints of oral images. Before parallelization, all
oral images are input to the same MapTask. In the
proposed method, the oral images are sorted in ad-
vance for each shooting direction and entered into
the corresponding MapTask. Each MapTask extracts
pocket region and passes them to the CNN phase.
CNN Phase: In this phase, the CNN classifier esti-
mates pocket depth from the pocket region images.
We use VGG-16 (Simonyan and Zisserman, 2014)
pretrained by ImageNet. The CNN classifier takes
an input image with the size of 128 × 128 and out-
puts one pocket depth with probability as the estima-
tion confidence. Specifically, pocket region images
extracted in the previous phase are sorted and grouped
by tooth number and pocket number, as identical
pocket region images. A group of identical pocket
region images is input one by one to CNN classifier
and outputs the group of estimated pocket depth.
Reducing Phase: In this phase, a set of ReduceTasks
aggregates the estimated depth. Each ReduceTask
handles one of the groups of pocket depth. There are
a few ways to aggregate the pocket depth estimates
with confidence. For example, the final pocket value
is given as one pocket depth estimate with the highest
confidence, or the weighted sum of the pocket depth
estimate and confidence. In this paper, the former
method is adopted. Figure 5 shows the detailed de-
sign of the proposed model.
5 EVALUATION
This section first explains the experimental environ-
ment and verifies the effects of the proposed model in
terms of the estimation accuracy of pocket depth by
comparing with that of a conventional CNN model.
Dataset: We use a dataset of 2625 oral images ob-
tained from 1333 patients visiting at Osaka Univer-
A MapReduce-like Deep Learning Model for the Depth Estimation of Periodontal Pockets
391
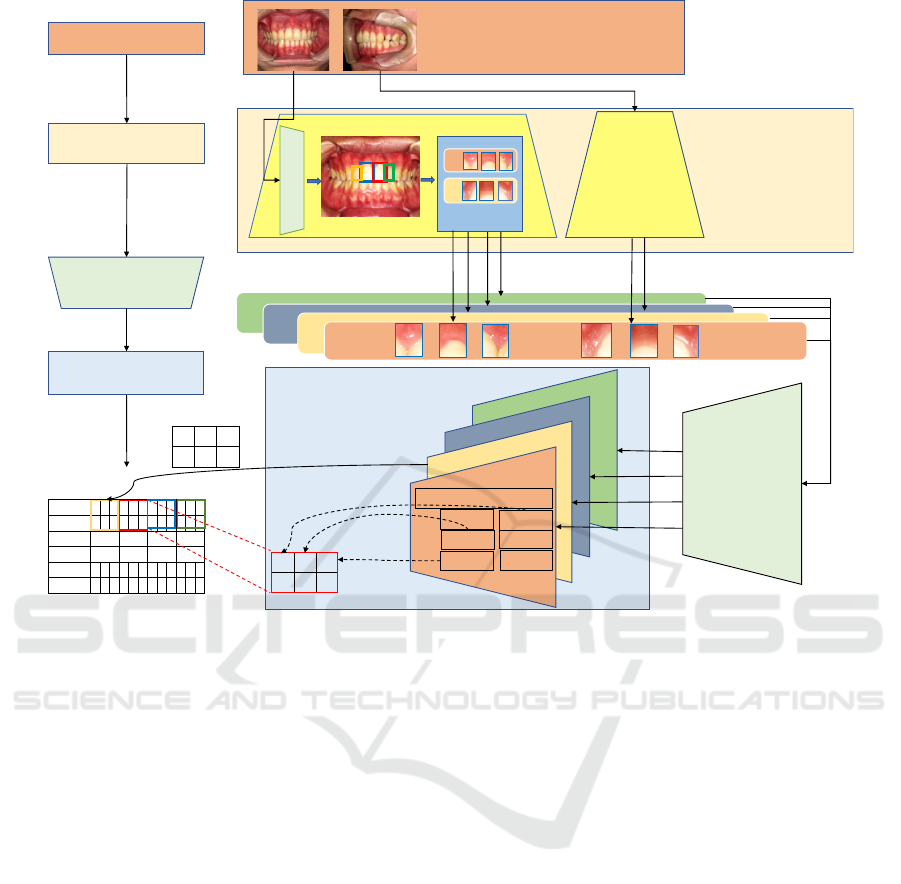
Figure 5: Design of the proposed model.
sity Dental Hospital. The images include ones taken
from front and left directions. Data labels are the
pocket depth of the teeth, which are measured by a
few trained physicians. In this work, we focus on 12
pockets such as P1, P2, and P3 of teeth UL1, UL2,
UR1 and UR2. The 80 percent of the data is used for
training, and the remaining 20 percent is used for test.
Experimental Setting: The proposed model uses a
CNN model, VGG-16, in its Reducing phase. The
input image size is set to 128 × 128. To confirm fea-
sibility according to usage, we change the number of
classes of CNN based on pocket depth. We conduct
three experiments as follows.
• E1: Screening by 2 stages, e.g., “Healthy” (3 mm
or less) and “Unhealthy” (4 mm or more).
• E2: Severity measurement by 3 stages, e.g.,
“Healthy” (3 mm or less), “Moderate periodon-
titis” (4 or 5 mm), and “ Severe periodontitis”
(6 mm or more).
• E3: Depth estimation by 15 stages, i.e., pocket
depth in millimeters between 1 mm and 15 mm.
In each experiment, we compare the proposed
model with a single CNN model that outputs the esti-
mates of 12 pocket depth at once. In order to perform
multi-label classification, we parallelize final fully-
connected layer of CNN. For example, in the case
of Screening, the CNN has a 24 neurons (2 stages ×
12 pockets) at final layer. For the evaluation metrics,
we compute the classification accuracy, and mean-
squared error (MSE) of the distance between the true
pocket depth and the estimates.
5.1 Experimental Result
Table 2 shows the comparison result. It shows that
the proposed model outperforms a single CNN model
in the classification accuracy with an improvement of
1.2 percent at E1, 2.6 percent at E2, and 3.0 percent at
E3, respectively. The accuracy improvement slightly
increases as the number of classes increases. This in-
dicates that the effect of the proposed MapReduce-
like parallel processing becomes bigger against more
complicated tasks.
In order to verify the effect, we conduct two
additional experiments. The first experiment is to
check how the image resolution of ROI (i.e., the
pocket region image) affects accuracy, as shown in
Figure 2. The second experiment is to check how
the MapReduce-like task parallelization contributes
to the improvement of accuracy.
HEALTHINF 2019 - 12th International Conference on Health Informatics
392
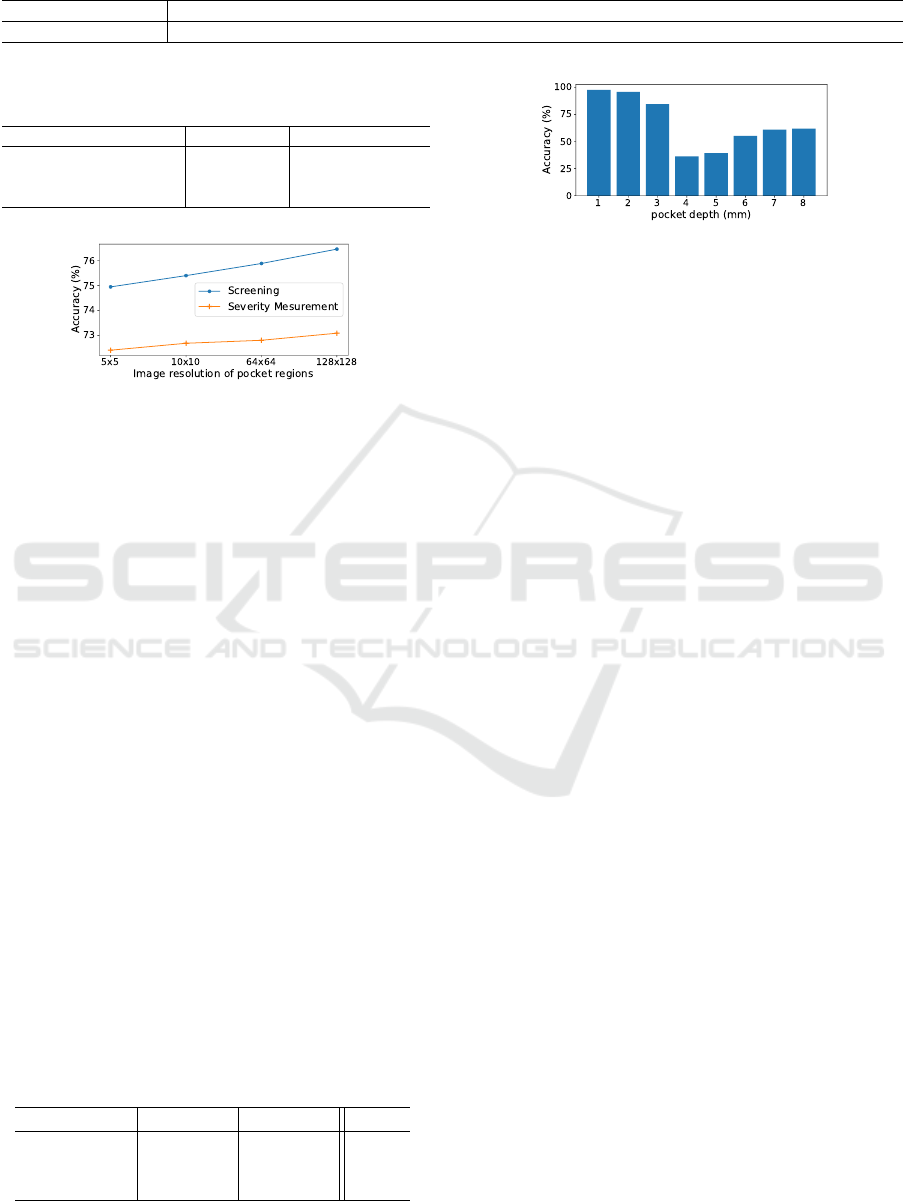
Table 1: Pocket depth distribution of dataset consisting of 1333 patients, 2625 oral images and 15312 pocket regions. Note
that the toothless part and the pocket without measurement data are deleted from the dataset.
Depth (mm) 1 2 3 4 5 6 7 8 9 10 11 12 13 14 15
The number of data 343 4702 6010 1442 504 654 218 101 104 35 34 4 1 1 0
Table 2: Accuracy (%) of pocket depth estimation using a
single CNN and the proposed model (MSE (mm)).
Experiment CNN Proposed model
Screening 75.3 (0.25) 76.5 (0.21)
Severity measurement 70.5 (0.61) 73.1 (0.52)
Depth estimation 44.0 (2.20) 47.0 (2.14)
Figure 6: Accuracy over different image resolution of ROI.
5.1.1 Effect of Pocket Region Extraction
Different from a single CNN that learns oral images,
the proposed model performs pocket region extraction
and learns the pocket region images with less noise.
In this experiment, we change the resolution of im-
ages to be input to CNN. Specifically, pocket region
images of 64×64, 10 ×10, and 5×5 are used, respec-
tively. This indicates that the images are magnified to
128 × 128, the input size of CNN.
Figure 6 shows the accuracy over different quali-
ties of the pocket region images in the case of E1 and
E2. As expected, the accuracy improves as the im-
age resolution increases. This implies that the pocket
region extraction contributes to improving the clas-
sification accuracy by focusing on a pocket region,
which has a ROI with a higher resolution compared
to the ROI in the oral image.
5.1.2 Effect of MapTask Parallelization
Different from a single CNN that learns both front and
left views of oral images at once, the proposed model
parallelizes tooth identification tasks, each of which
deals only one-view image. In this experiment, the
average precision (AP) of YOLOv2 is compared over
Table 3: Per-class average precision(%) and mean average
precision(%) of YOLOv2. Note that UL1 and UR1 are rep-
resented as U1, and UL2 and UR2 are represented as U2.
View AP of U1 AP of U2 mAP
Front 92.8 88.9 90.9
Left 79.0 77.6 78.3
Front + Left 62.6 62.3 62.5
Figure 7: Accuracy over different pocket depth at E1.
different sets of oral images that contain a front view,
left view, or both front and left views.
Table 3 shows the per-class AP and its mean
(mAP). When the model uses both the front and left
view images at once, the mAP decreases by more
than 15 percent, compared with the case inputting one
view image independently. Therefore, the MapTask
parallelization is very effective.
Finally, we would like to discuss the low accuracy
at Depth estimation (E3). The dramatic drop in accu-
racy could be caused by the unbiased dataset. The
dataset includes a different number of oral images
with different pocket depths, as shown in Table 1.
It seems that the model was not trained well for the
classes with large pocket depth because of the insuffi-
cient number of training data. To further improve the
accuracy, we definitely need more data, i.e., oral im-
ages especially from patients with severe periodontal
disease. Also, it would be beneficial to use other in-
dices in addition to pocket depth such as the presence
or absence of bleeding and blood sugar level to learn
the relationship between oral images and the severity
of periodontal disease.
5.2 Towards Practical Use
Although we verify the effect of pocket region ex-
traction and parallelization, we need to further im-
prove the estimation accuracy towards the practical
periodontal screening. In this subsection, we show
the result of an additional experiment to investigate
the practical feasibility of periodontal screening with
the proposed model.
Figure 7 shows the accuracy over different pocket
depth at E1. As you can see, the accuracy of 4 and
5 mm is relatively lower than the others. We found
that the pockets with 4 or 5 mm depth are wrongly
classified as the pocket with 3 mm depth. In fact, it
is also hard for dentists to judge the pockets with 4
or 5 mm depth (i.e., moderate periodontitis) from the
A MapReduce-like Deep Learning Model for the Depth Estimation of Periodontal Pockets
393
images, which do not have much visual difference.
We doubt that pocket region images with ambiguous
labels might be included in training dataset.
Thus, we consider ignoring the data (i.e., pocket
region images) of 3, 4 and 5 mm pocket depth and see
if the proposed model can be used for the screening of
severe periodontitis, which differentiates “Healthy”
(2 mm) from “Severe periodontitis” (6 mm or more).
We named the experiment as E1
0
. If the pocket depth
is more than 6 mm, the use of a surgical approach is
likely to be necessary(Greenstein, 1997). Therefore,
finding severe periodontitis is very important. Addi-
tionally, we ask a dentist to select data that he can
distinguish whether it is severe in order to completely
eliminate label ambiguity. That is, we perform E1
0
on
two different dataset as follows.
• E1
0
-a: A dataset of the pocket region images ex-
tracted by the Mapping phase of the proposed
model (Healthy: 10449 images, Severe periodon-
titis: 2537 images).
• E1
0
-b: A dataset of the pocket region images the
dentist selected from E1
0
-a dataset (Healthy: 1479
images, Severe periodontitis: 809 images).
Table 4 is the confusion matrix of E1
0
-a and E1
0
-
b. From the results of E1
0
-a, the accuracy is 87.4 per-
cent, true positive rate (TPR) is 93.3 percent, and false
positive rate (FPR) is 29.7 percent. The accuracy im-
proves compared to E1 case (76.5 percent), but FPR
is so high that the model cannot be used for screen-
ing. From the results of E1
0
-b, the accuracy is 91.7
percent, TPR is 93.2 percent, and FPR is 6.8 percent.
Compared to E1
0
-a model, the E1
0
-b model reduces
FPR by approximately 20 percent.
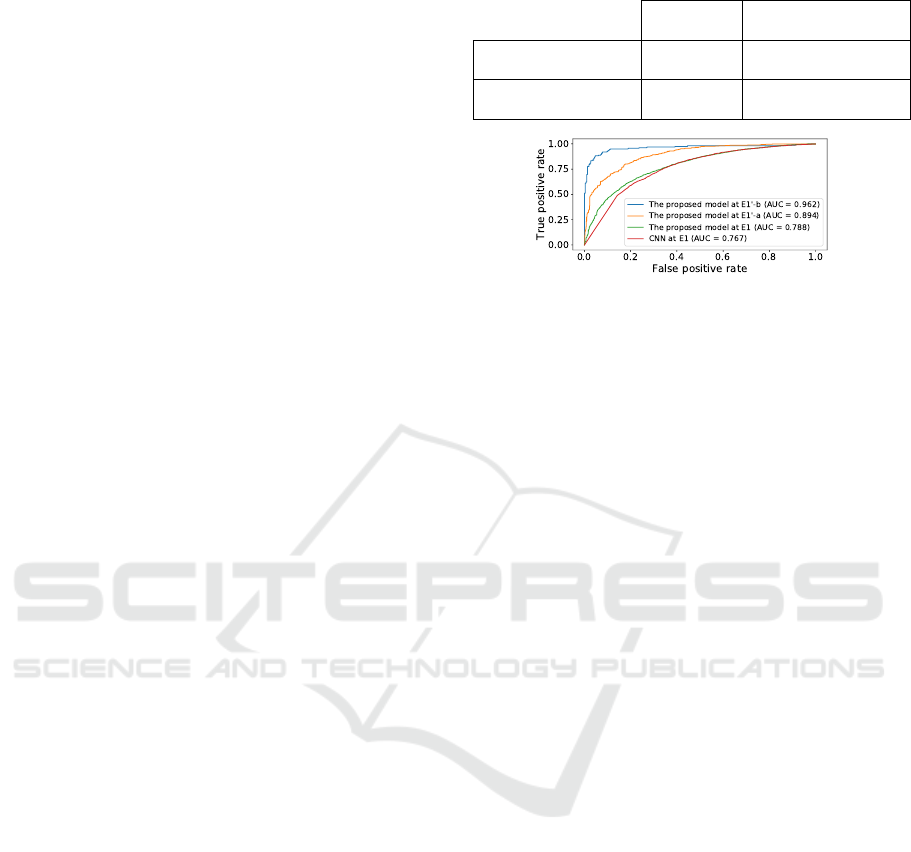
Figure 8 compares ROC curves of E1 and E1
0
.
From Figure 8, the area under the ROC curve (AUC)
at E1
0
-a is 0.917 and the AUC at E1
0
-b is 0.962, which
is approximately 0.2 larger than the AUC at E1. This
implies that the E1
0
makes less miss the case with high
periodontal severity.
Through the experiments, we realize that there is
not a strong relationship between pocket depth and the
visual appearance of the pocket; especially the pock-
ets with 4 mm or 5 mm depth (i.e., moderate periodon-
titis). However, the proposed model can judge severe
periodontitis from pocket region images at over 91.7
percent accuracy with 6.8 percent FPR. As the results,
we show the feasibility of screening for finding pa-
tients with severe periodontal disease. This will en-
courage people to do self-check at home and to see a
doctor at right timing.
Table 4: Confusion matrix (E1
0
-a / E1
0
-b).
Actual
Healthy
Actual
Severe periodontitis
Predicted
Healthy
1806 / 206 201 / 18
Predicted
Severe periodontitis
128 / 20 476 / 144
Figure 8: Comparison of ROC curves. Note that the thresh-
old of the ROC curve uses the score for the Healthy class
which is the output of CNN.
6 RELATED WORK AND
FUTURE WORK
Related Work: Deep learning has been applied in
various fields. One of the advantages in using deep
learning is the ability to automatically extract effec-
tive and domain-specific features for tasks.
Deep learning has been applied in medical
fields (Litjens et al., 2017) as well. Various mod-
els based on convolutional neural networks (CNN)
have been proposed, which detect diabetic retinopa-
thy from retinal fundus photographs (Gulshan et al.,
2016), breast cancer in an mammography (Becker
et al., 2017), and brain lesion segmentation in
MRIs (Kamnitsas et al., 2017). Different from that
type of research, our model parallelizes classification
tasks, each of which only focuses on the correspond-
ing ROI with less noise.
In the dental field, there are many studies related
to the classification of dental diseases from X-ray
images (Prajapati et al., 2017) and of dental plaque
from quantitative light-induced fluorescence (QLF)
images (Imangaliyev et al., 2016); however, few stud-
ies focuses on oral images. To the best of our knowl-
edge, this study is the first study to investigate the re-
lationship between oral images and pocket depth us-
ing deep learning.
Future Work: To further improve the estimation
accuracy, the following work will be conducted.
First, we need to investigate the pocket regions
around all teeth in addition to just the upper front teeth
(e.g., UL1 and UR1). Different teeth and their pocket
regions might have unique features that are different
from those of the upper front teeth. As shown in Sec-
tion 5.2.2, when we consider various teeth and more
HEALTHINF 2019 - 12th International Conference on Health Informatics
394

images with multiple views, the effect of the proposed
MapReduce like processing becomes much bigger.
Secondly, the proposed model mainly utilizes two
trained models, YOLOv2 for tooth detection and
CNN for pocket depth estimation. These models are
independently trained on different set of images. We
will try to design an end-to-end model by changing
the current model’s layer composition. This end-to-
end model should be able to simultaneously train the
model instantaneously.
Thirdly, in addition to the oral images, additional
information such as X-ray images and blood test re-
sults should contribute to improving the estimation
accuracy. We will work on designing a model that
can handle a multimodal dataset.
7 CONCLUSION
In this paper, we proposed a MapReduce-like pocket
depth estimation model which performed paral-
lel pocket region extraction processing and multi-
directional information aggregation in a Mapping
phase and Reducing phase, respectively. Through the
experiments, we realize that there is not a strong rela-
tionship between pocket depth and the visual appear-
ance of the pocket. So, it is difficult to judge moder-
ate periodontitis with only oral images. However, we
show the feasibility of screening for finding patients
with severe periodontal disease. The proposed model
can be used for self-check at home as a tool with the
same quality of vision as the dentists.
ACKNOWLEDGMENT
We would like to thank Osaka University Dental Hos-
pital, for setting up the environment for our research
and the medical dataset for the experiments. This
work was supported by Social Smart Dental Hospi-
tal, a collaborative project between Osaka University
and NEC Corp.
REFERENCES
Becker, A. S., Marcon, M., Ghafoor, S., Wurnig, M. C.,
Frauenfelder, T., and Boss, A. (2017). Deep learning
in mammography: diagnostic accuracy of a multipur-
pose image analysis software in the detection of breast
cancer. Investigative radiology, 52(7):434–440.
Burlina, P. M., Joshi, N., Pekala, M., Pacheco, K. D., Fre-
und, D. E., and Bressler, N. M. (2017). Automated
grading of age-related macular degeneration from
color fundus images using deep convolutional neural
networks. JAMA ophthalmology, 135(11):1170–1176.
Esteva, A., Kuprel, B., Novoa, R. A., Ko, J., Swetter, S. M.,
Blau, H. M., and Thrun, S. (2017). Dermatologist-
level classification of skin cancer with deep neural net-
works. Nature, 542(7639):115.
Greenstein, G. (1997). Contemporary interpretation of
probing depth assessments: Diagnostic and therapeu-
tic implications. a literature review. Journal of Peri-
odontology, 68(12):1194–1205.
Gulshan, V., Peng, L., Coram, M., Stumpe, M. C., Wu,
D., Narayanaswamy, A., Venugopalan, S., Widner, K.,
Madams, T., Cuadros, J., et al. (2016). Development
and validation of a deep learning algorithm for de-
tection of diabetic retinopathy in retinal fundus pho-
tographs. JAMA, 316(22):2402–2410.
Imangaliyev, S., van der Veen, M. H., Volgenant, C. M.,
Keijser, B. J., Crielaard, W., and Levin, E. (2016).
Deep learning for classification of dental plaque im-
ages. In International Workshop on Machine Learn-
ing, Optimization and Big Data, pages 407–410.
Springer.
Kamnitsas, K., Ledig, C., Newcombe, V. F., Simpson,
J. P., Kane, A. D., Menon, D. K., Rueckert, D., and
Glocker, B. (2017). Efficient multi-scale 3d cnn with
fully connected crf for accurate brain lesion segmen-
tation. Medical image analysis, 36:61–78.
Khader, Y. S., Dauod, A. S., El-Qaderi, S. S., Alkafajei, A.,
and Batayha, W. Q. (2006). Periodontal status of di-
abetics compared with nondiabetics: a meta-analysis.
Journal of diabetes and its complications, 20(1):59–
68.
LeCun, Y., Bengio, Y., and Hinton, G. (2015). Deep learn-
ing. nature, 521(7553):436.
Litjens, G., Kooi, T., Bejnordi, B. E., Setio, A. A. A.,
Ciompi, F., Ghafoorian, M., van der Laak, J. A., van
Ginneken, B., and S
´
anchez, C. I. (2017). A survey
on deep learning in medical image analysis. Medical
image analysis, 42:60–88.
Prajapati, S., Nagaraj, R., and Mitra, S. (2017). Classifica-
tion of dental diseases u sing cnn and transfer learning.
In Proceedings of the 5th International Symposium on
Computational and Business Intelligence (ISCBI).
Redmon, J. and Farhadi, A. (2017). YOLO9000: Better,
faster, stronger. In Proceedings of the 30th IEEE Con-
ference on Computer Vision and Pattern Recognition,
pages 6517–6525.
Simonyan, K. and Zisserman, A. (2014). Very deep con-
volutional networks for large-scale image recognition.
arXiv preprint arXiv:1409.1556.
Ting, D. S., Yi, P. H., and Hui, F. (2018). Clinical applica-
bility of deep learning system in detecting tuberculo-
sis with chest radiography. Radiology, 286(2):729.
Wu, T., Trevisan, M., Genco, R. J., Dorn, J. P., Falkner,
K. L., and Sempos, C. T. (2000). Periodontal dis-
ease and risk of cerebrovascular disease: the first na-
tional health and nutrition examination survey and
its follow-up study. Archives of Internal Medicine,
160(18):2749–2755.
Yoshie, H., Itou, K., Murakami, S., and Shin, K. (2013).
Clinical periodontal disease. Ishiyaku Publishing, 2
edition.
A MapReduce-like Deep Learning Model for the Depth Estimation of Periodontal Pockets
395
