
Simulation Studies for Non Invasive Classification of Ischemic and
Hemorrhagic Stroke using Near Infrared Spectroscopy
Dalchand Ahirwar
1
, Kshitij Shakya
1
, Aihik Banerjee
2
, Dheeraj Khurana
3
and
Shubhajit Roy Chowdhury
1
1
Biomedical Systems Laboratory, Multimedia Analytics and Systems Group,
School of Computing and Electrical Engineering, Indian Institute of Technology, Mandi, India
2
Department of Biotechnology, Heritage Institute of Technology, Kolkata, India
3
Department of Neurology, Post Graduate Institute of Medical Education and Research, Chandigarh, India
Keywords: Ischemic Stroke, Hemorrhagic Stroke, Mid-cerebral Artery, Cerebral Oxygenation Level, Near Infrared
Spectroscopy.
Abstract: This paper presents an approach to identify and classify the type of stroke, viz ischemic and hemorrhagic
conditions. Ischemic stroke is caused by the blood clot and plaque present in the blood vessel. Hemorrhagic
stroke, on the other hand, occurs when a rupture happens in the cerebrovascular artery or mid-cerebral artery
causing impairments in blood flow and hence the supply of oxygen to the cerebral tissues. The current research
analyses the blood flow velocity, the pressure profile of blood clot and plaque, and the condition at which
ischemic and hemorrhagic stroke occurs. Simulation studies show the pressure on the blood vessel walls under
ischemic and hemorrhagic stroke conditions and also that under nominal blood flow velocity the hemorrhage
does not occur, but when the velocity is sufficient enough to increase the pressure on the wall, rupture of the
mid-cerebral artery takes place. The simulation assumes the blood flow to be laminar, non-Newtonian,
viscous, incompressible, and the arterial wall as elastic. Using the simulation model, an approach to
classifying ischemic and hemorrhagic stroke using near infrared spectroscopy has been proposed in the paper.
1 INTRODUCTION
Stroke is one of the leading causes of mortality and
disability worldwide. It is devastating not only for the
survivors but also for the caregivers. Globally, the
incidence rate of stroke is not only high but also
continuously increasing due to the ageing population
and intense social pressure. The Indian stroke scenario
is no less grim with a comparatively higher rate of
incidence and prevalence owing to poor control of risk
factors and a lack of public awareness (Pandian JD et
al., 2013).
Stroke-related mortality and morbidity in India are
higher than they should have been mainly due to the
unavailability and the unaffordability of quality stroke
management facilities in many parts of the country,
especially in the rural areas (Kamalakannan S et al.,
2017). Also, speed is of the utmost essence in ensuring
the favorable clinical outcome of stroke patients. This
necessitates rapid stroke diagnosis modalities
(Banerjee TK and Das SK, 2016). Stroke can be
broadly classified into two major categories: ischemic
stroke, with around 85- 87 % incidence rate, and
hemorrhagic stroke, with around 13-15 % incidence
rate (Donnan GA et al., 2008).
Ischemic cerebrovascular accident results from a
lack of sufficient blood flow to the brain due to the
formation of a clot, whereby the brain is unable to
meet its metabolic demands (Radic B, 2017). The
consequent deprivation of oxygen and nutrient supply
to the brain leads to the death of brain tissues, thereby
rendering parts of the brain non-functional or poorly
functional (Radic B, 2017).
Hemorrhagic cerebrovascular accident occurs due
to a ruptured cerebral blood vessel and the resultant
bleeding into the head, whereby the brain is damaged
by the impairments in blood flow due to rupture of
blood vessel, which is basically bleeding outside of the
brain tissue, precisely between the arachnoid mater
and pia mater, into the cerebrospinal fluid containing
sulci, fissures, and cisterns. Although significantly
less common compared to the ischemic stroke,
hemorrhagic stroke is associated with a much higher
rate of morbidity and mortality (Salonen JT and
192
Ahirwar, D., Shakya, K., Banerjee, A., Khurana, D. and Chowdhury, S.
Simulation Studies for Non Invasive Classification of Ischemic and Hemorrhagic Stroke using Near Infrared Spectroscopy.
DOI: 10.5220/0007413201920198
In Proceedings of the 12th International Joint Conference on Biomedical Engineering Systems and Technologies (BIOSTEC 2019), pages 192-198
ISBN: 978-989-758-353-7
Copyright
c
2019 by SCITEPRESS – Science and Technology Publications, Lda. All rights reserved

Salonen R, 1991).
The current research attempts to explore the mid-
cerebral artery, with an objective of finding out the
condition for ischemic and hemorrhagic stroke. An
approach to classifying ischemic and hemorrhagic
stroke using cerebral oxygenation level based on near
infrared spectroscopy (NIRS) has been presented. The
paper is organized into the following sections. Section
II describes the simulation model for mid-cerebral
artery, where an ischemic or hemorrhagic stroke is
likely to occur. Section III presents the modeling of
blood flow through the artery. Section IV presents
results and discussion. Section V presents the
classification of ischemic and hemorrhagic stroke
using NIRS.
2 MODELLING OF MIDDLE
CEREBRAL ARTERY
The current work involves simulation studies of the
mid-cerebral artery which form the key parameter
needed to classify between ischemic and hemorrhagic
stroke. The geometry consists of a cylindrically
shaped structure of 6mm radius and 50 mm length
which has been considered to model the artery. To
design an initial blood clot, a sphere of 3 mm radius
has been embedded on the upper wall of the artery. To
model the blood flow through the cylinder, the artery
was assumed to have a 3D laminar flow and to study
the effect of blood flow on the wall, solid mechanics
accompanied by a stationary study has been used.
This model contains three domains and two
primitive points. One domain forms the cylinder
containing walls of the artery, second forms the space
where blood flows, and third for the blood clot. Two
points are arbitrarily constructed to measure pressure
on the inner walls of the artery.
Material properties used for simulations are shown in
Table I (Garje et al., 2015). The flow under laminar
regime was modelled with the no-slip boundary
condition, and the blood flow velocity has been
assumed with a nominal value of 0.169 m/s.
For the simulation, a hollow cylinder has been
assumed, which can be viewed as blood vessel, the
space inside the cylinder is modelled as the channel
for blood flow, and a spherical shape as a blood clot
embedded on the inner side of the cylinder. The initial
radius of the sphere was 3 mm and was incremented
to increase the range of blockage.
The thickness of artery has been taken as 1 mm with 7
mm radius and 50 mm length. The inlet blood flow
velocity has been taken as 0.169 m/s throughout the
Table 1: Material properties used for simulation.
Properties
Blood
Artery
Blood
clot
Density
(Kg/m
3
)
1060
1060
1080
Dynamic
viscosity (Pa-
s)
0.005
-
-
Poisson’s ratio
-
0.49
0.3
Young’s
Modulus (Pa)
-
2x10
6
6.9x10
3
simulation.
A finite element mesh has been created for the
described geometry with free tetrahedral and fluid
dynamic physics for the blood flow channel, and free
tetrahedral and general physics for the remaining
geometry with number of vertex elements being 25,
number of edge elements being 708, number of
boundary elements being 12704 and number of
elements being 96586.
3 MODELLING THE FLOW OF
BLOOD THROUGH THE
ARTERY
Let us consider an elastic cylinder as a part of the
artery in which a non-Newtonian fluid is flowing and
following the power-law (J. Mazumdar, 1992).
The flow rate Q will be given by
(1)
Where
, 0<n<1
a1 and a2 are the radii which vary corresponding to
the pressure exerted at these points.
Simulation Studies for Non Invasive Classification of Ischemic and Hemorrhagic Stroke using Near Infrared Spectroscopy
193
Despite the obstruction in the path of blood flow, the
heart works more to maintain the flow rate, hence
(2)
From equation 1 and 2,
(3)
Where Δp
1
and Δp
2
correspond to the change in g(a
1
)
and g(a
2
), hence it can be concluded that change in
radius of the artery corresponds to the pressure
change across the artery.
To obtain the cerebral oxygenation level of blood, we
focus on the Modified Beer Lamberts law which
determines the change in optical density against the
absorption of near infrared radiation in blood. The
equation for optical density is given by
(4)
=
+ e
b
(λ)
e
b
(λ)
(5)
Where e
F
and
are the extinction coefficient and
change in chromophore concentration for
chromophores other than oxygenated haemoglobin,
respectively. And
and
are the extinction
coefficient and change in chromophore concentration
for the oxygenated haemoglobin, respectively.
Thus equation 5 gives the change in chromophore
concentration of oxygenated hemoglobin which is
responsible for the cerebral oxygenation in blood.
Thus
will be directly proportional to Q, the
volumetric flow rate.
4 SIMULATION RESULTS AND
DISCUSSION
4.1 Simulation Results of Modeling of
Blood Clot Formation in
Mid-cerebral Artery
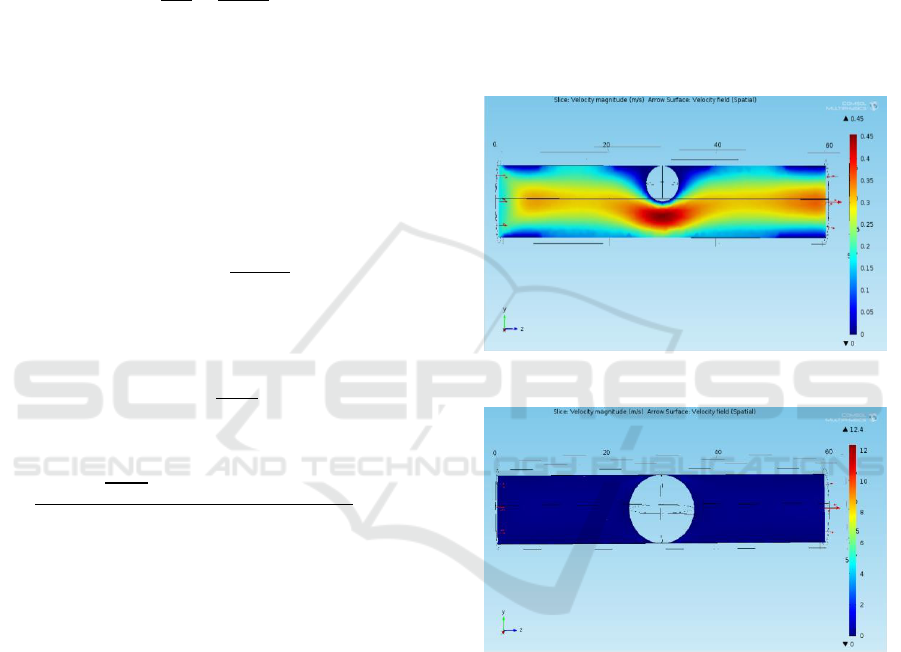
The artery with initial blood clot of 3 mm radius is
shown in Figure 1 with its velocity profile. The results
are noted for increasing radius of the blood clot in the
order of 0.5 mm, and finally, the blood clot of 6 mm
which completely blocks the artery as shown in
Figure 2.
Figure 1: Velocity profile with blood clot of 3mm radius.
Figure 2: Velocity profile of 6mm radius blood clot.
Figure 3 and 4 show the profile of pressure caused by
the blood clot when kept at 3 mm radius and 6 mm
radius, respectively. Figure 5 also shows the condition
at which ischemia occurs.
The pressure profile at the side walls of the artery
is monitored next. Starting from the radius of 3 mm
blood clot up to 5.5 mm, the pressure at just above and
below the blood clot is shown in Table II. Its
corresponding graph is shown in Figure 5.
BIODEVICES 2019 - 12th International Conference on Biomedical Electronics and Devices
194
Figure 3: Pressure profile of blood clot at 3 mm radius.
Figure 4: Pressure profile of blood clot at 6 mm radius.
Table 2: Pressure at upper and lower walls of artery.
Radius (mm)
Pressure at
Point 1 (Pa)
Pressure at
Point 2 (Pa)
3
6.507
6.812
3.5
7.903
7.781
4
10.855
10.910
4.5
16.400
17.711
5
43.388
41.600
5.5
216.090
231.570
Figure 5 and 6 show the expected increase in pressure
as the blood clot increases till 5.5 mm. These graphs
show that after 91% blockage by the blood clot, the
pressure reaches to 216.09 Pa. However, after 100%
blockage, that is, at the ischemic condition, the
pressure at upper and lower points suddenly rise to
1.37 MPa and 1.39 MPa, respectively.
At this ischemic condition, the blood flow velocity
has been increased to observe the pressure increment
on the upper and lower walls of the artery and is
shown in Table 3 and plotted in Figure 7.
Figure 5: Pressure at upper point of artery wall.
Figure 6: Pressure at lower point of artery wall.
Table 3: Pressure versus velocity at ischemic condition.
Blood flow velocity
(m/s)
Pressure at upper wall
(MPa)
0.169 (nominal)
1.37
0.18
1.46
0.20
1.62
0.22
1.86
0.24
1.92
0.25
2.005
Table III and Figure 7 show that from nominal blood
flow velocity of 0.169 m/s, it takes 0.25 m/s to exceed
the wall pressure of 2 MPa, which is the elastic limit
of the artery.
Simulation Studies for Non Invasive Classification of Ischemic and Hemorrhagic Stroke using Near Infrared Spectroscopy
195
Figure 7: Pressure vs Velocity profile at ischemic condition.
4.2 Simulation of Change in Stiffness of
Blood Vessel Due to Fat
Accumulation on the Arterial Wall
The change in elasticity on the part of the blood vessel
(ring) as a consequence of the accumulation of fat on
the inner side of the arterial wall has been studied.
The Young’s modulus of the blood vessel and the fat
material have been considered as arranged in parallel,
and hence the net Young’s modulus of the
combination is greater than the ordinary blood vessel,
i.e., 2x10
6
N/m
2
. The displacement of the ring portion
and the stress on that portion has been measured.
Table 4: Relation between blood velocity and stress at two
different young’s modulus.
Blood Velocity
(m/s)
Stress on
Ring when
Y=2 MPa
Stress on
Ring when
Y=11 MPa
0.16
363.12
520.38
0.18
433.17
620.62
0.20
508.91
728.97
0.22
589.97
844.94
0.24
675.51
967.33
Table 5: Relation between blood velocity and displacement
at two different young’s modulus.
Blood
Velocity
(m/s)
Displacement
of Ring at
Y=2MPa
(10
-4
mm)
Displacement
of Ring at
Y=11MPa
(10
-4
mm)
0.16
1.11
0.71
0.18
1.32
0.84
0.20
1.56
1.0
0.22
1.81
1.16
0.24
2.08
1.33
Figure 8: Change in stress due to varying elasticity.
Figure 9: Change in displacement due to varying elasticity.
The relation between the blood flow velocity and the
stress for two different Young’s Modulus, one for
pure artery and one including a fat layer in parallel
has been shown in table IV and plotted in Figure 8.
The same for varying displacements has been shown
in Table V and Figure 9.
4.3 Simulation Results of Modeling of
Hemorrhagic Stroke Condition
The leading cause of hemorrhagic stroke includes
hypertension, fat layer deposit, and weakening of
blood vessel due to an abnormality in its formation. To
design a condition for hemorrhage, the same artery has
been taken, and a part of it is assumed to weaken due
to the reasons mentioned above. Also assuming a
turbulent flow sufficient enough to rupture the weak
part of the artery has been modeled in Figure 10, and
BIODEVICES 2019 - 12th International Conference on Biomedical Electronics and Devices
196
its rupture under the hemorrhagic condition is shown
in Figure 11.
Figure 10: Healthy artery with a weak point.
Figure 11: Hemorrhagic condition: Rupture at a weak point.
Figure 10 shows the blood flowing through the artery
when no hemorrhage happens. The velocity of blood
and the pressure inside the artery are measured as
0.24 m/s and 4.29 Pa, respectively. Figure 11,
however, shows the hemorrhagic condition where the
artery has been ruptured at that particular weak point.
The velocity and the pressure, in this case, are
measured to be as 0.22 m/s and 4.07 Pa, respectively.
This change in pressure and velocity is the
consequence of leakage of blood from the ruptured
portion. This decrease aids in lowering of cerebral
oxygenation level discussed later.
5 CLASSIFICATION OF
ISCHEMIC AND
HEMORRHAGIC STROKE
USING NIRS SIMULATION
Using Helmholtz equations option in COMSOL
Multiphysics, a point light source has been created in
the same previous model just above the artery with
properties shown in Table VI so that its absorption and
reflectance can be measured.
Figure 12 shows the modeling of near infrared
radiation source positioned above the artery which is
used for transmitting NIR radiation into the artery.
Table 6: Optical properties of artery.
Diffusion coefficient (D)
3.17 × 10
-4
Absorption Coefficient
(1/m)
50
Boundary Impedance
0.182
Figure 12: Location of light source just above the artery.
Figure 13: Pattern of penetration of light into the artery.
The pattern of the radiation distribution is shown in
Figure 13, which is intense at the point source and
gradual decreases in the regions away from the point
source.
In order to see the relation between the varying size of
the blockage and the boundary flux which is a direct
measure of absorbance, the spherical blockage has
been varied, and the boundary flux has been measured
against every value.
The 6mm radius of blockage shows the ischemic
condition, against which the values of boundary flux
have been measured as shown in Table VII and Figure
14.
The above graph shows the absorption value decay as
the blockage increases up to the ischemic condition.
The absorption in the case of the healthy artery is
measured approximately as 20, and in the case of
hemorrhage, it is measured approximately as 18.
Simulation Studies for Non Invasive Classification of Ischemic and Hemorrhagic Stroke using Near Infrared Spectroscopy
197
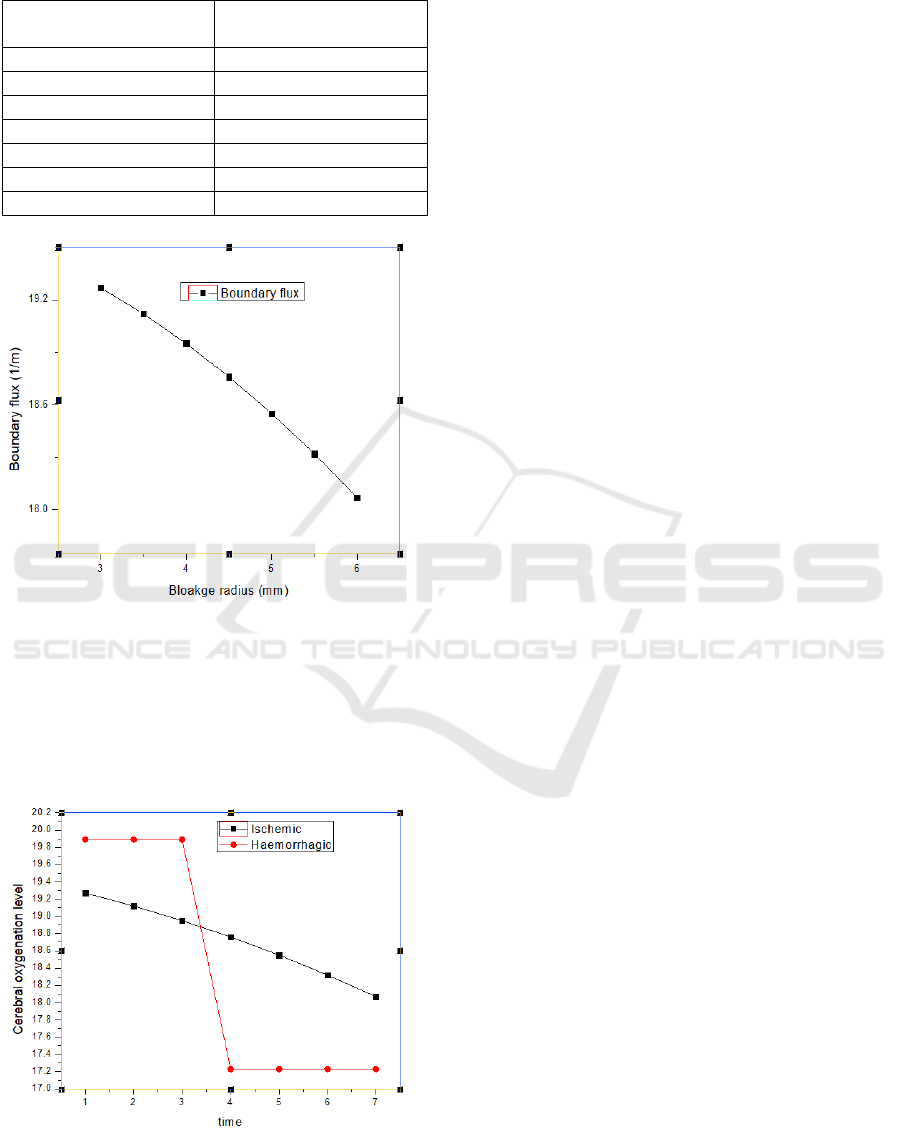
Table 7: Relation between boundary flux and blockage
radius.
Radius of blockage
(mm)
Boundary flux (1/m)
3
19.27
3.5
19.12
4
18.95
4.5
18.76
5
18.55
5.5
18.32
6
18.07
Figure 14: Graph showing boundary flux versus blockage
radius.
Considering the proportionality of volumetric flow
and absorption in the previous sections for both
ischemic and hemorrhagic conditions, the cerebral
oxygenation level is plotted against time as shown in
Figure 15.
Figure 15: Change in cerebral oxygenation level for the
ischemic and hemorrhagic condition.
Figure 15 shows the change in cerebral oxygenation
level, which is considered proportional to the
absorption in table VII, which has been plotted
against time, here time is considered proportional to
the continuous increase of the plaque formation in the
artery.
6 CONCLUSION
In this paper, an approach of classification of
ischemic and hemorrhagic strokes, based on near
infrared spectroscopy, has been studied. The blood
flow velocity and the pressure profile in the artery
containing blood clot and plaque have been plotted.
The blood flow velocity for which hemorrhage occurs
is found to be 0.22 m/s. The change in stiffness of the
affected part of an artery due to plaque accumulation
has also been discussed. Displacement and stress
values against varying blood flow velocity have been
found to be greater in case of the artery with plaque
than the pure artery. The cerebral oxygenation level,
which is proportional to volumetric flow rate and near
infrared light absorption, has been found decaying
with the increasing size of blockage with time.
Further works are going on.
REFERENCES
Pandian JD, Sudhan P. Stroke, 2013. Epidemiology and stroke
Care Services in India. Journal of stroke.: 15(3):128-134.
Kamalakannan S, Gudlavalleti ASV, Gudalvalleti VSM,
Goenka S, Kuper H., 2017. Incidence and prevalence of
stroke in India: A systematic review. The Indian Journal of
Medical Research. 146(2):175-185.
Banerjee TK, Das SK., 2016.Fifty years of stroke Research in
India. Annals of Indian Academy of Neurology. 19 (1):1-
8.
Donnan GA, Fisher M, Macleod M, Davis SM. 2008.
“Stroke.” Lancet. 371(9624): 1612-23.
Radic B.,2017.Diagnosis and Treatment od Carotid Artery
Stenosis. J Neural Stroke 7(3): 00238.
Salonen JT, Salonen R., 1991.“Ultrasonographically assessed
Carotid morphology and the risk of coronary heart
disease.” Arterioscler Thromb 11:1245-49.
Mancini GB, Dahlof B, Diez J, 2004; “ Surrogate markers for
cardiovascular disease”: structural markers. Circulation
109: IV22-IV30.
A. Garje, Y.G. Adhav, D. Bodas, 2015.“ Design and
Simulationof Blocked Blood vessel of early detection of
heart disease” Proceedings of 2015 2
nd
International
Symposium on Physics and Technology of Sensors, Pune
India.
J. Mazumdar 1992, BiofluidMechanics, [Rever Edge] N.J:
World Scientific, Singapore.
BIODEVICES 2019 - 12th International Conference on Biomedical Electronics and Devices
198
