
Semantic Segmentation of Satellite Images using a Modified CNN with
Hard-Swish Activation Function
R. Avenash and P. Viswanath
Computer Science and Engineering, Indian Institute of Information Technology, Chittoor, Sri City, A.P., India
Keywords:
Semantic Segmentation, Activation Function, Remote Sensing Images, Convolutional Neural Networks.
Abstract:
Remote sensing is a key strategy used to obtain information related to the Earth’s resources and its usage
patterns. Semantic segmentation of a remotely sensed image in the spectral, spatial and temporal domain is
an important preprocessing step where different classes of objects like crops, water bodies, roads, buildings
are localized by a boundary. The paper proposes to use the Convolutional Neural Network (CNN) called
U-HardNet with a new and novel activation function called the Hard-Swish for segmenting remotely sensed
images. Along with the CNN, for a precise localization, the paper proposes to use IHS transformed images
with binary cross entropy loss minimization. Experiments are done with publicly available images provided
by DSTL (Defence Science and Technology Laboratory) for object recognition and a comparison is drawn
with some recent relevant techniques.
1 INTRODUCTION
The noteworthy increment of satellite imagery has gi-
ven an enhanced comprehension ability of the pla-
net. Object recognition in the aerial imagery is gai-
ning interest due to the recent advancements in com-
puter vision, especially with convolutional neural net-
works (CNNs) and deep learning. Recognition of va-
rious objects present in a satellite image, like buil-
ding structures, streets, vegetation, water-bodies (Pas-
cal Kaiser, 2017), generally require semantic segmen-
tation of the image as a preprocessing step. This has
many applications which includes, updating of maps,
environment monitoring, agricultural output estima-
tion, disaster estimation in case of calamities like eart-
hquakes, estimating the amount of change or change
patterns in water-bodies like lakes, rivers, and so on.
Image Segmentation can be defined as partitio-
ning images to multiple segments for identifying re-
levant information. Semantic segmentation, a subset
of image segmentation is the process of dividing and
classifying the image pixels into one of the predefined
classes. There may exist several schemes for partitio-
ning the same image based on the application at hand
(Chen L.C., 2015; Long J., 2015). The recent advan-
cement of deep learning techniques in Computer Vi-
sion uses CNN which promises higher performance
in supervised and unsupervised tasks as mentioned in
(Jia.Y, 2014). It has the ability to learn feature repre-
sentation based on the end task.
1.1 Related Work
There exist several schemes for semantic segmen-
tation like patch-based CNN (P Sermanet, 2013),
random forest classifier based that uses hand-crafted
features and in order to increase the classification
accuracy, a conditional random field (CRF) was used
to smooth the final pixel labels (S. Paisitkriangkrai,
2015). Other related approaches applied a pre-trained
CNNs and a sliding window approach to perform
a pixel classification in a remotely sensed image
(Ross Girshick, 2014; Michael Kampffmeyer, 2016).
1.2 Preface to Proposed Approach
In this paper, the work is similar to the method propo-
sed in (Le Q V, 2012; Russakovsky O, 2014) and the
main contribution of the proposal is to utilize a CNN
as a feature extractor with a new and novel function.
The fully connected layers are replaced with convolu-
tion ones in the suggested architecture to output spa-
tial maps instead of classification scores. This idea
is implemented in the CNN model called U-HardNet
with a new activation function called Hard-Swish. As
the number of parameters are reduced due to the re-
placement of fully connected layers with convolution
Avenash, R. and Viswanath, P.
Semantic Segmentation of Satellite Images using a Modified CNN with Hard-Swish Activation Function.
DOI: 10.5220/0007469604130420
In Proceedings of the 14th International Joint Conference on Computer Vision, Imaging and Computer Graphics Theory and Applications (VISIGRAPP 2019), pages 413-420
ISBN: 978-989-758-354-4
Copyright
c
2019 by SCITEPRESS – Science and Technology Publications, Lda. All rights reserved
413

layers, a faster training is achieved. The method al-
lows training the CNN in a end to end manner for the
segmentation of input images of arbitrary sizes.
The U-Net architecture as proposed in (Olaf Ron-
neberger, 2015) was previously used in biomedical
image segmentation. The newly modified U-net i.e.
U-HardNet architecture as presented in the Section 4
allows combining low-level feature maps of a satel-
lite image with a higher-level, leading to precise lo-
calization. A large number of feature channels in up-
sampling part of the U-HardNet, allows the usage of
context information in higher resolution layers. The
method is inexpensive for semantic segmentation due
to less number of parameters, since there are no fully
connected layers and demonstrates the applicability
of deep learning techniques for segmentation.
The paper is organized as follows. In section 2,
details regarding Multispectral images are explained
and section 3, highlights details about Data set pro-
vided by DSTL. Section 4 discusses, in detail, about
the proposed method for semantic segmentation in-
volving image fusion and the Hard-Swish activation
function. It also discusses the modified U-HardNet
for segmentation and its training process. Experimen-
tal studies are discussed in section 5. section 6 con-
cludes the paper where some future directions of the
research is also given.
2 MULTISPECTRAL BANDS
In satellite imagery there are two sorts of images:
• Multispectral Images: A multispectral image is
a collection of several monochrome images of the
same physical area with a defined scale but in al-
ternate spectral bands which is procured with a
different sensors.
• Panchromatic Images: A panchromatic image is
rendered in black and white which is obtained in
a wide visual wavelength.
Multispectral Band of the images enables to extract
important features which is used for recognition
of specific classes of object that is beyond human
vision. For instance, the near infrared wavelength is
typically used to isolate vegetation assortments and
conditions due to strong reflection in this range of
electromagnetic spectrum that vegetation provides.
Besides, the color depth of images is 11-bit and
14-bit instead of commonly used 8-bit. Viewing from
perspective of a neural network, increase in number
of bits is better because each pixel carries more in-
formation, which creates additional steps for proper
visualization.
Details of multispectral bands which are used for re-
cognition of specific classes of object in DSTL dataset
is discussed below.
• Coastal (400-452 nm): This band detects pro-
found blues and violets. It’s primary use is for
imaging shallow water, and tracking fine particles
like dust and smoke.
• Blue (448-510 nm): This band detects ordinary
blues and it provides details regarding increased
penetration of water bodies by identifying depths
of nearly 150 feet and is equipped for separating
soil and rock surfaces from vegetation.
• Green (518-586 nm): This band detects greens
and was used for isolating the vegetation from soil
by detecting the green reflectance crest of leaf sur-
faces. In this band, streets and highways of urban
regions have showed up as brighter tone compa-
red to forest and vegetation’s dull tone (Mnih V.,
2010).
• Yellow (590-630 nm): This band senses in the
solid chlorophyll absorption region and strong re-
flectance areas for identifying soils. It was used
for isolation of vegetation and soil. This band has
highlighted desolate grounds, urban zones, road
design in the urban territory and expressways.
• NIR (772-954 nm): This band measures the near
infrared. Data from this band is imperative for real
reflectance records, for example, Normalized Dif-
ference Vegetation Index (NDVI) (Jia.Y, 2014),
which allows to measure specific characteristics
like of vegetation more precisely.
• SWIR (1195-2365 nm): This band covers diverse
cuts of the shortwave infrared. They are especi-
ally helpful for differentiating wet earth from dry
earth.
3 DATA SET DESCRIPTION
Organization named Defence Science and Techno-
logy Laboratory (DSTL) provides the data in both
3-band and 16-band of 1km x 1km satellite ima-
gery. The traditional RGB natural color images
are obtained as 3-band images. The 16-band ima-
ges contain spectral information by catching more
extensive wavelength channels. MultiSpectral (400
1040nm) range and Short-Wave infrared (SWIR)
(1195 - 2365nm) range are used to obtain the multi-
band imagery.
VISAPP 2019 - 14th International Conference on Computer Vision Theory and Applications
414

(i) Imagery Details
Insights to the image dataset utilized as a part of trai-
ning and testing stage.
• Sensor : WorldView 3
• Wavebands :
1. Panchromatic: 450-800 nm
2. 8 Multispectral: (red, red edge, coastal, blue,
green, yellow, near-IR (Infrared)1 and near-
IR2) 400 nm - 1040 nm
3. 8 SWIR: 1195 nm - 2365 nm
• Dynamic Range
1. Multispectral and Panchromatic: 11-bits per
pixel
2. Short-Wave infrared (SWIR) : 14-bits per pixel
(ii) Object Types Details
Different objects occurs in satellite images like roads,
farms, buildings, vehicles, trees, water ways and so
forth. DSTL has labeled 10 distinct classes and its
description is shown in Table 1.
4 WORKING METHODOLOGY
OF THE PROPOSED METHOD
4.1 Remote Sensing Image Fusion
Image fusion undertakes the blending of multispectral
and panchromatic images and creates a single high
resolution multispectral image. Image Fusion of ae-
rial images includes transformation from Red-Green-
Blue (RGB) to Intensity-Hue-Saturation (IHS) . The
typical steps associated with the satellite image fusion
are as per the following:
1. The low resolution multispectral images are resi-
zed to an indistinguishable size from the panchro-
matic picture.
2. IHS components i.e. Intensity, Hue and Saturation
are obtained from transforming the R, G and B
bands of the multispectral image.
3. Histogram matching of the panchromatic image
with the intensity segment of multispectral images
as reference was used to modify the panchromatic
image with respect to the multispectral image.
4. The intensity component is replaced by the pan-
chromatic image and a high resolution multis-
pectral image is obtained by performing inverse
transformation.
Table 1: Object Class Description defined by DSTL for the
provided dataset.
Class Additional Description
Buildings large buildings, residential,non-residential
Structures man-made structures
Road Simple Roads
Track dirt/poor/cart tracks, trails/footpaths
Trees stand-alone trees, groups of trees
Crops cropland/contour ploughing, grain crops
Waterway Simple Waterpaths
Standing water Simple Accumulated water
Vehicle Large large vehicle (e.g. lorry, bus, truck)
Vehicle Small small vehicle (e.g. van, car), motorbike
Fused image serves as input tensor to the net-
work and details regarding it is discussed in subse-
quent sections. Requisite for IHS transfer in image
enhancement is that IHS framework mimics the hu-
man eye framework. It assists in conceiving color
and gives more control over the color enhancement
(Renuka M. Kulat, 2016). Transformation from RGB
scheme to IHS plot gives the adaptability to change
every part of the IHS framework independently wit-
hout affecting the other. Using this approach, data of
various sensors having distinctive spatial and spectral
resolution can be merged to enhance the information.
4.2 Hard-Swish as Activation Function
The selection of activation functions plays a major
role in the training and testing dynamics of a Neu-
ral Network. In this paper, Hard-Swish, a new and
novel activation which is closely related to activation
function Swish is introduced. It is defined as
Hard-Swish = 2 ∗ x ∗ HardSigmoid(βx) (1)
HardSigmoid = max(0, min(1, (x ∗ 0.2 + 0.5)) (2)
Hard-Swish = 2 ∗ x ∗ max(0, min(1, (βx ∗ 0.2 + 0.5))
(3)
where β, is either a trainable parameter or a constant.
As β → ∞, the hard-sigmoid component approaches
0-1, and Hard-Swish will act like the ReLU activation
function. This indicates that Hard-Swish interpola-
tes non-linearly between the Relu function and linear
function smoothly. Setting β, as a trainable parame-
ter can be used to control the degree of interpolation
in the model (Prajit Ramachandran, 2018). The pro-
perties of Hard-Swish are similar to Swish because
both are unbounded above and bounded below. It is
non-monotonic and the property of non-monotonicity
is exclusive to Swish and Hard-Swish.
The property of non-monotonicity favors its perfor-
mance in different datasets and the results are high-
lighted in experiments section of the page. It is faster
in computation compared to swish because it doesn’t
Semantic Segmentation of Satellite Images using a Modified CNN with Hard-Swish Activation Function
415
involve any exponential calculation. It can be difficult
to determine why it performs better than other activa-
tion functions given the presence of a lot of compoun-
ding factors. However, it is believed that particular
shape of the curve in negative part improves perfor-
mance as they can output small negative numbers.
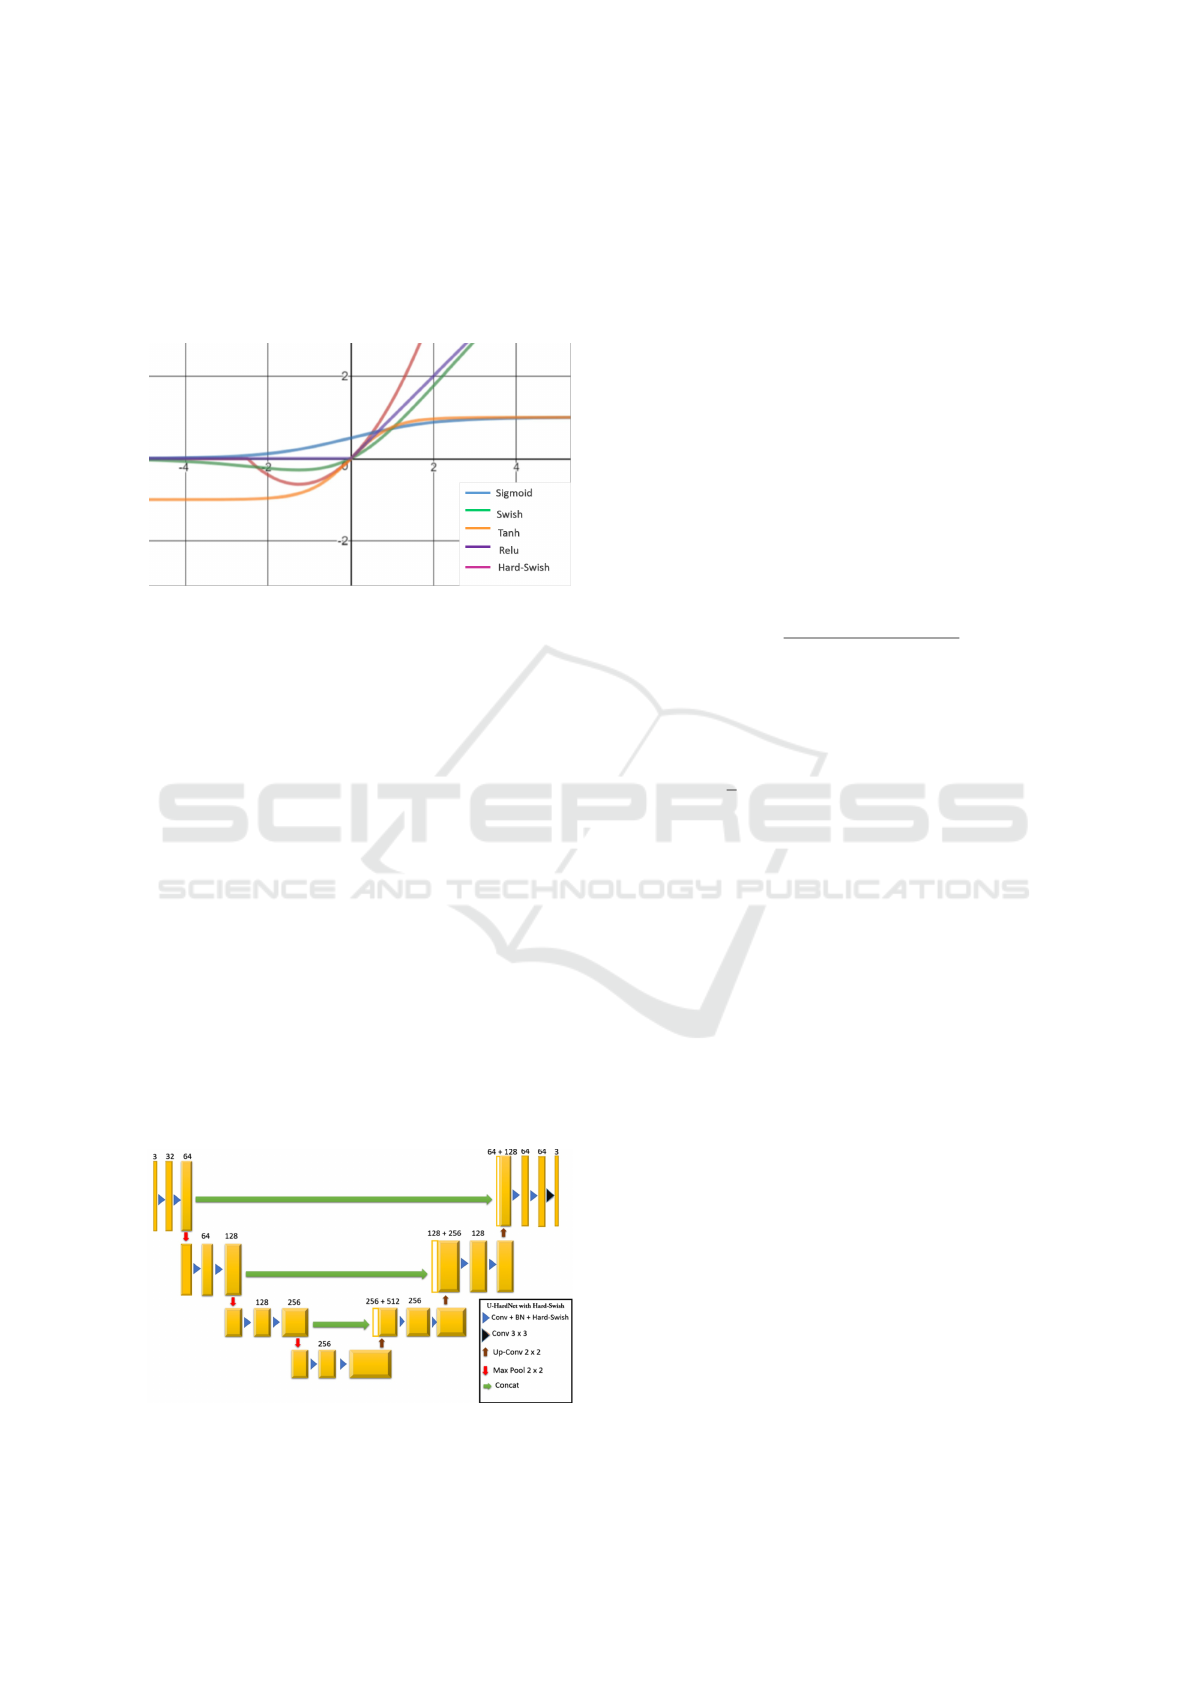
Figure 1: Plot of Traditional activations like Sigmoid, Relu,
Tanh, Swish vs Hard-Swish Activation function with it’s
non-monotonic bump for x less than 0.
The non-monotonic bump is the most striking
difference between Hard-Swish and other activation
function when x is less than 0 as shown in Figure 1.
Inside the domain of the bump (2.5 ≤ x ≤ 0), a large
percentage of preactivations fall leading to a better
convergence and improvement on benchmarks.
4.3 Using U-HardNet Architecture for
Object Recognition
The tensor obtained from IHS Transform serves as in-
put to U-HardNet architecture which consists of con-
tracting and expansive paths as shown in Figure 2. In
the contractive path,it is followed by the typical con-
volution neural network architecture (Olaf Ronneber-
ger, 2015). Hard-Swish is used as primary activation
function, which is beneficial for training and it helps
to learn representations that are more robust to noise.
Batch normalization is used for convergence accele-
ration during training.
Figure 2: U-HardNet Architecture with Hard-Swish activa-
tion in each layer except last layer where sigmoid is used.
At each down-sampling step, the number of fea-
ture channels are doubled. Expansive path consists
of up-sampling operation of the feature map follo-
wed by convolution with half number of feature chan-
nels and concatenation with the corresponding feature
map from contracting path(Olaf Ronneberger, 2015).
Therefore, architecture is having both down-sampling
and up-sampling paths for extracting features along
with preserving key features from feature map by con-
catenating in expansive path.
4.4 Evaluation Metric and Optimization
The Jaccard index, known as intersection over union,
can be depicted as likeness measure between a limited
number of sets(Maxim Berman, 2018). Intersection
point over union for likeness measure between two
sets A and B can be depicted as following:
J(A, B) =
| A ∩ B |
| A | + | B | − | A ∩ B |
(4)
Its value ranges from 0 to 1 only and they are sen-
sitive to misplacement of the segmentation label. The
loss function used for classification tasks in our model
is
H = −
1
n
n
∑
i=1
[ylog(
b
y) + (1 − y)log(1 −
b
y)] (5)
and according (Maxim Berman, 2018), training ob-
jective and evaluation metric should be as close as
possible to get better results.The issue is that Jaccard
Index isn’t differentiable. Therefore, it can be gene-
ralized for probability prediction, which on the one
hand, results in confident predictions as normal Jac-
card does and on the other hand it is made differen-
tiable by constructing a joint loss function of jaccard
index and binary cross entropy. It can also be used in
algorithms that are optimized with gradient descent.
4.5 Model Training
As a primary input, fusion of multispectral bands, re-
flectance indices and RGB channels were stacked into
single tensor because U-HardNet requires inputs as
tensor.
• Network was trained for 40 epochs with a learning
rate of 1e-6.
• Each epoch was trained on 400 batches and each
batch contained 128 image patches.
• Randomly cropping 112x112 patches from origi-
nal images was used to create each batch.
• Nadam Optimizer was used and instead of larger
receptive field, larger batches proved to be more
significant for model training.
VISAPP 2019 - 14th International Conference on Computer Vision Theory and Applications
416
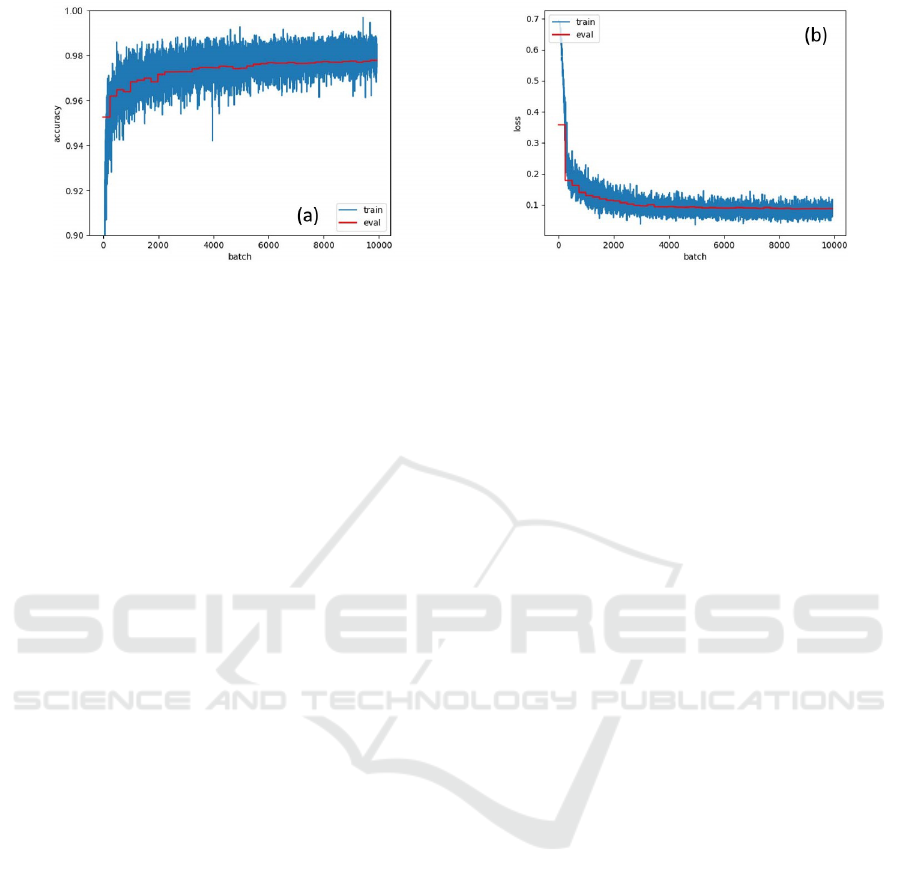
Figure 3: (a) Computer Generated Accuracy vs Batches for Training and Evaluation Set and (b) Loss Vs Batches for Training
and Evaluation Set after 40 epochs with learning rate as 1e-6.
During training procedure patches were prepared,
cropping them from the original images, augmented
and later fed into the neural network. Training indi-
vidually for classes proved to be efficient with more
score with respect to training setup. Figure 3 shows
Computer Generated Accuracy and loss vs Batches
for Training and Evaluation Set after 40 epochs with
learning rate as 1e-6
5 EXPERIMENTS AND RESULTS
The proposed approach inculcates Hard-Swish activa-
tion function. Function has a particular shape of the
curve in negative part which includes majority of pre-
activations and improves performance as they can out-
put small negative numbers leading to better results.
Hard-Swish is set as point of reference for compari-
son with other activation functions in different chal-
lenging datasets using variety of models.
5.1 Experimental Setup for Semantic
Segmentation using Hard-Swish on
DSTL Dataset
The proposed activation function along with U-
HardNet architecture was tested on DSTL dataset.
Initial input tensor obtained from RGB to IHS trans-
form gives the adaptability to change every part of the
IHS framework independently without affecting the
other. Adaptation of fully convolutional network to
multispectral satellite images with joint training ob-
jective and analysis of boundary effects, boosted the
training process. Jaccard scores for different object
classes are shown in Figure 4, in the wake of running
the same U-HardNet model for all classes indepen-
dently.
The final results are summarized in Figure 4 first
graph, between traditional activation functions and
the proposed activation function i.e. Hard-Swish.
Best evaluation accuracy went upto 97.75% with mi-
nimum loss as 0.08% . Sample Image representation
after segmentation is shown in Figure 5 and graphs
of Accuracy and Loss vs Batches is shown in Figure
3. Average Score achieved via Hard-Swish beats ot-
her traditional functions by a good margin making the
score of individual object classes as highest in current
scenario.
5.2 Experimental Setup for Hard-Swish
on other Standard Datasets
Activation function Hard-Swish was compared
against other traditional activation functions which
are commonly used. Standard datasets like CIFAR
10, MNIST were used for evaluating activation functi-
ons along with evaluation on DSTL dataset. It should
be noted that due to differences in training setup, the
results may vary and can not be directly compared to
the results in corresponding works.
5.2.1 CIFAR10
The CIFAR10 database consists of 32x32 colored
small images. There are total 60,000 samples and is
divided into 50,000 images for training and 10,000 for
testing. The CIFAR10 dataset contains images of 10
different classes such as dog, cat, boat and plane.
For CIFAR10, the performance of Hard-swish relative
to other traditional activations was tested on Simple-
Net model(Mohsen Fayyaz Seyyed Hossein Hasan-
pour Mohammad Rouhani, 2016), which is a deeper
CNN composed of 13 convolutional layers. The CNN
was designed to achieve a good trade-off between the
number of parameters and accuracy. It achieved 95%
accuracy while having parameters less than 6M. Mo-
del was trained for 150 epochs with 128 as batch size.
Initial learning rate was set to as 0.1 and multiplied it
by 0.2 every at 60 epochs. SGD optimizer was used
Semantic Segmentation of Satellite Images using a Modified CNN with Hard-Swish Activation Function
417
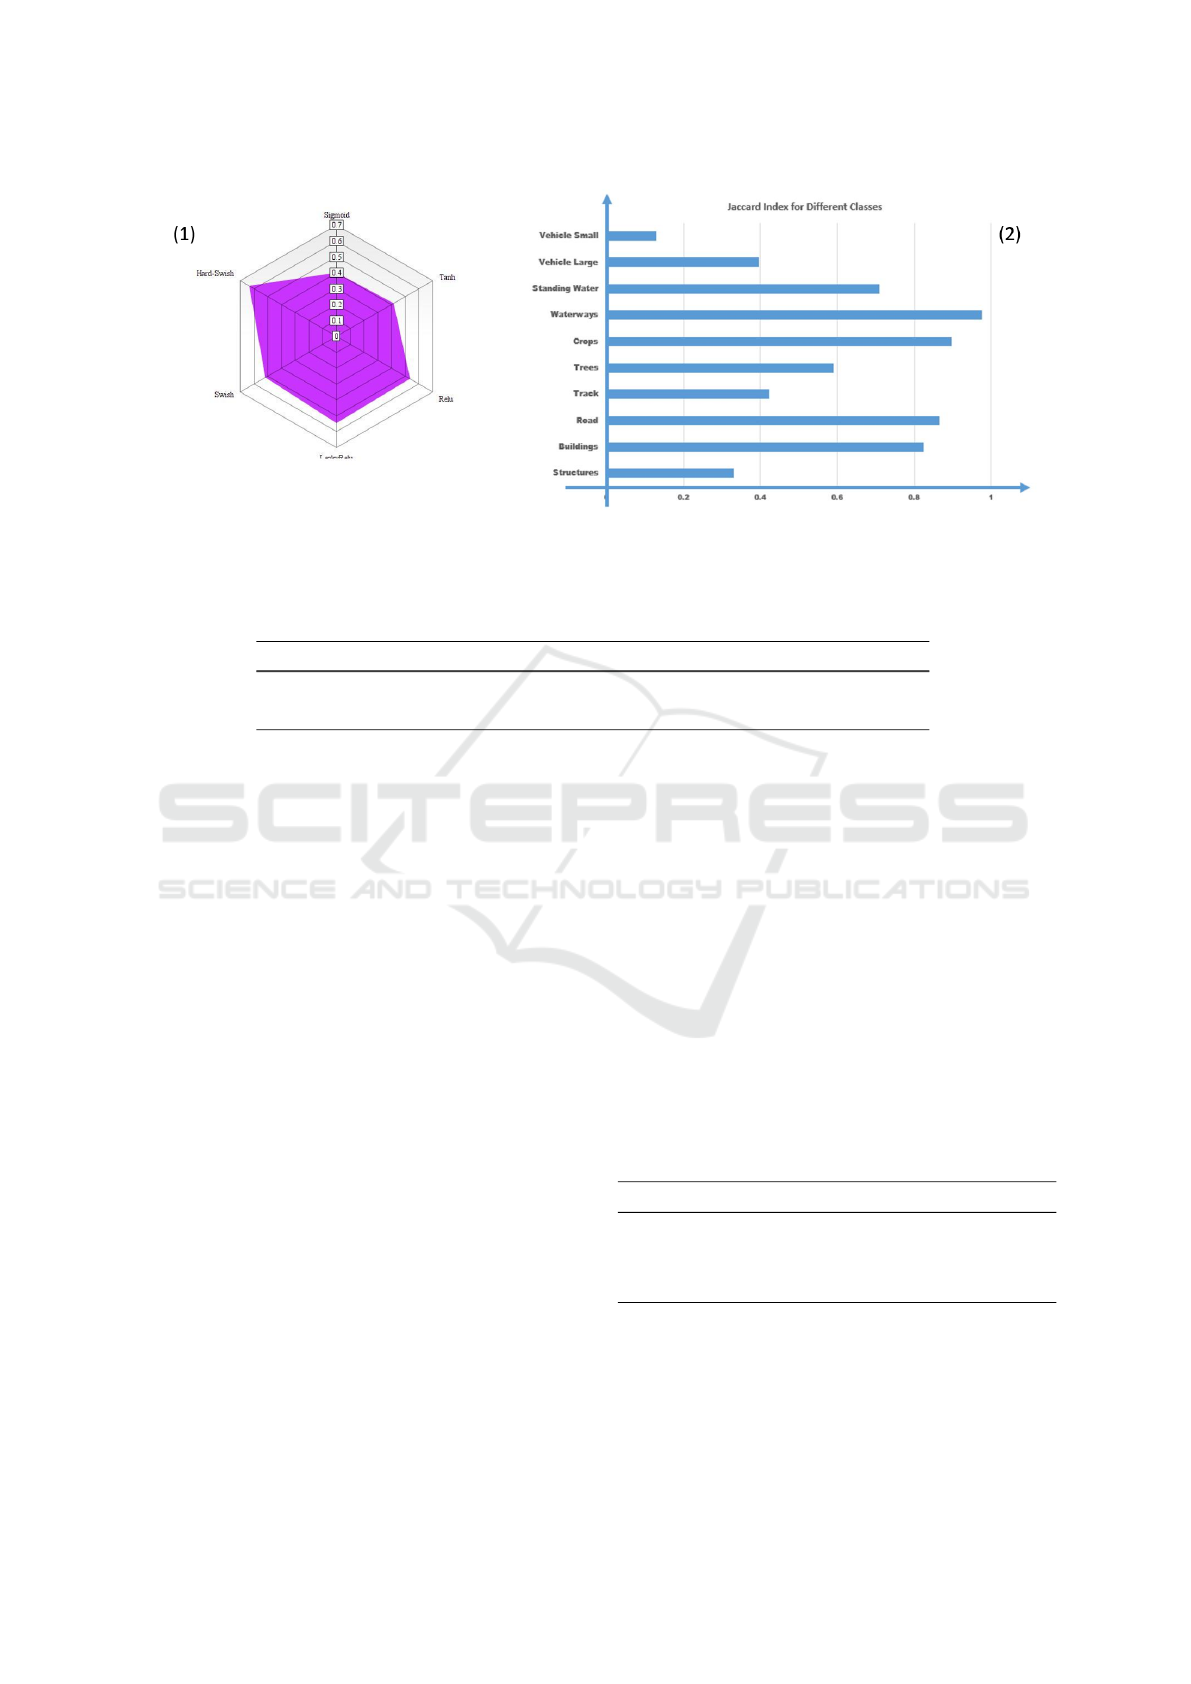
Figure 4: Graph 1 summarizes average Jaccard score achieved for all activation functions in DSTL dataset and Graph 2 shows
obtained jaccardian Score for various classes with respect to Last Epoch after training with U-HardNet.
Table 2: Row 1 represents error percentage in MNIST dataset and Row 2 shows accuracies achieved in CIFAR10 dataset over
different activation functions.
Dataset Sigmoid Tanh Relu LeakyRelu Swish Hard-Swish
MNIST 1.31% 1.08% 0.53% 0.59% 0.32% 0.265%
CIFAR10 94.21% 94.15% 95.76% 95.81% 95.78% 96.1%
for optimizing and the results obtained after training
is shown Table 2.
5.2.2 MNIST
The MNIST database consists of 28x28 handwritten
digits and is downloaded from Kaggle website. Data-
set has total 70,000 images, in which training set has
60,000 examples, and test set comprises of 10,000 ex-
amples. The larger set available is known as NIST
and MNIST is a subset of this dataset. The digits
are centered in a fixed-size image and have been size-
normalized.
Data augmentation was used to avoid overfitting
problem. Hard-swish was compared against traditi-
onal activation functions like Relu and Swish on a
fully connected network with 512 neurons in each
layer. Adam as optimizer and loss as categorical
cross-entropy was used. Initially, learning rate was
set to 0.001 and trained for 30 epochs with batch size
of 86. The results obtained after training is shown Ta-
ble 2 in terms of error percentage.
State of the art and the results obtained, for the
above mentioned datasets is summarized below.
• – Dataset: MNIST
1. State of the Art Model: Regularization of
Neural Networks using DropConnect.
2. Result (Error Percentage) of the above model:
0.23%
3. Achieved Result (Error Percentage) using
Hard-Swish in our model: 0.265%
• – Dataset: CIFAR 10
1. State of the Art Model: Fractional Max-
Pooling
2. Result (Accuracy) of the above model:
96.33%
3. Achieved Result (Accuracy) using Hard-
Swish using SimpleNet: 96.1%
Results of different activation functions along
with proposed activation function on different archi-
tectures for CIFAR10 dataset is also highlighted in
Table 3.
Table 3: Results mentioned are in terms of accu-
racy(percentage), with column 1 showing results of ResNet
architecture, column 2 is for WRN and column 3 for Den-
seNet architecture.
Activation Function ResNet WRN DenseNet
Swish 94.5 95.5 94.8
Relu 93.8 95.3 94.8
Hard-Swish 94.65 95.8 94.95
VISAPP 2019 - 14th International Conference on Computer Vision Theory and Applications
418
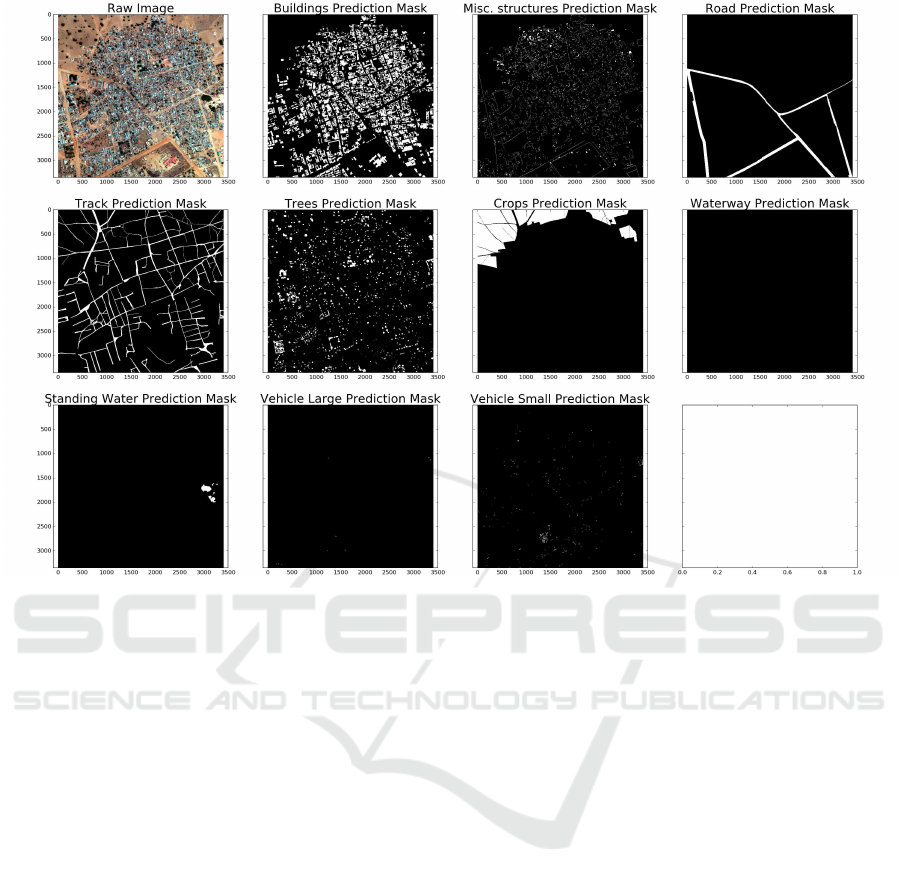
Figure 5: Image Segmentation of different object classes are shown under their respective headings after Training with U-
HardNet.
6 CONCLUSION AND FUTURE
SCOPE
A new approach with Convolutional Neural Network
and proposed activation function, Hard-Swish is pre-
sented for analyzing satellite imagery. Which will le-
verage recent deep learning techniques for accurate
semantic segmentation (Ross Girshick, 2014)as Hard-
swish outperformed traditional functions on a variety
of problems. The application of proposed activation
function can easily be generalized to tasks like seg-
mentation across different fields with better and accu-
rate results. Therefore, the updated CNN model wit-
hout explicit supervision, learns to identify complex
features such as roads, urban areas and various ter-
rains(M. Pesaresi, 2001). Future work can integrate
this new and novel function in more complex models
and produce new State-of-the-Art results for different
datasets. Discussed methodology has great potential
to solve many deep learning challenges especially in
semantic segmentation. At a later date, few other
technologies can be incorporated for more precise es-
timations. This paper can be very helpful to conduct
ex- periments and further tests on semantic segmenta-
tion, either on satellite imagery or biomedical image
datasets.
REFERENCES
Chen L.C., P. e. a. (2015). Semantic image segmentation
with deep convolutional nets and fully connected crfs.
In International Conference on Learning Representa-
tions (ICLR).
Jia.Y, S. E. e. a. (2014). Caffe: Convolutional architecture
for fast feature embedding.
Le Q V, R. M. e. a. (2012). Building high-level features
using large scale unsupervised learning. In Internati-
onal Conference on Machine Learning.
Long J., Shelhamer E., D. T. (2015). Fully convolutional
networks for semantic segmentation. In Computer Vi-
sion and Pattern Recognition (CVPR).
M. Pesaresi, J. B. (2001). A new approach for the morpho-
logical segmentation of high-resolution satellite ima-
gery. In IEEE Transactions on Geoscience and Re-
mote Sensing, Volume: 39, Issue: 2.
Maxim Berman, M. B. B. (2018). The lovsz-softmax
loss: A tractable surrogate for the optimization of the
intersection-over-union measure in neural networks.
In Computer Vision and Pattern Recognition.
Semantic Segmentation of Satellite Images using a Modified CNN with Hard-Swish Activation Function
419

Michael Kampffmeyer, Arnt-Brre Salbergt, R. J. (2016).
Semantic segmentation of small objects and modeling
of uncertainty in urban remote sensing images using
deep convolutional neural networks. In Computer Vi-
sion and Pattern Recognition.
Mnih V., H. G. E. (2010). Learning to detect roads in high-
resolution aerial images. In European Conference on
Computer Vision (ECCV).
Mohsen Fayyaz Seyyed Hossein Hasanpour Moham-
mad Rouhani, M. S. (2016). Lets keep it simple, using
simple architectures to outperform deeper and more
complex architectures.
Olaf Ronneberger, Philipp Fischer, T. B. (2015). U-net:
Convolutional networks for biomedical image seg-
mentation. In International Conference on Medical
Image Computing & Computer Assisted Intervention.
P Sermanet, D. E. e. a. (2013). Overfeat: Integrated recog-
nition, localization and detection using convolutional
networks. In IEEE Conference on Computer Vision
and Pattern Recognition Workshops, pages 3643.
Pascal Kaiser, J. D. W. e. a. (2017). Learning aerial image
segmentation from online maps. In IEEE Transactions
on Geoscience and Remote Sensing.
Prajit Ramachandran, Barret Zoph, Q. V. L. (2018). Sear-
ching for activation functions. In International Con-
ference on Learning Representations.
Renuka M. Kulat, R. S. (2016). Satellite image classifica-
tion based on rgb to ihs transform using fusion based
approached: A review. In International Journal of Ad-
vanced Research in Computer Science and Software
Engineering, Volume 6, Issue 1, January.
Ross Girshick, Jeff Donahue, T. D. J. M. (2014). Rich fe-
ature hierarchies for accurate object detection and se-
mantic segmentation. In Computer Vision and Pattern
Recognition.
Russakovsky O, D. J. e. a. (2014). Imagenet large scale
visual recognition challenge. In International Journal
of Computer Vision.
S. Paisitkriangkrai, J. Sherrah, P. J. A. H. (2015). Effective
semantic pixel labelling with convolutional networks
and conditional random elds. In IEEE Conference on
Computer Vision and Pattern Recognition Workshops,
pages 3643.
VISAPP 2019 - 14th International Conference on Computer Vision Theory and Applications
420
