
Validation of the fNIRS Pioneer™, a Portable, Durable, Rugged
functional Near-Infrared Spectroscopy (fNIRS) Device
Bethany K. Bracken
1
, Elena K. Festa
2
, Hsin-Mei Sun
2
, Calvin Leather
1
and Gary Strangman
3
1
Charles River Analytics, 625 Mount Auburn St., Cambridge, MA, U.S.A.
2
Brown University, 190 Thayer St., Providence, RI, U.S.A.
3
Massachusetts General Hospital, 73 High St., Charlestown, MA, U.S.A.
Keywords: Cognitive Workload, functional Near-Infrared Spectroscopy (fNIRS), n-Back, Multi-Attribute Task Battery
(MATB).
Abstract: Assessing cognitive workload using functional near-infrared spectroscopy (fNIRS) in labs is well established.
However, fNIRS sensors useful during normal activities in real-world environments are only recently
emerging. We validated a small, portable fNIRS sensor (the fNIRS Pioneer ™) against a larger sensor with
coverage of a larger cortical area, the NINScan developed at Massachusetts General Hospital. We used a gold-
standard working memory task (n-back; (Kirchner, 1958)) and a more complex multi-attribute task battery
(MATB) (Santiago-Espada et al., 2011). Twenty healthy adult (21.5 ± 3.3 years; 9 males) students at Brown
University completed all three experimental visits. Fitting with previous research, on the n-back task, we
found a significant effect of difficulty level on blood oxygenation (HbO
2
) in dorsolateral prefrontal cortex
(dlPFC) HbO
2
(p<.01), but not medial PFC HbO
2
with the fNIRS Pioneer. For the NINScan, we observed
increases in HbO
2
from 1- to 2- to 3-back in two channels corresponding to the border between ventrolateral
PFC (vlPFC) and dlPFC in both hemispheres (p<.05). When we aggregated MATB data across subtasks, and
after accounting for time-on-task, we found a significant (p<.01) effect on HbO
2
for the Pioneer and the
NINScan. In all cases, the significant HbO
2
findings were negative relationships, indicating less brain
activation with better performance. While prior literature of functional brain imaging with MATB is not
available, this finding is at least broadly consistent with the role of lateral PFC’s role in working memory.
This indicates that both the fNIRS Pioneer and the NINScan sensor, when combined with appropriate data
analytic techniques were useful for detecting changes in HbO
2
that correlate with cognitive workload and
behaviour, and that the fNIRS Pioneer is able to assess cognitive workload similarly to more larger, more
expensive, and more established devices.
1 INTRODUCTION
Assessing cognitive workload using functional near-
infrared spectroscopy (fNIRS) in labs is well
established. Increased workload corresponds with
increase in prefrontal blood oxygenation (HbO
2
)
correlated with increased task engagement. Once the
task becomes too difficult, HbO
2
decreases as does
task engagement and performance (Ayaz et al., 2012;
Bunce et al., 2011). However, fNIRS sensors useful
for assessing cognitive workload during normal
activities in real-world environments are only
recently emerging (Bracken et al., 2017; Bracken et
al., 2013; McKendrick et al., 2015). Standard sensors
are large (e.g., full-head), expensive (~$10K) and
require heavy equipment (e.g., batteries, laptops).
Under this NASA-funded effort Cognitive
Assessment and Prediction to Promote Individualized
Capability Augmentation and Reduce Decrement
(CAPT PICARD), we validated our fNIRS Pioneer
sensor, a sensor that is more portable, rugged, and
cost-effective than other devices on the market,
against the NINScan developed at Massachusetts
General Hospital. We used a gold-standard task
known to affect cognitive workload (n-back;
(Kirchner, 1958)) and a more complex multi-attribute
task battery (MATB) (Santiago-Espada et al., 2011).
NINScan supports 32 channels (with one channel
representing on LED pair and a detector), with 8
channels per hemisphere in this test. Because our
fNIRS Pioneer sensor only includes one source-
detector pair, we further validated our findings by
Bracken, B., Festa, E., Sun, H., Leather, C. and Strangman, G.
Validation of the fNIRS Pioneer
TM
, a Portable, Durable, Rugged functional Near-Infrared Spectroscopy (fNIRS) Device.
DOI: 10.5220/0007471405210531
In Proceedings of the 12th International Joint Conference on Biomedical Engineering Systems and Technologies (BIOSTEC 2019), pages 521-531
ISBN: 978-989-758-353-7
Copyright
c
2019 by SCITEPRESS – Science and Technology Publications, Lda. All rights reserved
521
collecting data at two locations: the dorsolateral
prefrontal cortex (dlPFC) known to exhibit changes
in HbO
2
with increasing cognitive workload, and the
medial PFC, which does not exhibit changes in HbO
2
due to cognitive workload. We expected to see a
change in HbO
2
with each increase in difficulty level
for both the n-back and the MATB over dlPFC but
not medial PFC, indicating that fNIRS is useful for
assessing cognitive workload in these tasks, and that
our more portable fNIRS Pioneer is able to assess
cognitive workload similarly to more established
devices.
2 METHOD
2.1 Participants
Twenty-three healthy adults (age: 21.3 ± 3.0 years;
education: 14.5 ± 1.9 years; 10 males) were recruited
from the student population of Brown University.
Three participants withdrew from the study prior to
completion of all three sessions: one due to a
headache from the electroencephalography (EEG)
cap and the other two because of the length of the test
sessions. All participants were native English
speakers with reported normal or corrected-to-normal
vision and hearing. Participants were right-handed
with the exception of one who reported being
ambidextrous. There was one active and one prior
smoker. None of the participants reported any history
of learning disabilities. However, one participant
reported a diagnosis of depression and another a
diagnosis of anxiety. No other psychological
disorders were reported. Four participants reported
prior concussions or head injuries. Ethnicity consisted
of eleven Caucasian, five Asian, four
Hispanic/Latino, one African-American, and two not
reported. All individuals received monetary payment
for their participation.
The 20 participants (age: 21.5 ± 3.3 years;
education: 14.6 ± 2.0 years; 9 males) who completed
the study reported sleeping 6.9 ± 0.8 hours/night over
the past week. Reported weekly alcohol intake
(drinks per week) was reported as zero for five
participants, <1 for one participant, 1-5 for eleven
participants, 6-10 for two participants, and 11-15 for
one participant. Weekly caffeine intake (drinks per
week) was reported as zero for two participants, <1
for three participants, 1-5 for five participants, 6-10
for seven participants, 11-15 for two participants and
15+ for one participant.
Cognitive performance and the attentional state of
healthy young adults were monitored across an array
of computerized tasks varying in workload demands.
To minimize learning effects across sessions,
participants first completed a practice session in
which shortened versions of each cognitive task were
administered, along with several standardized
neuropsychological measures of executive function,
demographic/medical history questionnaires, and a
visual acuity eye test. Within each of the following
two sessions, physiological sensors (NINScan or
fNIRS Pioneer + EEG) were used to monitor brain
activity while participants performed the battery of
tasks twice in identical order with a boredom
induction task (see Section 2.2.1) administered
between the two runs. Two minutes of resting brain
activity (eyes-closed) was also collected at the start
and end of each session and before and after the
boredom induction task.
2.2 Experimental Tasks
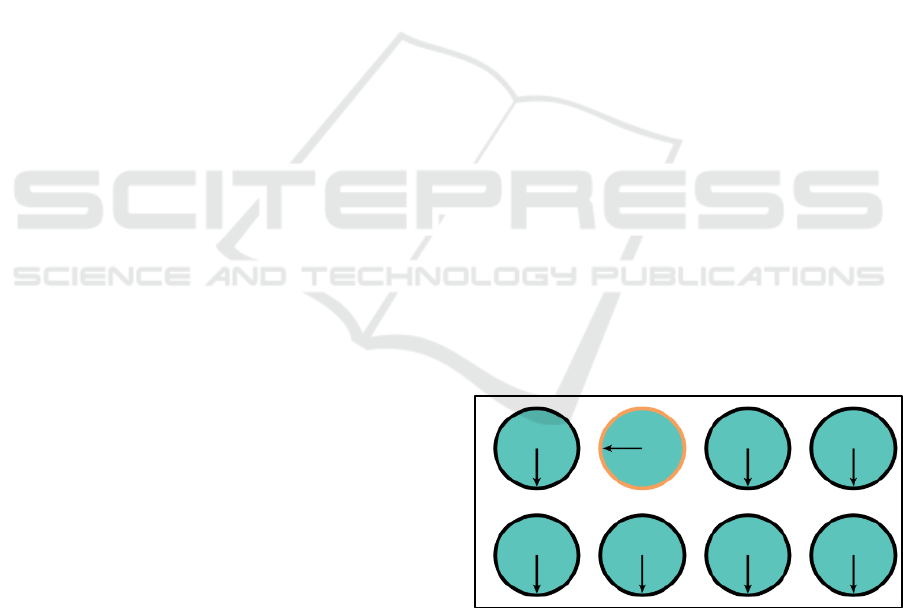
2.2.1 Boredom Induction Task
The boredom induction task was a computerized
version of a peg turning task (shown in Figure 1) that
has been shown to be successful in inducing boredom
(Markey et al., 2014). Participants were presented
with two rows of four discs each with a radius vertical
line. Each disc was highlighted in sequence, and
participants were asked to click as quickly as possible
on each of the highlighted disc until the line rotated
clockwise back to its original position. Each mouse
click rotated the line a quarter turn. Participants
performed this task continuously for five minutes.
Participants then completed a questionnaire to
confirm that boredom was induced.
Figure 1: Peg turning task screen.
2.2.2 n-Back Sequential Letter Memory
The n-back task was designed to be similar to the
paradigm used in a neuroimaging study to investigate
the role of the prefrontal cortex (PFC) in working
memory (Braver et al., 1997). It was created and
administered with e-Prime 2.0.10.353 Professional
RAIDERS 2019 - Special Session on Real-world Assessment of Individuals During Everyday Routines
522
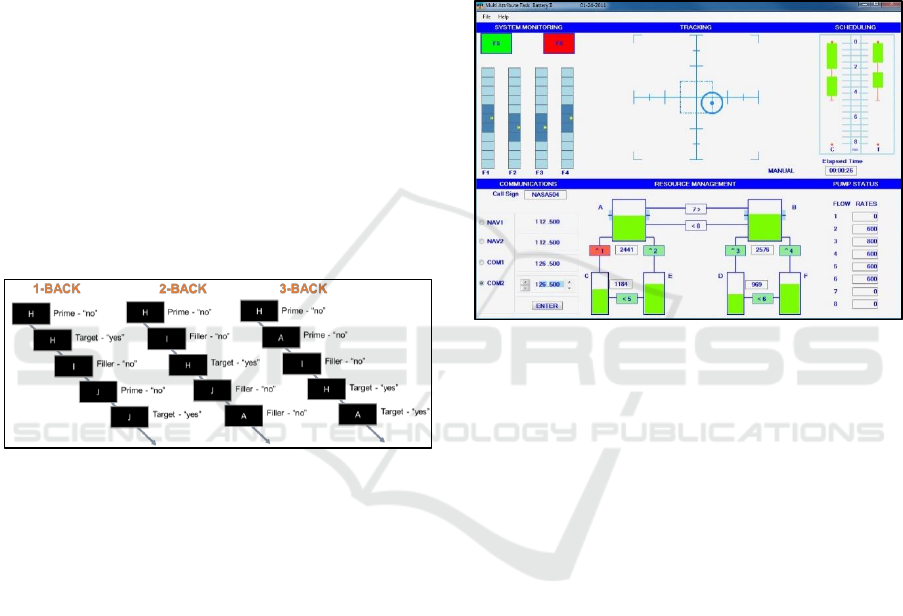
software. See Figure 2 for the n-back protocol.
Participants were shown a series of letters at the
centre of the display, and were instructed to indicate
on each trial whether or not the letter shown matched
either 1, 2, or 3 letters back in the sequence across
separate blocks of trials. Participants indicated their
choice by pressing the left mouse button for a match
and the right mouse button for a non-match. Stimuli
consisted of 20 capitalized English letters (I, M, O, Q,
V and W excluded) presented in a different
randomized sequential order. Each letter was
presented three times within each block (1-, 2-, 3-
back) for a total of 60 trials. Within each block, each
letter served as a prime (stimulus to which a
subsequent letter would be a match), a target
(stimulus that matched a prior stimulus), and a filler
(a stimulus that neither matched a prior stimulus nor
served as a prime for a subsequent stimulus). Each
letter was presented for 500ms followed by an inter-
stimulus interval of 2500ms. Participants had to
respond within 2500ms after the onset of the stimulus
for the response to be recorded. Response time and
accuracy was recorded for each trial.
Figure 2: n-Back protocol.
2.2.3 Multi-Attribute Task Battery (MATB)
The multi-attribute task battery (MATB) is a
computerized task battery developed by NASA to
assess human performance under highly-demanding
multitasking conditions. MATB was first released in
1992 (Comstock and Arnegard, 1992), and revised in
2011 (Santiago-Espada et al., 2011). MATB was
designed through NASA to evaluate operator
performance and workload. Performance measures
from this battery have been shown to be sensitive to
changes in cognitive workload and attentional state
(e.g., sleep deprivation). To manipulate cognitive
effort, the performance demands can be
systematically increased by increasing the speed at
which events occur within each task to which the
participant must respond. Based on task parameters
from work at the Air Force Research Lab (AFRL)
(Nelson, 2016), we chose three levels of difficulty
(easy: 0.8 baud rate; medium: 1.6 baud rate; hard 2.2
baud rate), and each was administered for four
minutes in increasing order of difficulty both pre- and
post-boredom induction at visits two and three.
MATB consists of four individual tasks that are
performed simultaneously in a pilot user-interface
environment: a system monitoring task, a tracking
task, a communications task, and a resource
management task. The included subjective
questionnaire is the NASA task load index (NASA-
TLX; (Cao et al., 2009; Hart and Staveland, 1988)).
Figure 3: shows a screenshot of the MATB task.
Figure 3: Multi Attribute Task Battery (MATB).
In the system monitoring task, the participant
must monitor the green and red lights and the blue
bars below. If the green or red light goes off, the
participant must click it. If the dark blue squares
move away from the centre of the bar, the participant
must click on the centre of the bar. For scheduling
task, the participant uses a joystick to keep the target
at the appropriate position in the grid. The
communications task requires the participant to listen
for audio messages. When the audio message pertains
to that participant’s aircraft, s/he must tune the radio
to the frequency specified by the message. To do this,
the participant clicks on the appropriate radio then
clicks the arrows until the correct frequency is shown.
For the resource management task, there are eight fuel
pumps (1-8) and six fuel tanks (A-F), each of which
has a different capacity. The green colour indicates
the amount of fuel in each tank. The participant must
maintain the appropriate amount of fuel in each tank
by transferring fuel from the supply tanks (A and B)
into the appropriate lower tank (C-F). To do this, the
participant clicks on the appropriate pump to turn it
on (turning the pump green), then clicks again to turn
it off. The flow rate for each pump is shown at the
bottom right.
Validation of the fNIRS Pioneer
TM
, a Portable, Durable, Rugged functional Near-Infrared Spectroscopy (fNIRS) Device
523
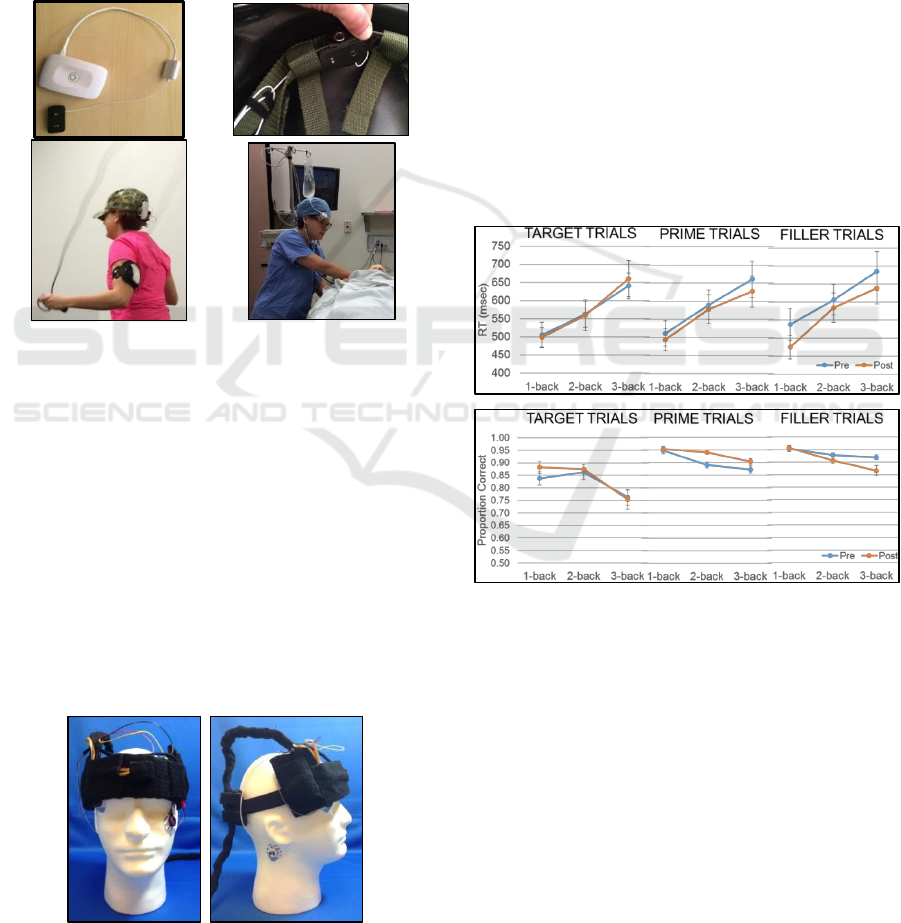
2.2.4 Sensors
The fNIRS Pioneer sensor (shown in Figure 3)
consists of a single source and a detector. Two such
sensors (separate devices) were positioned on the
scalp with the EEG cap to measure brain activity in
the right dorsolateral prefrontal cortex (dlPFC) at
electrode position F6 and right medial frontal gyrus
(MFG) at electrode position AF4. EEG recordings
were measured in conjunction with the fNIRS Pioneer
sensors for 32 electrodes in the standard 10-20
positions.
Figure 4: fNIRS Pioneer sensor alone (top left), mounted
inside a helmet (top right), worn during jump roping
(bottom left), and worn during a medical training
simulation (bottom right).
The NINScan sensor (as shown in Figure 5;
Strangman et al., 2018) was designed as a two-pad
device that recorded brain activity from both left and
right regions of the prefrontal cortex. Each pad
contained two sources and four detectors with 36mm
SD-separations, including measurements centred
over the AF4 location. In addition, peripheral sensors
were attached to record heart rate, respiration,
temperature, and head movement. EEG was also
recorded with the NINScan sensor from AF7 and AF8
electrode sites.
Figure 5: NINScan front (left) and side (right).
3 RESULTS
3.1 Behavioural Results and Subjective
Workload Ratings
For the n-back task, the mean response time and
accuracy for the different trials types (target, prime &
filler) in the increasing working memory load
conditions (1-, 2-, & 3-back) pre- and post-boredom
induction are presented in the Figure 6. In order to
directly compare to the event related potential (ERP)
data, only behavioural data from the visit with EEG +
the fNIRS Pioneer sensors are shown. No significant
learning effects were found for the performance
measures across the visits. As expected, both
performance measures showed a decline (increased
response time as shown in Figure 6 top & decreased
accuracy as shown in Figure 6 bottom) with
increasing working memory load. Only small
improvements in performance were found post-
boredom induction for the prime and filler trials.
Figure 6: n-Back behavioral results.
For the MATB task, we analysed behavioural
results for each task separately. In the tracking task,
performance decreased across all three measures as
task difficulty increased. For the distance measures,
as shown in Figure 7, performance improved slightly
across visits and declined slightly after boredom
induction in visit 3.
In the resource management task, performance
decreased as task difficulty increased for the time and
distance outside target measures. For both distance
measures, performance improved across visits and
after boredom induction at both visits (Figure 8).
RAIDERS 2019 - Special Session on Real-world Assessment of Individuals During Everyday Routines
524
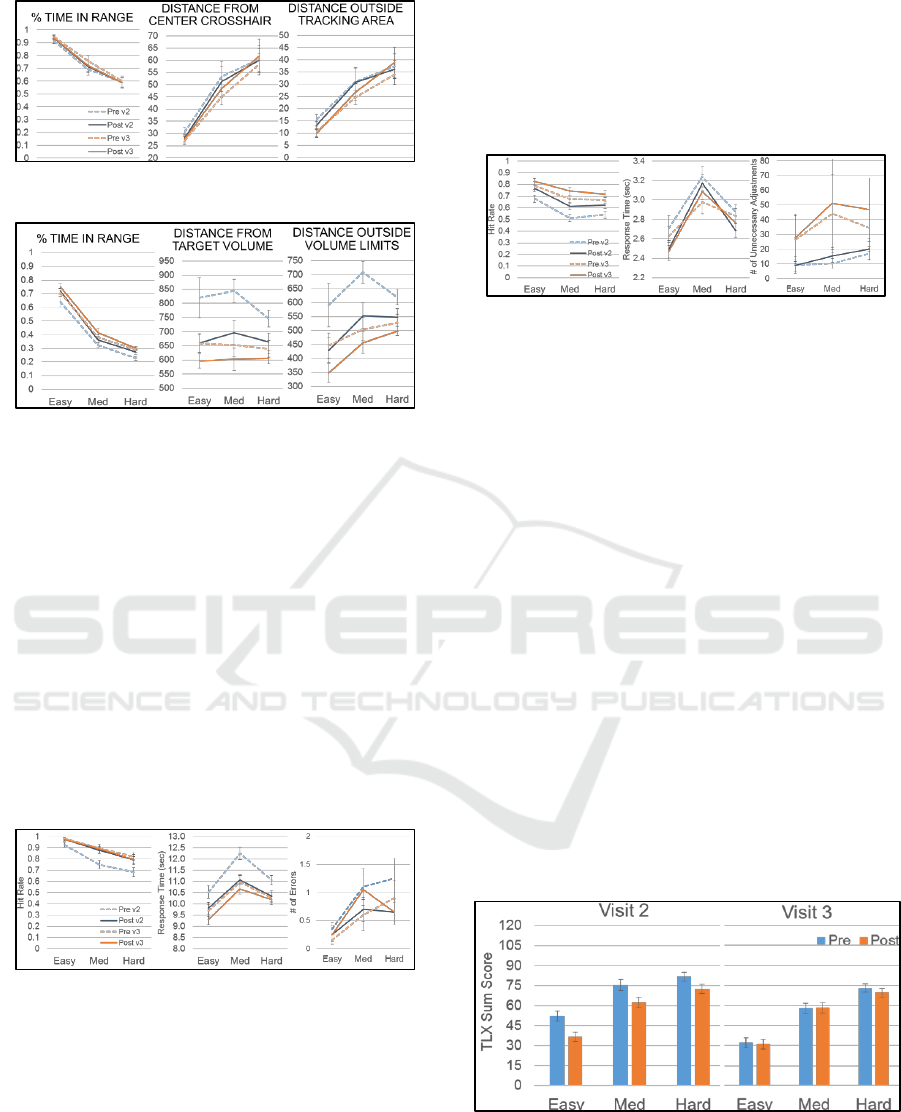
Figure 7: MATB tracking task behavioral results.
Figure 8: MATB resource management task behavioral
results.
In the communication task participants had five
seconds to respond to each event in this task.
Dependent measures examined in this task included:
(1) the accuracy or hit rate; (2) response time to
complete the modification; and (3) errors in
adjustment. As shown in Figure 9 hit rate decreased
as task difficulty increased, while response time
showed an inverted u-shape function with slower
performance at the medium difficulty level. Errors
were minimal, but there was an overall increase with
increased task difficulty. Boredom induction showed
no effect on hit rate or errors, but reduced response
time measures. Learning effects across visits are
apparent in hit rate and response time.
Figure 9: MATB resource communication task results.
In the system monitoring task, participants had
five seconds to respond to each event in this task.
Dependent measures examined in this task included:
(1) the accuracy or hit rate; (2) response time to the
event; and (3) number of unnecessary adjustments.
As shown in Figure 10 similar to the communications
task, hit rate decreased as task difficulty increased,
while response time showed an inverted u-shape
function with slower performance at the medium
difficulty level. Both measures improved over the
visits with unnecessary adjustments increasing over
the visits, suggesting a strategy to improve task
performance. Boredom induction showed
improvement on hit rate, but also increased the
number of unnecessary adjustments.
Figure 10: MATB system monitoring task behavioral
results.
The TLX scale consists of seven questions rated
on a 21-point scale with higher ratings indicating
greater workload effort. Rating values for the
questions were summed for each condition. Mean
summed values at pre- and post-boredom induction
for both visits are shown in Figure 11. Perceived
effort increased with MATB task difficulty for both
visits, suggesting that the chosen task parameters
were sufficient to elicit a systematic increase in
cognitive workload. The reduction of reported effort
across all MATB conditions from visit 2 to 3,
however, suggests that performance was also being
influenced by task learning effects, despite providing
practice during the baseline visit. Therefore, the
reduction of effort post-boredom induction in visit 2
likely reflects task learning effects rather than
boredom effects per se. Reported effort across the
three difficulty levels are comparable pre- and post-
boredom induction in visit 3, suggesting that learning
had reached asymptote by this visit and that boredom
induction had no impact on reported cognitive
workload in this task battery.
Figure 11: NASA TLX results.
3.2 fNIRS Pioneer
To validate the fNIRS Pioneer sensor, we first analys-
Validation of the fNIRS Pioneer
TM
, a Portable, Durable, Rugged functional Near-Infrared Spectroscopy (fNIRS) Device
525
ed whether the fNIRS-measured concentration of
HbO
2
in dlPFC was correlated with the difficulty
level of the n-back task. Because n-back blocks were
not counterbalanced (blocks were in order of
difficulty), we were concerned that differential HbO
2
correlated with n-back level might be due to time-on-
task effects or sensor drift. To mitigate this risk, we
normalized HbO
2
within each block by subtracting
the mean HbO
2
during the first 10 seconds of the
block from the mean HbO
2
during the block.
We then used a mixed model to evaluate if n-back
level modulated this normalized HbO
2
response.
Specifically, our model used n-back level as a
categorical fixed effect (we used categorical instead
of continuous to avoid making assumptions about the
linearity of the relationship) and subject as a random
intercept. We found that there was a significant,
positive effect of increasing n-back level from level 1
to 2 on normalized HbO
2
(p<.05). The effect from
level 1 to 3 was also positive, but was not significant
(p<.1). These effects were found for the lateral
location (situated over dlPFC). Similar analyses
performed on the more medial location (situated over
MFG) failed to find any effect of n-back level on
HbO
2
.
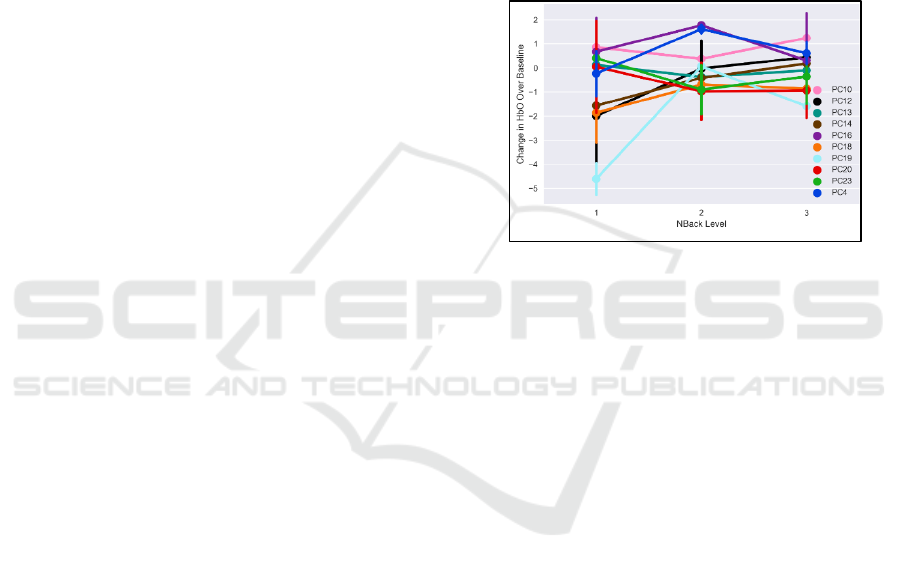
The n-back analysis showed that the fNIRS
Pioneer is capable of detecting workload-related
signals, however we did notice a large inter-subject
variability even on this simple task. The effect in the
dlPFC location can be seen in Figure 12 where the
normalized HbO
2
response increased as the difficulty
level increased in many of the subjects. However,
note that there is a great deal of variability in this
trend, with some subjects’ normalized HbO
2
actually
decreasing from the 1-back to the 3-back. This might
be due to the significant variance observed in subject
performance. For some subjects, it is possible that the
3-back was too difficult, and so, becoming
disengaged from the task due to the task difficulty, the
subjects produced HbO
2
signals that were no longer
correlated with task difficulty. However, this also
may be due to individual differences in HbO
2
response to different levels of cognitive workload, a
hypothesis that is backed up by our NINScan results
(see next Section) and our modelling work.
We next sought to determine whether these
signals were modulated similarly with the more
ecologically-valid MATB task. Specifically, we
wanted to know if MATB difficulty level was
correlated with the dlPFC HbO
2
signal. Performing a
similar mixed model to that used to analyse the n-
back data yielded no significant effects. That is, we
found no evidence that MATB difficulty level was
correlated with dlPFC or MFG responses (the beta
value for the effect of difficulty level on blood
oxygenation was not significantly different from zero,
p>.1). This lack of effect was not due to the task being
overly difficult or easy, or lacking a sufficient range
in difficulty to produce a modulation of workload.
The subjects showed high performance on the easy
level, and decreased, but still non-chance
performance on the hardest level. For example, on the
communication subtask, the percent of correct
responses fell from 95% on the easiest level, to 78%
on the hardest level, and the percent of cues to which
the subjects did not respond (misses) increased from
2% on the easiest level to 19% on the hardest level.
Figure 12: dlPFC HbO
2
varies with n-back difficulty level,
but subject-level variability predominates.
One hypothesis was that the lack of correlation
between dlPFC HbO
2
signal and MATB difficulty
could be due to the specific strategy subjects used to
respond to increasing task difficulty. To explore this
hypothesis, we analysed how subject performance on
the MATB varied with the difficulty level. We
analysed two of the subtasks with clear response
accuracy metrics (the communication and system
monitoring subtasks). The data suggested that as the
task became more difficult, subjects increasingly
ignored task cues; there is a significant correlation
between difficulty and the percentage of no response
events (misses, Table 1). This strategy can be
contrasted with a strategy in which subjects continue
to attend to the tasks, but as workload increases with
increased frequency of task cues, the percentage of
incorrect responses would also increase. There is no
evidence that subjects used this strategy, as there is
no significant correlation between MATB difficulty
and the percentage of incorrect responses (see Table
1). Furthermore, this lack of significant correlation
was not due to a nonlinear correlation or violation of
Pearson’s correlation assumptions (such as
normality), as Spearman’s rank coefficient is also low
(0.14 for the communications subtask).
RAIDERS 2019 - Special Session on Real-world Assessment of Individuals During Everyday Routines
526

Table 1: MATB difficulty level is not correlated with
accuracy of responses, but is correlated with miss/no
response rates. ** indicates correlation is significantly
different from 0 at the .01 level.
Subtask
Pearson’s r
(Difficulty ~ %
Incorrect)
Pearson’s r
(Difficulty ~%
No Response)
Communication
0.064
0.470 **
System
Monitoring
-0.007
0.291 **
Our next hypothesis was that rather than
participants experiencing the increased difficulty
with more complex levels as planned, and thus
decreasing performance accuracy across all tasks
equally as we expected, they are instead
compensating for increased difficulty by ignoring
some tasks to perform better on others. In other
words, participants could be regulating their cognitive
workload, electing to ignore subtasks or cues as the
difficulty increased, rather than respond to the
increased rate of stimulus presentation by increasing
the amount of information stored in working memory.
Indeed, as MATB difficulty increases, the percentage
of misses (when a stimulus occurred but the subject
gave no response) increases. At the same time, the
ratio of correct responses to incorrect responses (i.e.,
the subjects correctly performs the action indicated by
the cue vs. the subject performs a different, erroneous
response) had no discernible trend.
If this were true, we could not simply use reaction
time and accuracy for each sub-task separately, but
must instead aggregate performance across tasks to
get a realistic output. If subjects regulate cognitive
workload in this way, it is possible that a combined
metric, pooling information across tasks, might
capture moment-to-moment changes in workload.
For example, if a subject focused on certain subtasks
at different times, looking at any single subtask would
not truly reflect workload (as often the subject might
be working on a different task), but a combined
metric would still be able to reflect overall workload
despite transient focus on only a few subtasks at a
time.
We first performed aggregation of MATB
behavioural data across subtasks to enable more
accurate analysis of performance decrements and
their relationship with physiological data. We began
by tabulating windowed performance metrics on each
subtask. Full details of this work are presented in
Leather et al., 2018. These subtask performance
metrics indicate the percentage of stimuli that
subjects responded to (hit rate) within 20-second
windows. This tabulation is nontrivial, as the default
MATB performance logs produced by the
experimental software only give block-level
descriptions of performance (and as such do not allow
analysis of moment-to-moment changes in MATB
performance). To compute these subtask metrics, we
analysed the master log of all stimuli and responses,
and determined whether each stimulus in each 20-
second window received a correct response. Several
subtasks (tracking and resource management) do not
have discrete hit/miss events, as they consist of a
continuous task. For these subtasks, the root mean
squared deviation (RMS) (a typical metric used in the
literature for these subtasks (Santiago-Espada et al.,
2011)) was used.
Once the binned subtask performance metrics
were calculated, we needed to combine these subtask
metrics into a combined score that reflected global
performance. It is important that no single subtask
plays a larger role in this combined metric, so we
adjusted the weighting of each subtask so that the
correlation between each subtask metric and the
combined metric was equal (in other words, no
subtask has a stronger influence on the combined
metric than any other). This combined metric shows
reasonable properties. For example, it is high on the
easy level of difficulty, and gets progressively lower
on medium and hard levels. Subjects with a high
combined metric on easy/medium difficulty tend to
have a high combined metric on hard difficulty.
Table 2: Model summary of mixed model relating HbO
2
to
difficulty with subject-level random intercept.
N Observ-
ations
60
Method
REML
N Groups
10
Scale
1.8307
Min group size
6
Likelihood
-
107.2453
Max group size
6
Converged
Yes
Mean group
size
6
Coef.
Std. Err.
Z
P>|z|
0.025,
0.975
Intercept
0.815
0.383
2.129
0.033
-1.565,
-0.065
1-back vs 2-
back
0.858
0.428
2.006
0.045
0.020,
1.697
1-back vs 3-
back
0.708
0.428
1.655
0.098
-0.131,
1.547
Subject RE
0.550
0.325
We then investigated whether this final, global
performance metric was correlated with HbO
2
variables. We hypothesized that since this global
performance metric reflects the number of stimuli that
a subject attended to in any given 20-second window,
it should be correlated with the amount of working
memory utilization, which would be indicated by
HbO
2
variables from the dlPFC sensor location.
Initial analysis showed no correlation between the
Validation of the fNIRS Pioneer
TM
, a Portable, Durable, Rugged functional Near-Infrared Spectroscopy (fNIRS) Device
527
global performance metric and the dlPFC HbO
2
variables. Specifically, a mixed effects model with
linear fixed effects of dlPFC HbO
2
as well as a by-
subject random intercept did not show significant
fixed effects (see Table 2).
We then performed additional exploratory
analysis that revealed that regardless of difficulty, all
subjects showed an increase in HbO
2
levels over the
span of each block. We hypothesized that the
variability due to this time-on-task effect might have
hidden a relationship between the behavioural
performance metric and HbO
2
. To examine this
hypothesis, we constructed an additional model in
which time-on-task was included. Specifically, we
used a mixed effects model to determine if the
behavioural metric within each 20-second window as
well as categorical regressors for time-on-task
predicted the mean HbO
2
within that 20-second
window (again with a by-subject random intercept).
After accounting for time on task, we found a
significant (p<.01) effect of the metric on HbO
2
, as
well as an effect of boredom induction (p<.001; Table
2)). This suggested that if we accounted for time-on-
task, we would be able to predict behavioural
performance given the current HbO
2
levels.
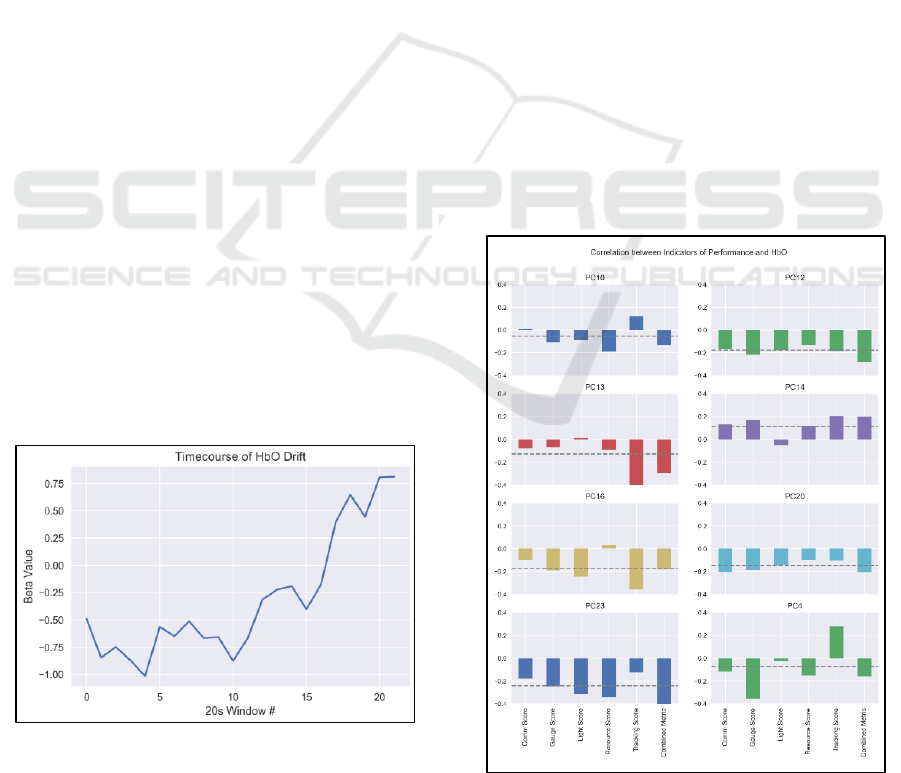
As time-on-task was represented as a set of
regressors (one for each 20-second window), we
could both visualize information about the trajectory
of HbO
2
during the task, as well as utilize the
information contained in the regressor beta values to
create predictive models that are able to account for
time-on-task effects. The timecourse of HbO
2
during
the task is visualized in Figure 13. There, each
successive 20-second window’s beta value is plotted
in order, showing how HbO
2
changes on average over
the length of each block. Subjects showed an
increasing and nonlinear trend in HbO
2
.
Figure 13: HbO
2
drift effects.
Finally, we investigated individual variability in
correlations between individual subtasks and neural
activity, and included time on task in all future
models based on this finding. We performed analyses
to determine (a) whether individual subtasks are
differently correlated with brain activity across
individuals, and (b) whether the computed combined
metric is more highly correlated with brain activity
than the average subtask.
To answer these questions, for each subject we
computed the correlation between individual subtask
scores and prefrontal HbO
2
(computed using 10
second windowed averages of the data to reduce
variance), as well as the correlation between the
combined metricand prefrontal HbO
2
. The results for
eight representative subjects are shown in Figure 14.
The correlation between each subtask and HbO
2
varies widely across subjects. However, within a
single object, correlation between each subtask and
prefrontal HbO
2
is largely of the same sign (i.e., for a
given subject there are not some subtasks that show
increased performance with prefrontal HbO
2
, and
others that decrease). Finally, the combined metric
provides a larger correlation with HbO
2
than the
average subtask for all subjects, explaining an
additional 10% of the variance in HbO
2
than the
average subtask. This indicates that prefrontal brain
activity is more reflective of performance pooled
across all tasks, rather than of any single task, fitting
with our previous findings.
Figure 14: Correlation between HbO
2
and each MATB
subtask for individual subjects.
RAIDERS 2019 - Special Session on Real-world Assessment of Individuals During Everyday Routines
528
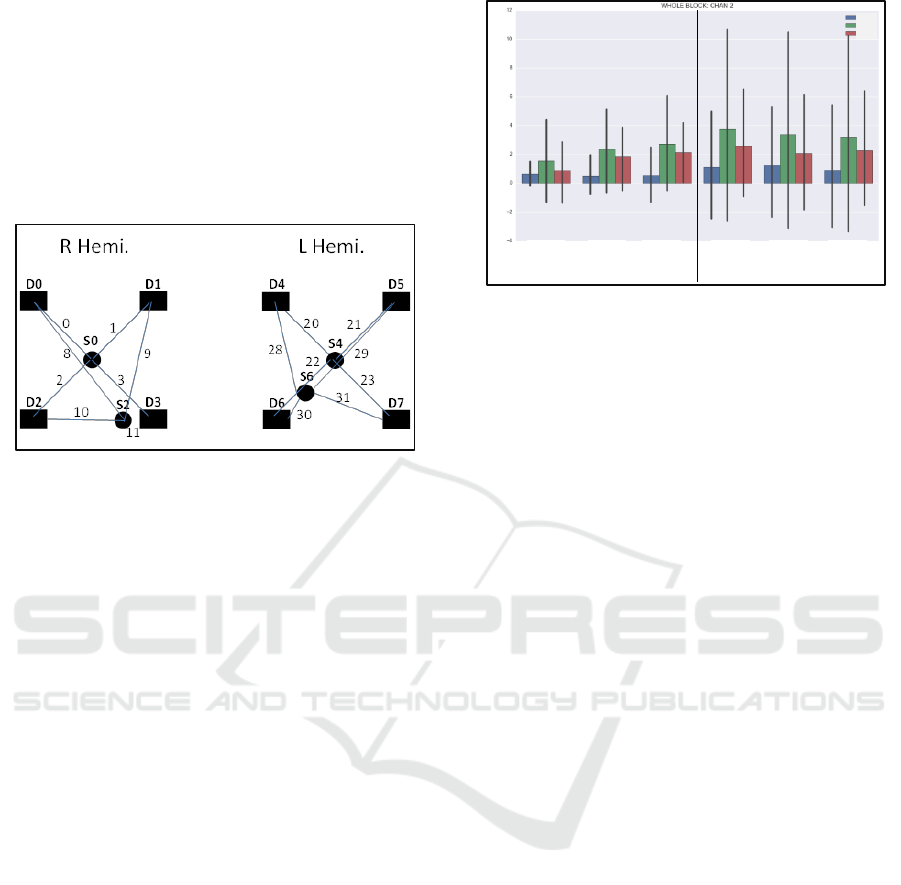
3.2.1 NINScan
Investigating the progression of 1-, 2-, and 3-back, a
classic manipulation of task difficulty, we found
substantial variability between subjects (similarly to
the fNIRS Pioneer results reported above) as well as
between channels (i.e., locations in prefrontal cortex).
Locations of the NINScan optodes are shown in
Figure 15.
Figure 15: NIRS channel configuration in this study (facing
subject, so the right hemisphere is on the left, nose is in the
middle and the ears are most lateral). D =Detector,
S=source, and numbered lines represent measurement
channel numbers from specific source-detector pairs
(total=32).
Examining results by channel, we observed
significant increases in HbO
2
from 1- to 2- to 3-back
in two channels (#2 and #8) corresponding to the
border between ventrolateral prefrontal cortex
(vlPFC) and dlPFC in the right hemisphere (mixed
effects regression, grouping by subject, p<0.05). This
same effect was observed in the corresponding
location in the left hemisphere (channel #23; p<0.05).
These were the only channels exhibiting significant
effects of n-back difficulty, although channel #2 did
correspond in location to the more posterior fNIRS
Pioneer sensor position.
In addition to the above, the left hemisphere also
exhibited a significant effect of pre- vs. post-
boredom, where the HbO
2
association with n-back
difficulty was abolished after boredom induction
(p<0.05). This was in contrast to a lack of significance
pre- vs. post-boredom in the behavioural data. The
results, pooled over all n=17 subjects, for channel #2
(right hemisphere) and corresponding #23 (left
hemisphere) appear below (error bars=bootstrapped
95% confidence intervals). Figure 16 shows NINScan
data from right lateral PFC (channel 2), with
progressive increase in HbO
2
pre-boredom. Large
confidence intervals reflect inter-subject variability,
which is substantially compensated for by the mixed-
effects modelling.
Figure 16: NINScan data from right lateral PFC (channel
2), with progressive increase in HbO pre-boredom. Large
95% confidence intervals reflect inter-subject variability,
which is substantially compensated for by the mixed-effects
modelling.
We next analysed data from the MATB tasks.
Similar to n-back, the MATB experimental design
provided three task blocks, differing by task
difficulty. These blocks were always 240-sec long
and presented in the same order: easy, then medium,
then hard. Due to head motion between blocks (as per
n-back), we used the first 5 seconds from each block
as the baseline for that block and computed change in
oxyhemoglobin (HbO
2
), deoxyhemoglobin (HbR)
and total-Hb (tHb) relative to that baseline. Using
mixed-effects linear regression, simple tests of
Difficulty (easy, medium, hard) or Phase (pre- or
post-boredom) were not significant. However, we
also split each 240s block into 10s long segments.
When we included all three factors in the model
(Difficulty, Phase, and Segment) we found that the
activation in certain areas of the brain increased
slowly during the task—typically over the first 1-2
minutes. In addition, modelling this Segment effect
unmasked significant differences in Difficulty and
Phase. Table 3 summarizes the findings across
channels for HbO
2
(findings for HbR were weak due
to the typical 4x poorer signal to noise ratio (SNR);
findings for tHb were stronger). Multiple channels
demonstrated decreased brain function with
increasing difficulty (negative relationship),
particularly right and left vlPFC. The same channels
tended to show decreased brain activation post-
boredom induction relative to pre-boredom. The
positive interactions between phase and difficulty
indicates there was a smaller decrease in brain
activation with increasing difficulty post-boredom
relative to pre-boredom.
Pre-Boredom
Post-Boredom
1-back
2-back 3-back 1-back 2-back 3-back
D[Hb] (uM
)
HbR
tHb
HbO
Validation of the fNIRS Pioneer
TM
, a Portable, Durable, Rugged functional Near-Infrared Spectroscopy (fNIRS) Device
529

Table 3: NINScan HbO
2
concentrations predicted from task
parameters; Chan = channel; Diff = difficulty; Reg =
region; neg = negative relationship; pos = positive
relationship; n.s. = not significant; dlPFC = dorsolateral
prefrontal cortex; vlPFC = ventrolateral prefrontal cortex;
ant = anterior, post = posterior; cent = central.
Chan
Diff
Phase
Phase x Diff
Brain Reg
0
n.s.
neg, p=0.25
n.s.
R post-dlPFC
1
pos, p<0.001
n.s.
neg, p=0.004
R ant-dlPFC
2
neg, p<0.001
neg, p<0.001
pos, p<0.001
R post-vlPFC
3
neg, p<0.001
neg, p<0.001
pos, p<0.001
R ant-vlPFC
8
n.s.
n.s.
pos, p=0.004
R cent- PFC
9
neg, p=0.003
neg, p<0.001
pos, p<0.001
R ant-dlPFC
10
neg, p=0.003
neg, p<0.001
pos, p=0.001
R post-vlPFC
20
n.s.
neg, p<0.001
pos, p<0.001
L ant-dlPFC
21
n.s.
n.s.
n.s.
L post-dlPFC
22
neg, p=0.003
neg, p<0.001
pos, p<0.001
L ant-vlPFC
23
n.s.
neg, p<0.001
pos, p<0.001
L post-vlPFC
28
n.s.
n.s.
n.s.
L ant-dlPFC
29
neg, p=0.028
neg, p=0.003
pos, p<0.001
L cent- PFC
31
neg, p=0.004
neg, p<0.001
pos, p<0.001
L post-vlPFC
In addition to examining the relationship between
brain activation and task parameters, we examined
the relationship between brain activation and MATB
task performance. Being a complex, multi-
component task, “performance” was first reduced to
a summary score for Tracking and Resource
Monitoring, and then these were further reduced to a
single overall (scalar) metric. A summary across all
channels appears in Table 4.
Table 4: NINScan HbO
2
concentrations predicted from
behavioural metrics; Chan = channel; Track = tracking task;
Resource = resource management task; neg = negative
relationship; pos = positive relationship; n.s. = not
significant; dlPFC = dorsolateral prefrontal cortex; vlPFC
= ventrolateral prefrontal cortex; ant = anterior, post =
posterior; cent = central.
Chan
Track
Resource
Overall
(w/ time)
Brain Reg
0
neg, p<0.001
neg, p=0.007
neg, p<0.001
R post-dlPFC
1
n.s.
neg, p=0.035
neg, p=0.001
R ant-dlPFC
2
n.s.
neg, p<0.001
n.s.
R post-vlPFC
3
neg, p=0.028
neg, p<0.001
neg, p<0.015
R ant-vlPFC
8
n.s.
n.s.
n.s.
R cent- PFC
9
neg, p=0.01
n.s.
n.s.
R ant-dlPFC
10
neg, p=0.035
neg, p=0.011
n.s.
R post-vlPFC
20
n.s.
n.s.
n.s.
L ant-dlPFC
21
n.s.
n.s.
n.s.
L post-dlPFC
22
n.s.
neg, p<0.001
n.s.
L ant-vlPFC
23
neg, p<0.001
neg, p=0.03
neg, p<0.001
L post-vlPFC
28
neg, p<0.001
n.s.
neg, p=0.006
L ant-dlPFC
29
n.s.
n.s.
n.s.
L cent- PFC
31
neg, p<0.001
neg, p<0.001
neg, p<0.001
L post-vlPFC
In all cases, the significant HbO
2
findings were
negative relationships, indicating less brain activation
with better performance. While prior literature of
functional brain imaging with MATB is not available,
this finding is at least broadly consistent with the role
of lateral PFC’s role in working memory maintenance
and error-detection. Findings were primarily in left
vlPFC and right dlPFC. Note that for our NINScan
data, positive relationships were consistently
observed for HbR—consistent with a change in brain
activation rather than a change in brain blood flow or
volume—but the HbR changes almost universally
failed to reach significance, perhaps due to lower
sensitivity to HbR given our 780nm laser wavelength
(Strangman et al., 2003). The overall metric by itself
resulted in only two significant effects, in right
posterior-dlPFC and left posterior-vlPFC. As with n-
back, however, when including Segment as a factor
variable in the analysis in place of just the overall
activity level during each block), more channels
exhibited significant changes in brain activation (see
Table 4).
4 CONCLUSIONS
In this study we validated a small, portable fNIRS
sensor (the fNIRS Pioneer ™) against a larger sensor
with coverage of a larger cortical area, the NINScan
developed at Massachusetts General Hospital. We
used a gold-standard working memory task (n-back;
(Kirchner, 1958)) and a more complex multi-attribute
task battery (MATB) (Santiago-Espada et al., 2011).
As expected, on the n-back task we found a
significant effect of difficulty level on dlPFC HbO
2
(p<.01), but not medial PFC HbO
2
with the fNIRS
Pioneer. For the NINScan, we observed increases in
HbO
2
from 1- to 2- to 3-back in two channels
corresponding to the border between ventrolateral
PFC (vlPFC) and dlPFC in both hemispheres (p<.05).
When we aggregated MATB data across subtasks,
and after accounting for time-on-task, we found a
significant (p<.01) effect on HbO
2
for the Pioneer and
the NINScan. In all cases, the significant HbO
2
findings were negative relationships, indicating less
brain activation with better performance. While prior
literature of functional brain imaging with MATB is
not available, this finding is broadly consistent with
the role of lateral PFC’s role in working memory.
This indicates that both the fNIRS Pioneer and the
NINScan sensor, when combined with appropriate
data analytic techniques were useful for detecting
changes in HbO
2
that correlate with cognitive
workload and behaviour, and that the fNIRS Pioneer
RAIDERS 2019 - Special Session on Real-world Assessment of Individuals During Everyday Routines
530

is able to assess cognitive workload similarly to
larger, more expensive, and more established devices.
ACKNOWLEDGEMENTS
This work was supported by NASA Contract Nos.
NNX15CJ17P and NNX16CJ08C.
REFERENCES
Ayaz, H., Shewokis, P. A., Bunce, S., Izzetoglu, K.,
Willems, B., & Onaral, B., 2012. Optical brain
monitoring for operator training and mental workload
assessment. NeuroImage, 59(1), 36–47.
https://doi.org/10.1016/j.neuroimage.2011.06.023.
Bracken, B. K., Elkin-Frankston, S., Palmon, N., Farry, M.,
& de B Frederick, B., 20170. A System to Monitor
Cognitive Workload in Naturalistic High-Motion
Environments.
Bracken, B., Romero, V., Guarino, S., & Pfautz, J., 2013.
Designing an Adaptive Approach for the Real-Time
Assessment and Augmentation of Performance of
Cyber Analyst Teams. In Proceedings of the Human
Factors and Ergonomics Society Annual Meeting (Vol.
57, pp. 124–128). SAGE Publications Sage CA: Los
Angeles, CA. Retrieved from http://journals.sagepub.
com/doi/abs/10.1177/1541931213571029.
Braver, T. S., Cohen, J. D., Nystrom, L. E., Jonides, J.,
Smith, E. E., & Noll, D. C., 1997. A parametric study
of prefrontal cortex involvement in human working
memory. Neuroimage, 5(1), 49–62.
Bunce, S. C., Izzetoglu, K., Ayaz, H., Shewokis, P.,
Izzetoglu, M., Pourrezaei, K., & Onaral, B., 2011.
Implementation of fNIRS for Monitoring Levels of
Expertise and Mental Workload. In D. D. Schmorrow
& C. M. Fidopiastis (Eds.), Foundations of Augmented
Cognition. Directing the Future of Adaptive Systems
(Vol. 6780, pp. 13–22). Berlin, Heidelberg: Springer
Berlin Heidelberg. https://doi.org/10.1007/978-3-642-
21852-1_2.
Cao, A., Chintamani, K. K., Pandya, A. K., & Ellis, R. D.,
2009. NASA TLX: Software for assessing subjective
mental workload. Behavior Research Methods, 41(1),
113–117.
Comstock, J. R., & Arnegard, R. J., 1992. MAT: Multi-
Attribute Task Battery for Human Operator Workload
and Strategic Behavior Research. NASA Technical
Memorandum, (January).
Hart, S. G., & Staveland, L. E., 1988. Development of
NASA-TLX (Task Load Index): Results of empirical
and theoretical research. Advances in Psychology, 52,
139–183.
Kirchner, W. K., 1958. Age differences in short-term
retention of rapidly changing information. Journal of
Experimental Psychology, 55(4), 352.
Leather, C., Palmon, N., Bracken, B.K., 2018. Continuous
workload assessment and combined metrics of
performance on the multi-attribute task battery.
Presentation at the International Conference on
Applied Human Facotros and Ergonomics (AHFE)I,
July 2018.
Markey, A., Chin, A., Vanepps, E. M., & Loewenstein, G.,
2014. Identifying a reliable boredom induction.
Perceptual and Motor Skills, 119(1), 237–253.
McKendrick, R., Parasuraman, R., & Ayaz, H., 2015.
Wearable functional near infrared spectroscopy
(fNIRS) and transcranial direct current stimulation
(tDCS): expanding vistas for neurocognitive
augmentation. Frontiers in Systems Neuroscience, 27.
https://doi.org/10.3389/fnsys.2015.00027.
Nelson, J., 2016. The Development of a Human Operator
Informatic Model (HOIM) Incorporating the Effects of
Non-Invasive Brain Stimulation on Information
Processing while Performing Multi-Attribute Task
Battery (MATB).
Santiago-Espada, Y., Myer, R. R., Latorella, K. A., &
Comstock Jr, J. R., 2011. The multi-attribute task
battery ii (matb-ii) software for human performance and
workload research: A user’s guide.
Strangman G, Franceschini MA, Boas DA, 2003. Factors
affecting the accuracy of near-infrared spectroscopy
concentration calculations for focal changes in
oxygenation parameters. Neuroimage 18:865-879.
Strangman GE, Ivkovic V, Zhang Q, 2018. Wearable brain
imaging with multimodal physiological monitoring. J
Appl Physiol (1985) 124:564-572.
Validation of the fNIRS Pioneer
TM
, a Portable, Durable, Rugged functional Near-Infrared Spectroscopy (fNIRS) Device
531
