
Radiotherapy Support Tools, the Brazilian Project: SIPRAD
Diego Fiori de Carvalho
1
, José Antonio Camacho Guerrero
1
, Luis Javier Maldonado Zapata
1
,
Andrey Omar Mozo Uscamayta
1
, Heleno Murilo Campeão Vale
1
, Leandro Federiche Borges
2
,
Alexandre Collelo Bruno
2
and Harley Francisco de Oliveira
2
1
I-medsys, Innovative Medical Systems, Ribeirão Preto, São Paulo, SP, Brazil
2
Clinical Hospital at Ribeirao Preto, University de Sao Paulo, USP HCRP, SP, Brazil
Keywords: Radiotherapy, RTPS, SIPRAD, Portal 2D, the Fusion of Images.
Abstract: The radiotherapy planning process (teletherapy) is initially performed by the acquisition of Computed
Tomography images of the areas of interest to guide a series of health professionals in the work of vector
design of regions of interest for protection (risk organs) and radiation (tumors). All these steps are
performed using computational tools that extrapolate measurements and scales in the treatment plan. The
efficiency of the treatment depends on the recreation of the patient's positioning on the linear accelerator
stretcher with the previously acquired tomography images. For this, in this article, we present three modules
of the SIPRAD (Information Systems for Radiation Therapy Planning) project. With the name of
Radiotherapy Portal it is able to perform a fusion of planar images of the target region, made on the day of
treatment, with the digital recreation (DDR - Digital Reconstructed Radiographs) of this radiograph
generated from the Tomography of treatment planning, aiming to improve the reproducibility of the
positioning that the radiation dose delivered during all the radiotherapy treatment. The second module
named by LYRIA PACS RT provides a client/server architecture for storing, distributing and displaying
images from any systems using the DICOM RT Struct, Image, Plan and Dose modes. The third module
called Contouring is responsible for the training of new radiotherapists.
1 INTRODUCTION
There are several difficulties in radiotherapy
planning in latin american because few hospitals
have solutions that have a complete planning system
for the radiotherapy treatment.
In Brazil cancer treatment reality patients who
treat in the public system, only 16% start the
procedure within 30 days; the average waiting time
is 113.4 days. According to the Brazilian National
Nuclear Energy Commission (CNEN), there are 371
linear accelerators (LINAC) in operation in Brazil,
of which 260 are in the public health network. This
means that there is at least a 40% shortage in the
supply of machines. 55% of LINACs are located in
only 4 states (27 states in all), 70% is the average
yield of a LINAC due to a lack of professionals and
maintenance and operation processes (SBRT, 2018).
Besides the lack of LINACs, another problem is
related to a shortage on expert systems linked to the
Brazilian reality of treatment.
The patients' positioning and location of the
target regions (tumors) at the time of treatment,
which is fundamental in the efficacy of the
treatment, is carried out in an artisanal manner. In
some hospitals (at least 80%), it is attempted to
guarantee the reproducibility of the positioning
through the use of molds, and ink markings, as a
kind of tattoo for temporary marking of the correct
region of radiation application. Recently the Federal
Council of Medicine has chosen to recommend the
use of radiotherapy planning software generating
demand for this solution. It was necessary to build a
solution to increase the accuracy and improvement
of the radiotherapy treatment process in public and
private hospitals in Brazil, creating a robust product
and cost alternative with the Latin American reality
for such systems. The SIPRAD project (Information
Systems for Radiotherapy Planning) aims to build a
series of software for this urgent Brazilian need to
evolve the demarcation process and improve
treatment.
Fiori de Carvalho, D., Guerrero, J., Zapata, L., Uscamayta, A., Vale, H., Borges, L., Bruno, A. and Francisco de Oliveira, H.
Radiotherapy Support Tools, the Brazilian Project: SIPRAD.
DOI: 10.5220/0007482901370143
In Proceedings of the 12th International Joint Conference on Biomedical Engineering Systems and Technologies (BIOSTEC 2019), pages 137-143
ISBN: 978-989-758-353-7
Copyright
c
2019 by SCITEPRESS – Science and Technology Publications, Lda. All rights reserved
137
In addition to creating a unique architecture on
the regional scene, SIPRAD is interested in building
interoperable systems with all linear accelerators
(LINAC) in the market as well as its proprietary
planning systems. Thus, communication between all
the radiotherapy treatment workflow entities are
integrated and operating together.
The SIPRAD project is currently in final
development, with tests in Brazilian hospitals. Some
modules are under analysis by local and
international health surveillance certifiers.
Among the SIPRAD solutions that were
developed: a contour design application, a PACS
RT, a radiological scheduling system integrated to
the RRIS radiotherapy and the Radiotherapy Portal.
For a 2D Portal system, the digital radiographic
image (portal image) is acquired from each patient
before the moment of radiotherapy treatment. The
portal image is then fused with a reconstructed
digital radiograph from the anterior tomography
allowing for corrections of its positioning (Maria Y
Law, 2009).
2 SIPRAD
The SIPRAD (Information Systems for
Radiotherapy Planning) is a tool for managing and
controlling the flow of radiotherapy treatment.
Provide an intuitive and efficient way to define all
steps of components suitable for a public or private
clinic or hospital (Carvalho, 2018).
SIPRAD has access via patient data entry and
Computed Tomography scan in the axial plane. The
system stores the system inputs and presents
specialized interfaces for each type of end user
according to their needs. From a computational
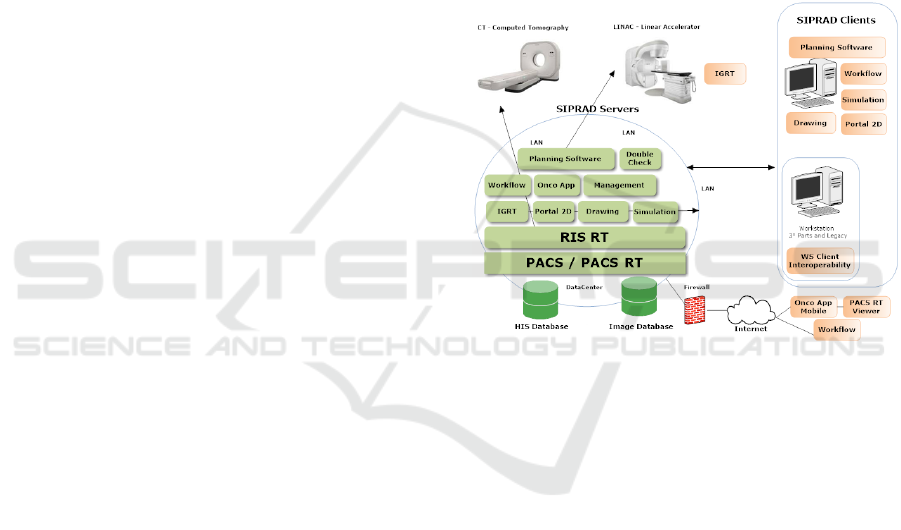
architecture point of view, SIPRAD can be
presented separately as a Client/Server (front
end/back end) system. The green parts in Figure 1
represent the back-end (server-side) solutions, while
the pink solutions are front-end (client-side)
solutions. For each service offered to medical or
patient clients, there is a specialized server
containing services hosted in clinics, hospitals or
data centers (cloud). On the back end side, we have
the RIS RT and Lyria PACS RT (Radiology
Information System for Radiotherapy) that are
directly connected to the workflow module. The 2D
Portal and IGRT are fundamental for the
improvement of the accuracy/quality in the
radiotherapy sessions. The Plotting and Simulation
tools are linked directly to the Contours module. The
Planning and Management Software is already
linked to the planning and management modules
respectively. Also, finally, the Onco APP is a way of
accessing patients to the critical items of their
treatment. The Onco APP is an extension of the
workflow module aimed at a restricted view of
information within the interest of the user to the type
of patient.
The system stores the inputs and presents
specialized interfaces for each type of end user
according to their needs. To facilitate its
interoperability and communication actions the
DICOM (DICOM, 1999) standard is used. More
specifically the DICOM RT (Maria Y. Law, 2009)
standards that are used: Dose, Plan, Image, and
Struct.
Figure 1: Architecture of SIPRAD.
For better understanding and separation of the
DICOM RT storage actions, the SIPRAD was
divided into four modules. The four modules of
SIPRAD are Workflow, Contours, Planning, and
Management. Workflow is the largest module; it is
present in practically the entire SIPRAD solution.
The Workflow module has the role of extracting the
patient data from the Hospital/Clinic worklist by
using the Lyria PACS (Carvalho, 2015) worklist
solution and creating interfaces of all the system
registries, including those of patients. It also
monitors the patient during the treatment process at
the hospital and brings their agenda of radiotherapy
appointments and sessions, also allows patient event
logs and reports. Workflow actions are stored in
SQL like database.
The Contour module has DICOM with Query
/Retrieve communication with Lyria PACS
(Carvalho, 2015) and performs Computed
Tomography scans (CTs) of the patient making them
available, through a specialized interface, the
BIOIMAGING 2019 - 6th International Conference on Bioimaging
138
contouring of the areas of interest (GTV –Gross
tumor Volume, CTV- Clinical Tumor Volume, and
PTV - Planning Tumor Volume) and OARs (Organs
at Risk). After the delimitation of these important
structures for their treatment, the data is transferred
to the Planning module.
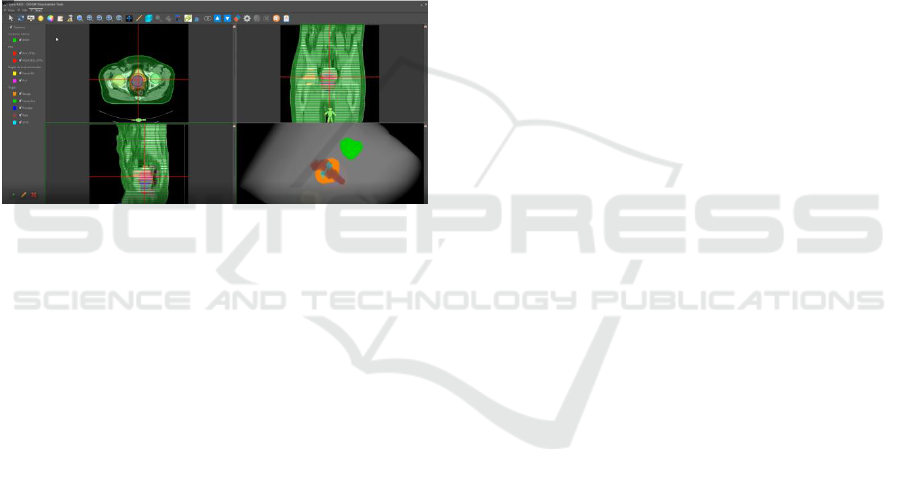
The Planning module is responsible for the
creation of Isodoses, BEV (Beam Eye View), DVH
graphs (Dose Volume Histogram), and areas to be
irradiated in the radiotherapy treatment. Still, in the
Planning module, the user has a friendly interface
available that interacts with 3D objects to facilitate
the process. It also has the possibility of printing
data for the assignment to the corresponding person
in charge according to the process of the institution.
In Figure 2, you can view the layout of the Contours
module.
Figure 2: Contours Module Delimitation System.
In Figure 2, we can visualize the interface of the
delimitation system; basically, we have a Computed
Tomography scan that doctors and physicists
perform the generation of contours of areas of
interest utilizing specialized delimitation tools which
generate vectors. The Management module is
responsible for the creation of molds and filters that
are inserted in the particle or linear accelerator
(LINAC). This module is also responsible for
communicating with the linear accelerator to
perform the exam. It is also possible to send data to
the radiologist technician who performs the
treatment session, such as the table position in X, Y,
Z, and gantry angle of irradiation of the apparatus.
3 2D PORTAL
3.1 Marking Process
Before and on a weekly basis during the treatment,
2D orthogonal (anterior-posterior and lateral-lateral)
radiographic images of the target region are
acquired. The images are acquired with Cross-Hair,
an accessory that generates a scale with the origin at
the center of the target and provides real
magnification, recorded with patient information and
saved in DICOM format. The same coordinate axis
scale is generated digitally in the digital
reconstruction of the orthogonal 2D radiographic
images (DRR). These scales are of fundamental
importance for the process of comparison of the
radiographic images, since the coincidence of the
origin of the scales, the relative distances of the bone
structures with the scales are the same parameters
used to confirm the exact reproducibility of the
location with the planning, this is maintained during
treatment. As the radiotherapy today is mostly
isocentric (the target lies in the center of the axis of
rotation, and the radiation source is around the
patient) the comparison of orthogonal 2D
radiographic images with the reconstruction of the
same from the planning tomography (DRR),
increase the accuracy of planning reproducibility
based on bone marking. The overlapping of these
images (radiographs and DRRs) through a digital
fusion facilitates the comparison of them by the
responsible doctor. This analysis is based on the
coincidence of the coordinate axis scales, with the
DRR being the reference image for the comparison.
The time for demarcation and analysis with this
tool facilitated the process and increased accuracy. It
is estimated that 28% of the time was gained with a
60% increase in accuracy for testing in 100 adult
patients.
3.2 Computer Tool
Initially, for better control of the axial, sagittal and
coronal images of the project, it was necessary to
implement the MPR algorithm (Multiplanar
Reconstruction), enabling the 2D Portal to generate
new planes interpolated from the default axial plane
from the acquired tomography examination. This
computational process of generation of new
interpolated planes has algorithmic complexity O
(n³). Thus, it was necessary, the implementation of
computational parallelism routines with adapted
programs to be processed to user threads in Java.
Once the MPR was stabilized, the stage of fusion
of radiological images implemented according to the
needs of the medical team was carried out, in order
to facilitate the patient's positioning and image
acquisition process at the time of planning, thus a
specialized interface was developed to perform
fusions images (CRs, DRs, and DXs) with
Computed Tomography (CTs) images. In Figure 3,
we can visualize the interface created for this action;
we can visualize in “A” the target with the sagittal
Radiotherapy Support Tools, the Brazilian Project: SIPRAD
139
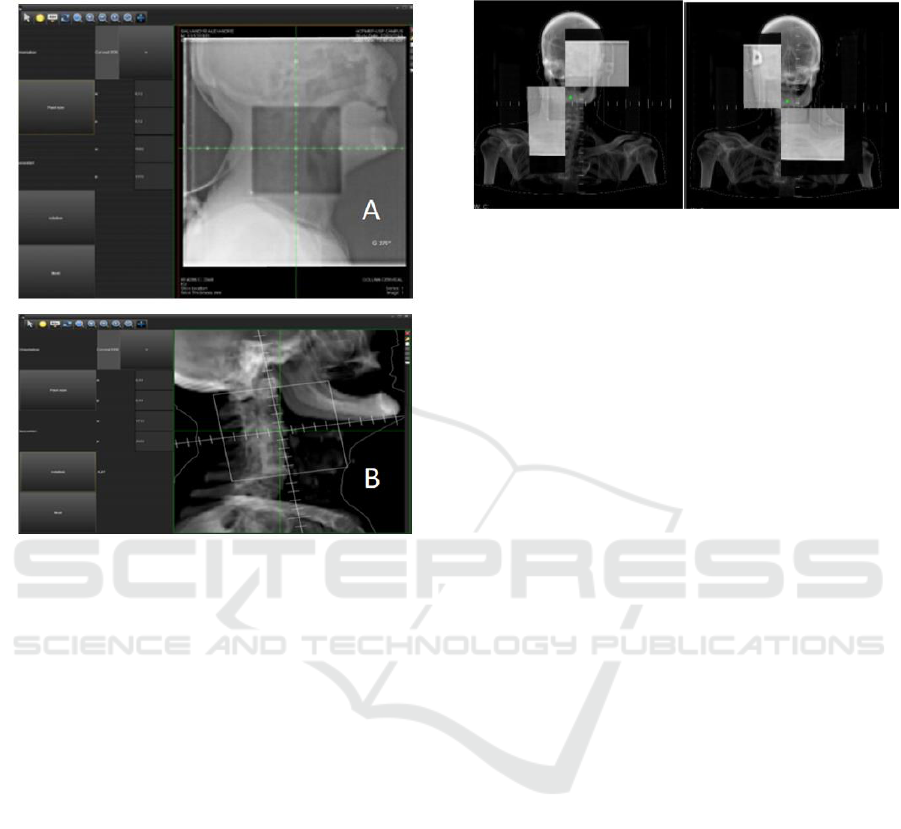
positioning of a head/neck x-ray with the patient
already in the radiotherapy position.
Figure 3: Fusion of X-ray Images and DRR (Computed
Tomography).
In "A" of Figure 3, the dark rectangular region
corresponds to the holes of the lead block in the
positioning present in the gantry of the linear
accelerator. In this phase, it is important to calibrate
the quantity and pixel positioning of the DRR
(Digitally Reconstructed Radiographs) image scale.
In "B" of Figure 3, we can see a rotation of the block
concerning the sagittal plane. The user can rotate,
translate, zoom in and out to make it easier to
position.
To facilitate the visualization of two different
images in real time, a matrix visualization feature
(2x2) was created in which the main or secondary
diagonal is chosen to visualize the image that is in
the bottom layer; we call this action of "Fusion
Division". These options facilitate the change of
transparency between the overlaps made in the
fusion processes. From the mouse actions, half of
the DRR (the lightest region) and the remainder of
the standard radiography (darker region) are
visualized as shown in Figure 4.
After conferencing this placement, the system
reports the differences of distances in millimeters
between the (virtual) study model and the (actual)
patient at the moment before the radiation. In this
way, the technician can adjust the patient in the
correct position to be irradiated in LINAC.
Figure 4: Transparency matrix view for merged images.
4 LYRIA PACS RT
Strong customer demand on the national scene, and
not contemplated by any market solution currently,
refers to obtaining a PACS RT. This type of system
is independent of the architecture acquired by the
clinic or hospital that has radiotherapy services, as it
does the storage, viewing, and distribution of the
examinations of any system brands as long as they
work with the standard DICOM RT. More
specifically, the Lyria PACS RT (Picture Archiving
Communication System for Radiotherapy Planning)
is an extension of the Lyria PACS system (Carvalho,
2015) and works on the backend side (server)
responsible for the following services:
1. Storage of DICOM RT (Thiruchelvam, 2005)
images in magnetic or optical media;
2. Connections for health services and informatics
departments (HL7, XML, SGBDs via web services,
and others);
3. Recovery of images in the short or long term;
4. Viewing images in remote diagnostic stations;
View of DICOM RT (DICOM RT, 1997) structures
in a simplified and responsive universal
environment, in this case, web.
5. Image-friendly interfaces (Web and desktop
clients);
6. Fast and secure communication via computer
networks;
7. Patient Worklist Service and communication with
other equipment;
8. Interoperability for other systems through the use
of Web Services;
The C-ECHO SCP / SCU (ping) and C-STORE
SCP / SCU (storage) protocols are obtained directly
from Lyria PACS (Carvalho, 2015). Also, it was
necessary to extend the DCM4CHEE (Max, 2007)
library in the Java programming language by
BIOIMAGING 2019 - 6th International Conference on Bioimaging
140
determining a storage hierarchy of the DICOM RT
structures of the project on the servers.
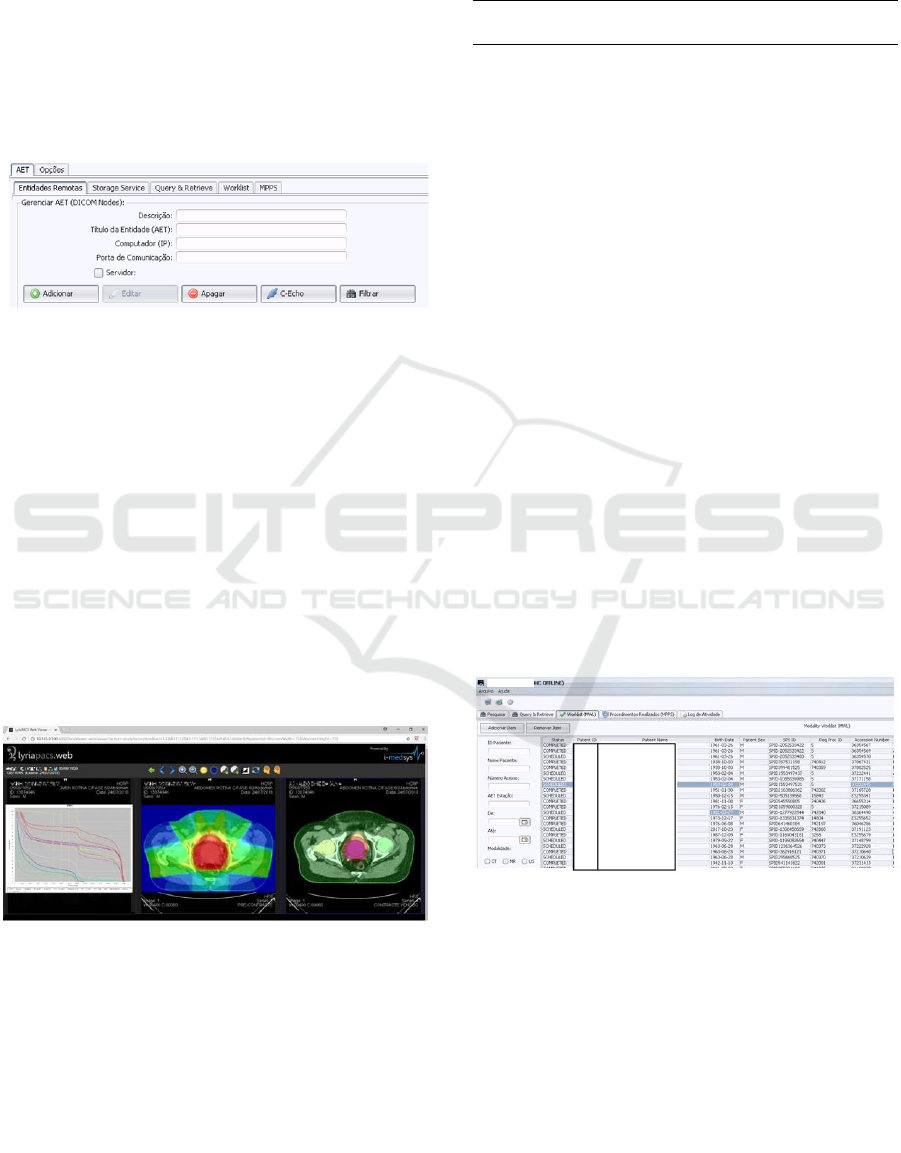
The implementation of item 2 was performed via
integration with a SQL like database. The creation of
the resource of item 3 was done through a service
called Query/Retrieve, where we can create DICOM
entities called AETitles that have an IP (Internet
Protocol) and a port registered in the database. An
example of this action can be seen in Figure 5. In
this process, the equipment can exchange exams and
content information with each other.
Figure 5: SIPRAD project worklist integrating RIS RT and
PACS RT.
The implementation of items 4 and 5 occurred
with the integration of the SIPRAD contour interface
to search for exams with the DICOM RT protocol
(Maria Y Law, 2009). Item 5 refers to the friendly
PACS server interfaces, an example of the PACS RT
web interface can be seen in Figure 3. This web
interface is only for reading and manipulating PTZ
(Pan, Translate and Zoom). In Figure 3, it is possible
to visualize the main phases of the radiotherapy
treatment performed by the VARIAN Eclipse or
Aria system. This exam presented in Figure 6 was
obtained from the integration with a VARIAN server
of the HCRP (Hospital das Clinicas de Ribeirão
Preto).
Figure 6: Lyria PACS RT web interface.
In Figure 6, we can visualize on the left side the
DVH (Dose/Volume Histogram) graph in the center,
a tomography with the isodoses curves and the right
the structures plotted on a tomography in the axial
plane. To perform the visualization of structures, it
was necessary to parser many proprietary tags, in
addition to the tags common to the DICOM RT
standard. Two examples of proprietary tags from the
Finnish company VARIAN can be seen in Table 1.
Table 1: Proprietary tags.
Tag
VR
Data
(3285,0
010)
LO
[0034] [Varian Medical Systems
VISION 3285] Private Creator
Data Element
(3285,1
000)
UM
[0066][\FE\FF\00\E0:\00\00\00\852\
10\00"\00\00\00 Varian Medical
Systems VISION 3285\852\
01\10\08\00STANDARD]
In TCP / IP communication between servers and
computers is done using the RESTful API and
HTTPS protocols in user authentication (item 6).
Figure 7 shows a complete worklist (item 7)
implemented for the HCRP hospital structure, where
it is possible to see a list of anonymous patients.
This worklist is generated in the morning of the day
containing the schedules of patients obtained from
the Workflow module. After the list is generated, it
is sent to the radiological acquisition equipment and
linear accelerators that are registered as DICOM
entities. Item 8 refers to interoperable integration
with other systems made according to the DICOM
standard version 3.0.
This system-to-system communication
functionality is paramount for PACS RT testing in
clinics and hospitals communicating with RIS and
HIS (Hospital Information System) systems.
Figure 7: Worklist of Lyria PACS RT.
5 CONTOURING TRAINING
TOOL
The contouring training tool is a version of RTPS
capable of measuring the degree of similarity
between a contour performed by a student and
another contour created by an experienced doctor
(teacher). Figure 8 shows the process of a typical
Radiotherapy Support Tools, the Brazilian Project: SIPRAD
141
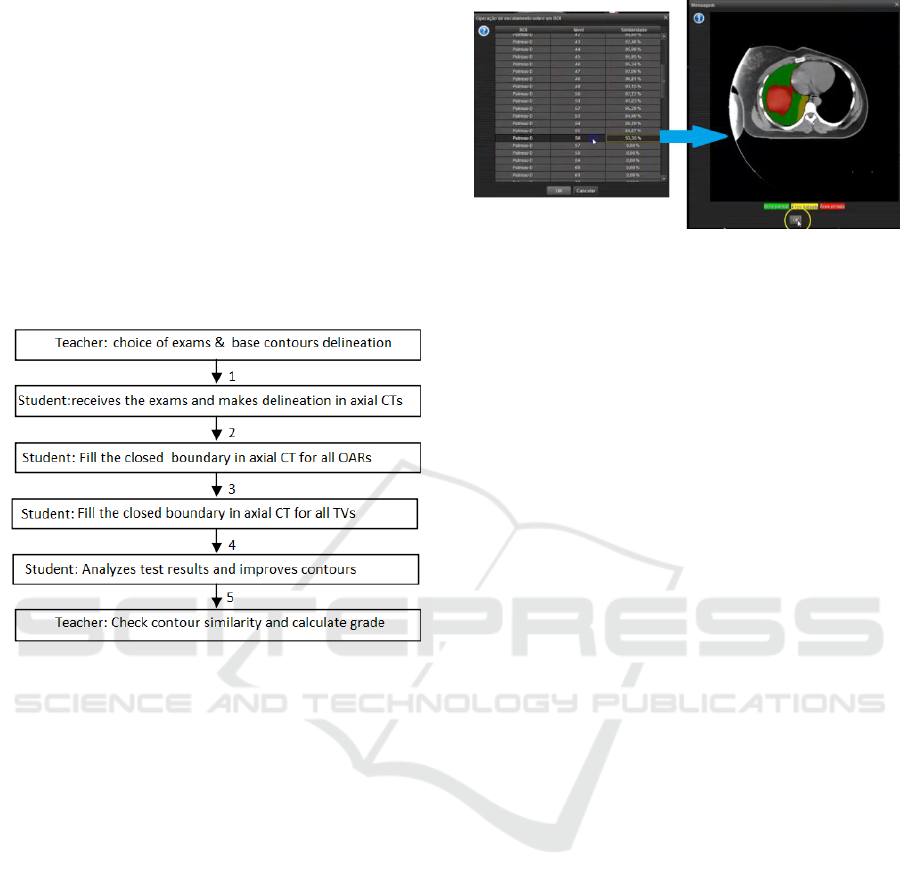
test using the Training Contour Tool. In the first step
is to teacher choose exams to determine the contours
of OARs and TVs. After that, the teacher draws the
contours of the answer sheet. In the second step,
student's log in the system to create free contours in
the axial CT. In the third step, these students create a
fill contour for all OARs. In the fourth step, the
students create the drawings and fill of the TVs.
In the fifth step, the student analyzes his result in the
tool and can improve contours for only 2 times
(evaluation rule). Finally, in the last step, the tool
will generate students’ contours similarities and
calculate the student´s grade.
Figure 8: Process Tests Tool Contours.
In the process the Jaccard index is used, also
known as the Jaccard's coefficient of similaritiy, is a
statistical component to compare similarity and
diversity between two sets. The Jaccard index is
defined by the size of the intersection of two sets,
divided by the size of the union of the same sets
(Jaccard, 1901).
In this study it was used a structure (ROI)
represented by a set of spatial points (x, y, z). These
points are drawn in each axial section of the CT.
Each structure is represented by a set of many spatial
points, where each subset belongs to each cut of the
digital tomography. Each subset is represented by a
set of spatial points that form a convex figure
representing only the outline of the ROI structure.
The Figure 9 presents the Jaccard index in left and
the image results in right. The green region refers to
the area that the student did correctly, the yellow
region refers to the area that the student did not
draw. And the red region refers to the area that the
student has drawn wrong.
Figure 9: Training Contour Tools Interface.
6 CONCLUSIONS
The 2D Portal SIPRAD demonstrated precision in
the determination of the displacements from the
fusion when tested at Clinical Hospital at Ribeirao
Preto (HCRP-USP), and it found greater agreement
among the users on the positioning of the patient
when compared to the fusion with visual analysis.
Further testing with experts is required to verify the
accuracy of the process by comparing the results
with the existing models.
The Lyria PACS RT and Training contour tool is
currently being tested in two hospitals in the state of
São Paulo (INRAD in the capital and HCRP in the
interior) and an Australian cancer hospital (Illawarra
Cancer Care Center). Both hospitals have equipment
and systems from the VARIAN and ELEKTA
companies.
The SIPRAD project is currently in final
development, with tests in Brazilian hospitals. Some
modules are under analysis by local and
international health surveillance certifiers.
The cost of SIPRAD will be approximately USD
$10.000 for the basic solutions of the radiotherapy
planning process according to SUS (Brazilian Public
Health System).
In these tests, we will be able to analyze the
operational data loads in a real environment to be
presented in future work.
ACKNOWLEDGEMENTS
Clinical Hospital at Ribeirao Preto (HCRP),
University of Sao Paulo and FAPESP, Process
2016/19854-8.
BIOIMAGING 2019 - 6th International Conference on Bioimaging
142

REFERENCES
Carvalho D. F, Camacho J. A., Azevedo-Marques, P. M.,
Macedo, A. A. Lyria PACS A case study saves ten
million dollars in a Brazilian Hospital, 2015 IEEE
28th International Symposium on Computer-Based
Medical Systems, 326- 329, June 2015.
Carvalho, D. F, Uscamayta A. O, Vale H. M. C.,
Camacho-Guerrero J. A.,Oliveira H. F. SIPRAD: A
Radioherapy Planning System (RTPS), 2018 IEEE
31st International Symposium on Computer-Based
Medical Systems (CBMS),
10.1109/CBMS.2018.00081, June 2018.
DICOM Digital Imaging and Communications in
Medicine (DICOM) Supplement 29: Radiotherapy
Treatment Records and Radiotherapy Media
Extensions, 1999.
DICOM RT Supplement. Final Text, 4 June 1997 i.
TABLE OF CONTENTS. Part 3 Addendum
Radiotherapy Information Object Definitions.
Jaccard, P. Étude comparative de la distribution florale
dans une portion des Alpes et des Jura, Bulletin de la
Société Vaudoise des Sciences Naturelles, 1901, 37:
547–579.
Maria Y. Y. Law, Brent Liu. Informatics in Radiology
DICOM-RT and Its Utilization in Radiation Therapy.
RadioGraphics 2009, 29:655–667.
10.1148/rg.293075172.
Max J. Warnock, Christopher Toland, Damien Evans, Bill
Wallace, and Paul Nagy Benefits of Using the
DCM4CHE DICOM Archive, J Digit Imaging. 2007
Nov; 20 (Suppl 1): 125–129. 10.1007/s10278-007-
9064-1.
SBRT, Brazilian Society Radiotherapy, Report in
interview: Arthur Accioly Rosa, July 2018.
Thiruchelvam, N., Mostafid, H. and Ubhayakar, G.
(2005), Planning percutaneous nephrolithotomy using
multidetector computed tomography urography,
multiplanar reconstruction and three-dimensional
reformatting. BJU International, 95: 1280–1284.
doi:10.1111/j.1464-410X.2005.05519.x.
Radiotherapy Support Tools, the Brazilian Project: SIPRAD
143
