
Automatic Nuclei Detection in Histopathological Images based on
Convolutional Neural Networks
Roaa Safi Abed Alah
1
, Gokhan Bilgin
1,2 a
and Abdulkadir Albayrak
1,2 b
1
Dpt. of Computer Engineering, Yildiz Technical University, 34220 Istanbul, Turkey
2
Signal and Image Processing Laboratory (SIMPLAB), Yildiz Technical University, 34220 Istanbul, Turkey
Keywords:
Nuclei Detection, Histopathological Images, FCM Algorithm, Convolution Neural Networks, Deep Learning.
Abstract:
Analysis of cells in histopathological images with conventional manual methods is relatively expensive and
time-consuming work for pathologists. Recently, computer aided and facilitated researches for the diagnostic
algorithms have obtained a high significance to assist the pathologists to extract cellular structures. In this pa-
per, we are compering the conventional fuzzy c-means (FCM) clustering method with the proposed automated
detection system based on Tiny-Convolutional Neural Network (Tiny-CNN) to detect center of nucleus in
histopathological images, Also, in this study, we are tried to find center of nucleus by combined unsupervised
method (FCM) with supervised method (Tiny-CNN). Briefly, First step, nuclei centers are detected with FCM
algorithm which is applied as a clustering-segmentation method to perform segmentation of nucleus cellular
and nucleus non-cellular structure to find the correct center of nuclei. Second step, the deep learning method
is used to detect center of nucleus based automated method. Afterward, combined each of these individual
methods to evaluate our model for extracting the center of nucleus on two different data set the University of
California Santa Barbara’s UCSB-58 data set and data set University of Warwick’s CRC-100 data set.
1 INTRODUCTION
Histopathological image analysis has various chal-
lenges, especially in nucleus detection. The devel-
opments in techniques that have been occurred in this
area can be a valuable assistance to the accurate di-
agnosis pathologically. However, it is still harder to
reach more details without solving the main compli-
cated issues in cellular structures especially the clut-
tering problem in tissue (Moita et al., 2018). The
cellular structure analysis is significant in patholog-
ical diagnoses of breast cancer which depends on cell
analysis separately (Albayrak and Bilgin, 2016).
Traditionally, seed detection is a classical problem
of computer vision for the conventional of histopatho-
logical images. New researches have implemented
conventional methods various ways of deep learning
scenarios, and scenarios connecting both methods. A
graph-cut methods took the place by multi-scale fil-
tering (LoG), adaptive scale selection, and a second
graph-cut operation (Al-Kofahi et al., 2010). Nu-
cleus detection in recent year, using of pre-processing
a
https://orcid.org/0000-0002-5532-477X
b
https://orcid.org/0000-0002-0738-871X
morphological methods assists to smooth and re-
move non-nuclei objects from input images. Gen-
eralized LoG filters and mean-shift clustering were
employed to detect nuclei seeds centers and false
nucleus were removed by adaptive thresholding (Xu
et al., 2017). Apply of generalized LoG (gLoG) filters
to develop correctly guess of nucleus shape detector
performance and used watershed segmentation tech-
nique to separate nucleus and count cells (Kong et al.,
2013).The domain of FCM for detecting nucleus posi-
tions of feature similarity index measure FSIM is used
as seeds for segmentation,this method is started with
FCM clustering and then using FSIM based template
matching approach for nucleus detection. FCM in
probabilistic model and a derivation of an algorithm
for FCM clustering which is supplied expanded abil-
ity through the conventional FCM (John et al., 2016).
This study which is known as Bayesian Fuzzy Clus-
tering that has extended each of variable number of
clusters and a particle filters dedicated technique to
evaluate the model parameter included the number of
clusters (Glenn et al., 2015). Detection of nuclei in
an automated methods of histopathological images is
represented as a good method. Especially, in recent
year with development in machine learning methods
Alah, R., Bilgin, G. and Albayrak, A.
Automatic Nuclei Detection in Histopathological Images based on Convolutional Neural Networks.
DOI: 10.5220/0007484301930200
In Proceedings of the 12th International Joint Conference on Biomedical Engineering Systems and Technologies (BIOSTEC 2019), pages 193-200
ISBN: 978-989-758-353-7
Copyright
c
2019 by SCITEPRESS – Science and Technology Publications, Lda. All rights reserved
193

which is displayed an effective way of detecting a cell
in an image by predicting for each pixel location. One
of these methods has discovered the location of each
pixel that is the monotonous function of the distance
to evaluate the closest cell to the center. Then the cell
center can be specified by extracting local extremism
of the predicted values (Kainz et al., 2015). While
Stacked Sparse Autoencoder (SSAE) method is pre-
sented to solve the complexity of automated nuclei
detection. A deep learning method is applied to detect
an effective nuclei on high-resolution histopathologi-
cal images of breast cancer which is learning high-
level features in just one-pixel intensity to recognize
distinctive features of nucleus with a good results
(Xu et al., 2016). Authors have proposed a method
based on convolution neural networks for detection
of the nuclei of cells in images with overlapped cells.
CNN is trained from all patches extracted from the
training images, which the center of pixel in training
patch are classified to three classes, background, cy-
toplasm, and nucleus. To make network learn how to
guess right classify of each central pixel of the patches
(Braz and Lotufo, 2017). This method that applied the
colour deconvolution to reconstruct all of the applied
stains. In addition, the structure of a large feature
set and modification AdaBoost to create two detectors
that focused on various features in the appearance of
nuclei and modified of AdaBoost, is able to calculate
the cost of each feature during the selection of nuclei.
The output of each detector is incorporated by the op-
timal active contour algorithm to smooth the border
of detected nuclei (Vink et al., 2013).
A convolution neural network with the LoG fil-
ter is applied to histopathological images for per-
forming nuclei detection by sliding window to whole
image.Application of this method in histopathoogi-
cal images performs promising results in nuclear de-
tection (Khoshdeli et al., 2017). The CNN based
deep learning algorithm with superpixel analysis has
shown improved segmentation performance for nu-
clei segmentation while comparing with the state-of-
the art methods. This method, over-segmenting the
original image by generating superpixels which al-
low the CNN to learn the localized features better in
the training stage. In another study, Spatially Con-
strained Convolutional Neural Network (SC-CNN)
which forced spatial constraint at the prediction of
the likelihood of a pixel by assigning higher proba-
bility values to the pixels located in the vicinity of the
nuclei centers is implemented for nucleus detection.
In that study the classification of nuclei is presented a
Neighboring Ensemble Predictor method (NEP) com-
bined with convolution neural network. That provides
a good availability in the results of joint detection and
classification of the proposed SC-CNN and NEP (Sor-
napudi et al., 2018),(Sirinukunwattana et al., 2016).
Automatic cell segmentation in histopathological im-
ages via two-staged superpixel-based algorithms has
been studied in (Albayrak and Bilgin, 2018).
The goal in our study is to detect the center of
nuclei on histopathological images, using FCM clus-
tering which is extracted the foreground from back-
ground cellular structure of histopathological images.
FCM obtained a high accuracy in clustering in order
to increase the ability of detecting center of nuclei in
conventional method with automated center detection
by using convolutional neural networks.
The organization of the paper is as follows: In sec-
tion 2 we describe the methodology of the study. Sec-
tion 3 describes the materials used, Nucleus detection
and technical details. Section 4 refers to results and
discussion, and Section 5 concludes the paper.
2 MATERIAL AND METHODS
In medical image technology had become possible
to obtain more meaningful information by applying
pre-processing of histopathological images. In recent
years, the development which happens in deep learn-
ing architectures, had increased quality of data analy-
sis to obtain more information of related image.
2.1 Fuzzy C-means Algorithm
Clustering method is a method of locating a set of ob-
jects into group. In this instance, the clustering algo-
rithms can be classified into two classes classes: hard
clustering and soft (fuzzy) clustering. One is hard
clustering; second one is soft clustering.In this paper,
a soft clustering method, fuzzy c-means, is applied to
obtain cellular structures in histopathological images.
Soft clustering FCM in many cases more resilient than
other hard clustering method. In soft clustering, data
elements belong to more than one cluster, and associ-
ated with each element is set of membership levels as
mentioned in (Suganya and Shanthi, 2012). In the na-
ture work of FCM algorithm is depend on assigning
membership for each class which is based on degrees
among zero and one, to indicate their partial mem-
bership. The clustering centers calculated in FCM is
shown in Eq. 1:
C
j
=
n
∑
j=1
u
m
i j
x
i
n
∑
j=1
u
m
i j
(1)
BIOSIGNALS 2019 - 12th International Conference on Bio-inspired Systems and Signal Processing
194

where, j stands for each cluster center, x
i
is the objects
in j and u
i j
is the degree of membership of x
i
, the
value u
i j
is the degree of membership of x
i
in cluster
j and, m is representing any real number bigger than
1.
The membership matrix of u
i j
is calculated by us-
ing x
i
and c
j
as follows:
u
i j
=
1
c
∑
k=1
d
i j
d
k j
2/m−1
(2)
The FCM algorithm works by choosing the mem-
bership to each of data point identical to each cluster
center depending on the distance between the cluster
center and the data point the data which is closer to
the cluster center(Hafiane et al., 2008).
2.2 Convolutional Neural Networks
(CNN)
Convolutinal neural network is a deep learning based
algorithm proposed by Lecun et al. to classify hand-
writing digit images (LeCun et al., 2010). CNN is
consisted of three main types of layers: convolu-
tional layer, pooling layer and output layer. Convo-
lution layers,pooling layer, and an output layer. Net-
work layers are compatible in a feed-forward, back-
propagation neural networks construction: each con-
volution layer is followed by a pooling layer, and the
last convolution layer is followed by the output layer.
The convolution and pooling layers are represented as
two-dimensions layers, while the output layer is con-
sidered as a 1-D layer. In convolutional neural net-
work, each 2 dimension layer has several levels. In
one level it can observe neurons that are arranged in
a 2-D array. Also, with respective of the output layer
we can obtain a feature map.
In a convolutional layer, each level is linked to one
or more feature maps of the next layer. This con-
nection is adjust together with a convolution mask,
that is a two-dimensional matrix of adaptable entries
weights term. All levels computes the convolution
among its two-dimensional inputs and its convolu-
tion masks. The convolution outputs are collected and
added weight and bias. Then, an activation function
is utilized in the result to gain the output which is a
2-D matrix recognized as a feature map. A convolu-
tion layer output generate one or more feature maps.
All feature map is connected to exactly one level in
the output of the convolution feature map as shown in
Eq. 3:
k
n
l
= f
l
(
∑
i∈v
l
n
k
i
(l−1)
⊗ w
1
i,n
+ b
n
l
) (3)
where l stands for the number of layers in the lay-
ers numbers in the neurons of network f
l
defines as
activation function, k
n
l
is a feature map output with
size H
(l−1)
×W
(l−1)
pixels, size of mask convolution
mask in this equation H
(l−1)−r
l
+1
×W
(l−1)−c
l
+1
, with
⊗ as 2D convolution operator v
l
n
represents list of lev-
els in layers l-1. Pooling layer is applied to decrease
the size of the feature map for further analysis in the
next layers. As an example, the sum of four pixels
is calculated and multiplied with weight before it is
added to bias term. Then the result is sent to the ac-
tivation function to obtains an output for the 2 × 2
block. At the end, each pooling level minimize its
input size into half, along each dimension. A feature
map in this layer is connected to one or more level,
then it must be connected with next convolution layer
feature map for this layer obtained by Eq. 4:
k
l
n
= f
l
(z
(l−1)
n
× w
n
l
+ b
n
l
) (4)
where, the feature map n is divided into blocks each of
them consist of 4 pixels (2 × 2) in layer (l-1), where
z
(l−1)
n
is a matrix of that result concluded from the
four pixels in (l − 1). In the last convolution layer,
each level in this layer connected to one of feature
map and convolution masks are used that have the ex-
act same size as its input feature maps as proposed
in (Hatipoglu and Bilgin, 2017; Phung and Bouzer-
doum, 2009). In this study, the center of nuclei detec-
tion is proposed in Tiny-CNN and FCM with com-
bined Tiny-CNN, that we obtained a successful re-
sult of automated methods with two histopathological
data sets of UCSB-58 and CRC-100.
3 EXPERIMENTAL STUDIES
3.1 Histopathological Image Data Sets
The first experimental data set (UCSB-58) is ob-
tained from David Rimm Laboratory in Department
of Pathology at Yale University of California, Santa
Barbara. The data set is selected from a part of UCSB
biosegmentation benchmark and includes 58 set of
histopathological images 200 × 200 size of pixels
consist of 32 benign and 26 malignant tissue images
(Gelasca et al., 2009). The size of pixel in this images
is 896×768. Additionally, each of this UCSB-58 data
set images is corrupted labeled by pathologists to be-
come 200 × 200 pixels images with ground truth as
shown in Fig. 1.
The second data set (CRC-100) is obtained from
Department of Computer Science at University of
Warwick (Sirinukunwattana et al., 2016). This study
Automatic Nuclei Detection in Histopathological Images based on Convolutional Neural Networks
195
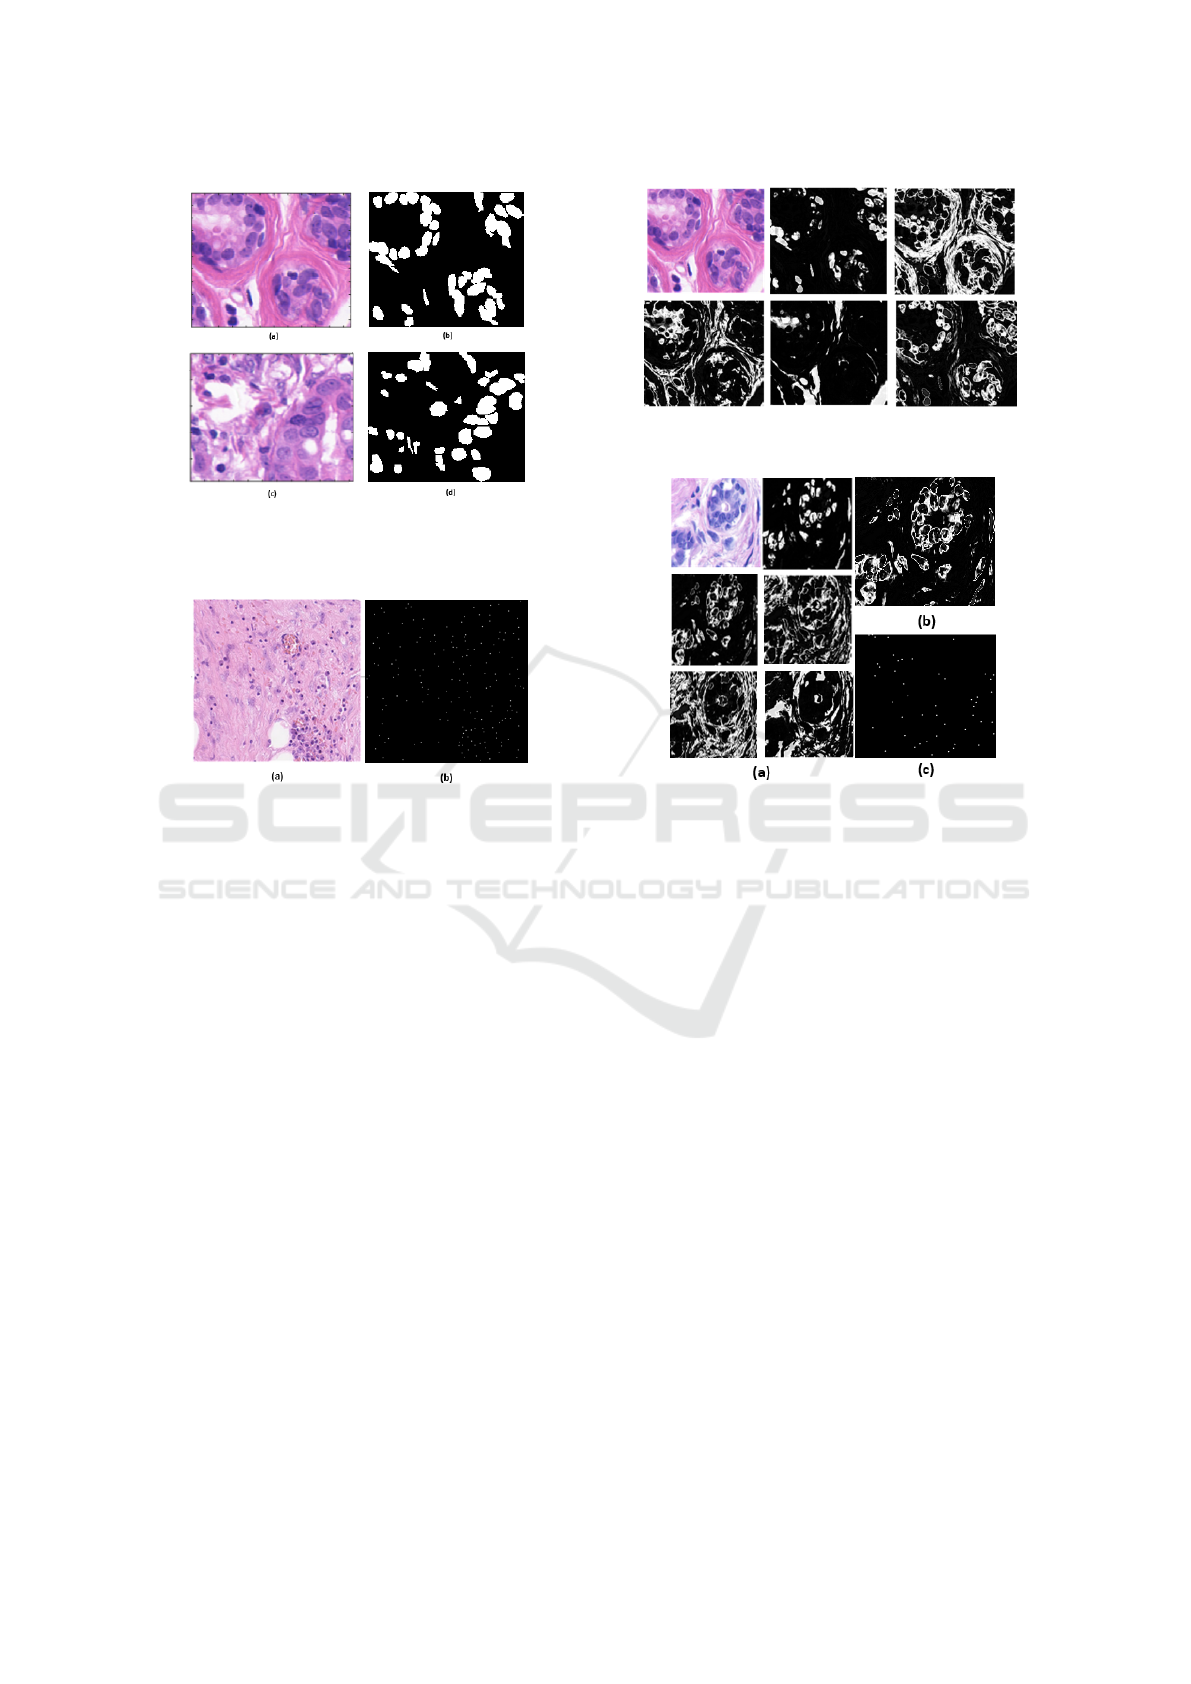
Figure 1: A benign image sample from UCSB-58
histopathological image data set (a) and its ground-truth (b);
a malignant image sample (c) and its ground-truth (d).
Figure 2: A CRC-100 histopathological image data set sam-
ple (a) and its ground-truth (b).
involves all the 10 E&H stained histopathological
slide images in size of 500 × 500 at a resolution of
0.55µm/pixel (20×optical magnification). For detec-
tion purposes 29,756 nuclei are marked at the center
as shown in Fig. 2 and out of 22,444 nuclei centers
have an associated class label for classification pur-
pose.
In this paper, we examine FCM clustering re-
sult with the results of tiny convolutional neural net-
works on histopathological images. The concept of
this study is consisted of two stages: First, using
the clustering method to extract the object from the
histopathological images and detecting the center of
the object, Second, the detection center of nucleus lo-
cation that is tried to obtain by Tiny-CNN processing.
Third, combined FCM results with Tıny-CNN results.
3.2 Nucleus Detection by using Fuzzy
C-Means Clustering Method in
Histopathological Images
In this paper, FCM segmentation algorithm is used to
detect to detect the center of nucleus of histopatholog-
ical images. The FCM method is used with two ap-
proaches, the first approach is to detect the center of
Figure 3: Regional outputs of five different clusters ob-
tained by FCM algorithm.
Figure 4: a) Five different cluster regions of FCM algorithm
b) obtained nuclei cluster of FCM approach and c) final out-
put nuclei centers image.
nucleus, and the second approach is to segmentation
of the nuclei in histopathological images, with mask
image for extracting a right nucleus of histopatho-
logical images. The FCM semiautomatic approach
which means, that we select the closest cluster man-
ually, 5 clusters are selected, since the clusters repeat
themselves after five number of clusters as shown in
Fig. 3. Then the standard deviation of these clus-
ters are calculated, the maximum standard deviation
of these clusters are selected. Afterwards, the clos-
est cluster for the ground-truth accompanied with the
data set is selected manually, as shown in Fig. 5c. Af-
ter finding the closest cluster we apply a morpholog-
ical operation on the FCM cluster result as shown in
Fig. 5d. The FCM automatic mean not chosen manu-
ally as shown in Fig. 4b to detect the center of cells as
annotated in Fig. 4c, we have experimented this ways
which is summarized, finding the maximum Standard
deviation of five clusters which are sorted to find the
maximum cluster from the candidate clusters to use it
for detecting the center of nucleus in histopathologi-
cal images.
The segmentation steps consist two stages:
Firstly,the otsu based thresholding method is applied
to each image for extracting the regions of cellular
BIOSIGNALS 2019 - 12th International Conference on Bio-inspired Systems and Signal Processing
196
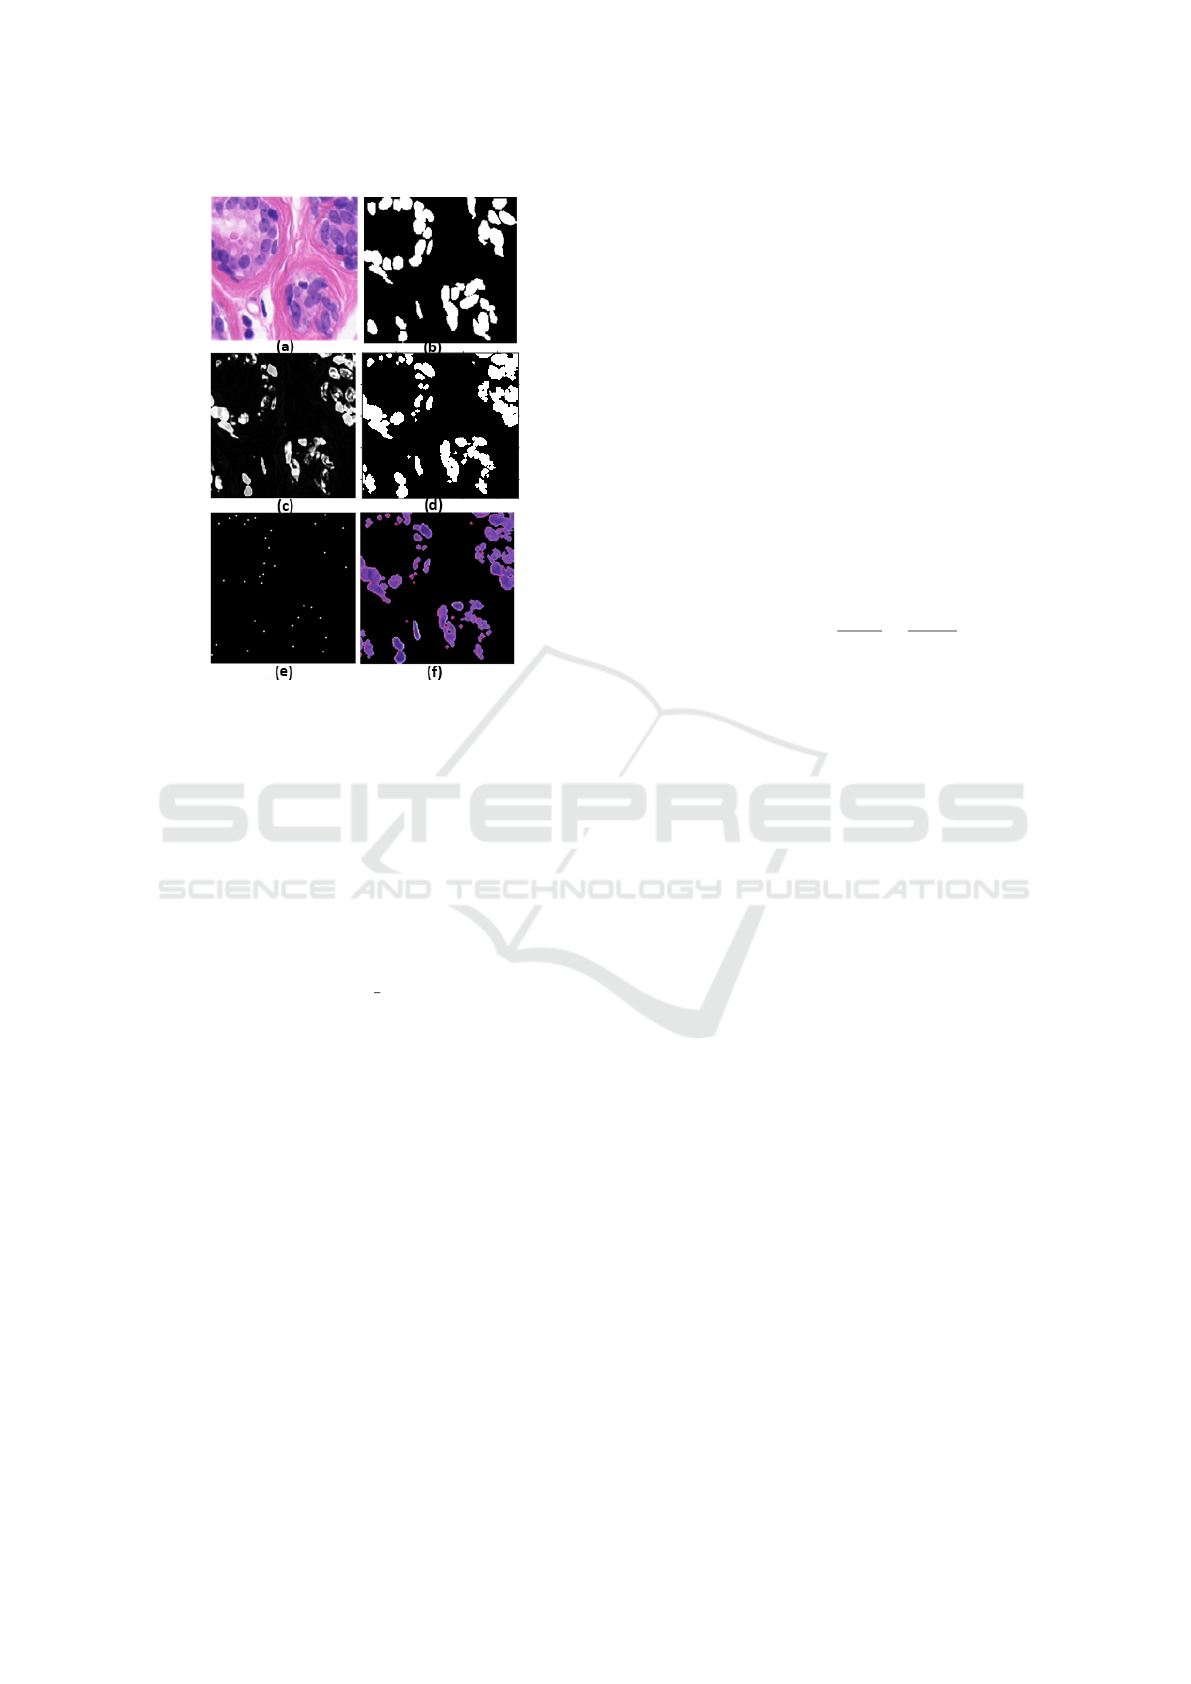
Figure 5: a) An original image from UCSB-58 data set, b)
its ground-truth, c) FCM result after choosing closest clus-
ter manually, d) FCM result after morphological operation,
e) FCM nuclei center detection and f) masked image of nu-
cleus with center detection.
structures. Then a dilation operation is applied to the
result of Otsu’s method. After that the binary image
obtained from the otsu’s method is multiplied to the
original image to eliminate the posibly non cellular
structures. Binary dilation of A by B, indicated to
A ⊗ B which is defined as:
A ⊗ B = z|
c
(B) z ∩ A 6= Ø (5)
In this equation,
c
(B) represents a reflection of the
structuring element B . In other words, it is the set
of pixel locations z, the reflection structuring element
overlaps with foreground pixels in A when translated
to z.
3.3 Nuclei Detection by using
Tiny- Convolutional Neural
Networks
In our model the tiny convolutional neural networks
consist of two parts, first part, work as typical CNN
building blocks, forward pass learning consist of two
layers linear filtering and max pooling, with two terms
weight (W) is a Q × Q filter as shown in Fig. 7b,
and the scalar bias (B), with understanding back-
propagation, Also, the second layer is connected with
the CNN loss layer that contains the derivatives of
the loss (DZDY) of CNN output with respect to pos-
itive detection and negative detection in histopatho-
logical images. Here, the loss function can be repre-
sented as shown below: Where DZDY (Vedaldi and
Lenc, 2015) is the derivative of error or loss func-
tion, Pos is a positive blobs in histopathological im-
ages. Whereas, Neg is a negative blobs or background
structure as shown in Eq. 6, and Fig. 7a, Fig. 7b. Con-
volution neural networks associated with ground truth
information which there coordination give as the in-
formation of nuclei and background to learn CNN the
positive and negative location of nuclei detection as
shown in Fig. 6c. Where as, the second part looks at
learning two basic CNNs. The first one is a simple
non-linear filter capturing particular image structures,
while the second one is a network that testing an im-
ages (using a variety of different colors).
Loss f unction =
Pos
∑
Pos
−
Neg
∑
Neg
(6)
The first approach in this paper, which is obtain-
ing two data set inputs are used to train Tiny-CNNs
with different architectures, and gave the best results
accuracy of weight rate or bias from a new value,
where the weights are initialized randomly for using
(27 × 27 × 3) weight initialization. Also, the data
set which is used in this study, consist two types of
histopathological images which are UCSB-58 data
set and CRC-100 data set. We used of training in
convolutional neural network, to estimate the centers
of nuclei from the best model selection as shown in
Fig. 7d. In the UCSB-58 data set histopathological
images the network is trained with 58 images in data
set. Whereas, in the second data set CRC-100 net-
work trained for 100 images in data set. All the pre-
dictions of this algorithm have achieved a good result
to detect the center of nucleus location Fig. 7g. Our
study proposes to find nuclei centers with Tiny-CNN.
To accomplish this task, we used the combined oper-
ation(combined the detection center of nuclei of FCM
semi automatic method with Tiny-CNN center detec-
tion). Our proposed study is detected the center of nu-
cleus by using conventional FCM clustering method,
on the original of histopathological image. This im-
age is used to compere with Tiny-CNN prediction
the center of nucleus. Also, apply a semi-automatic
FCM algorithm for extracted the perfect nucleus of
histopathological images, and find the center of nu-
clei, to compere it also with Tiny-CNN result, Then,
we experement the result of combined this approach
with Tiny-CNN based automated method as shown in
Fig. 8. This scenario is applied on two data set CRC-
100 data set is accompanied with coordination (x,y)
ground truth information and UCSB-58 data set with
Automatic Nuclei Detection in Histopathological Images based on Convolutional Neural Networks
197
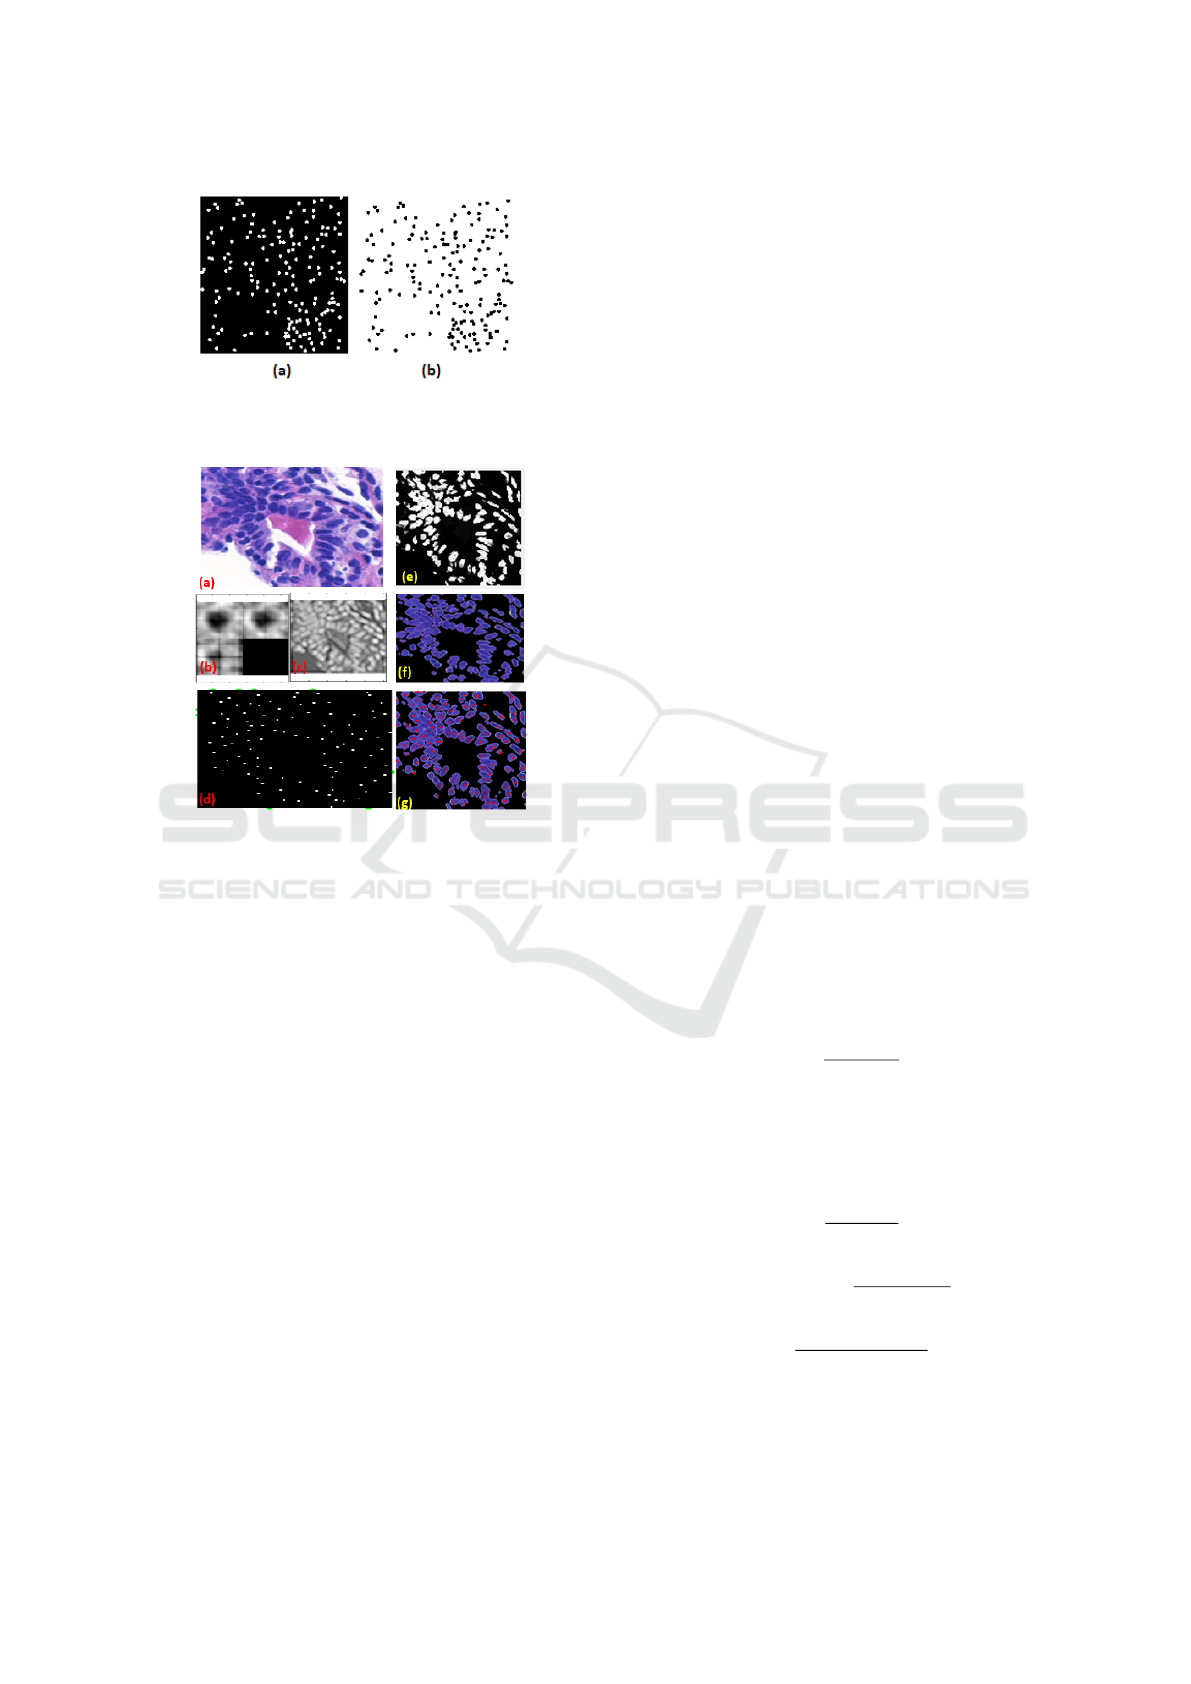
Figure 6: a) Detected positive nuclei centers for a sample
image in CRC-100 data set obtained by Tiny-CNN and b)
its negative image.
Figure 7: a) Original image from UCSB-58 data set, b) the
result of filtering, c) Tiny-CNN output image detect of nu-
clei, d) final output result of Tiny-CNN detect center of nu-
clei, e) FCM semiautomatic result, f) generated mask from
the FCM semiautomatic result combined with original im-
age g) used mask image with Tiny-CNN output the center
of the nuclei detection.
our contribution ground truth which is choose the co-
ordinates of (x,y) manually with the same manners of
CRC-100 data set ground truth.
4 RESULT AND DISCUSSION
In the detection of nuclei in histopathological im-
ages three approaches (Tiny-CNN, FCM, FCM-semi-
automatic) are evaluated and compared detection cen-
ter of nuclei in two different data set UCSB 58-set
and CRC 100-set. Our contributions include a dot op-
erator, by clicking on the center of a nuclei manu-
ally to produce ground truth information, for the first
data set UCSB-58 data set to obtain the same manner
of ground-truth information in the CRC-100 data set.
This ground truth information can also be seen in this
study to detect the center of nuclei in histopathologi-
cal images. The first approach uses detecting center of
cell by Tiny-CNN, second approach using FCM and
FCM semi-automatic algorithm to detect the center of
nuclei, then, that we compared these two approaches
to find the best results for center of nucleus detection.
Afterwards, we combined center of nuclei result of
the Tiny-CNN and FCM semi-automatic approaches
to evaluate our model in detect center of nuclei.The
basic experimental results unit in this study, has used
the boundary of cell size to detected the correct nuclei
in related image. In the first data set UCSB-58 data set
we stand a region information around 20 pixel as cir-
cular regions. Whereas, in the second data set CRC-
100 data set, we stand the circular regions within 10
pixels of each cell in the histopathological image. A
detection can be evaluated of cell center is identified
to be a true positive (TP) when it is matched within
the ground-truth information, otherwise, it is repre-
sent as a false positive (FP). Every true positive is
incorporated with the nearest ground-truth cell cen-
ter. The ground-truth cell centers that are not marched
by any detected results are represented as false nega-
tives (FN). The accuracy of nucleus detection is cal-
culated on a per nucleus basis on recording the true
positive (TP) (correctly identified nucleus success-
fully detected), false negative (FN) (incorrectly re-
jected nucleus), and false positive (FP) (identified non
nucleus objects found). In Fig. 9 the ground-truth re-
sults with Tiny-CNN results. In this study the auto-
mated method, contributors achieve results as shown
in Table 1. Focusing on the F-M measure we have also
defined True Positive Rate (TPR) and Positive Predic-
tion Value (PPV). Based on the above definitions, we
observe the strongest performance reach to (FM be-
tween 0.769 and 0.979 ) as shown in Table 1. The
sensitivity or true positive rate (T PR) is estimated by
formula as in Eq. 7:
T PR =
T P
T P + FN
(7)
F1-score in Eq. 9 is represented as a metric of
overlap between the nuclei predicted and ground-truth
information. The F1-score is associated with true pos-
itive rate and precision prediction value in Eq. 8 .
PPV =
T P
T P + FP
(8)
F1 − score = 2 ×
T PR × PPV
T PR + PPV
(9)
DSC =
2T P
2T P + FP + FN
(10)
Dice Similarity Coefficient (DSC) in Eq(10), is
used as a statistical validation measurement for eval-
uating the performance of both the predictability of
BIOSIGNALS 2019 - 12th International Conference on Bio-inspired Systems and Signal Processing
198
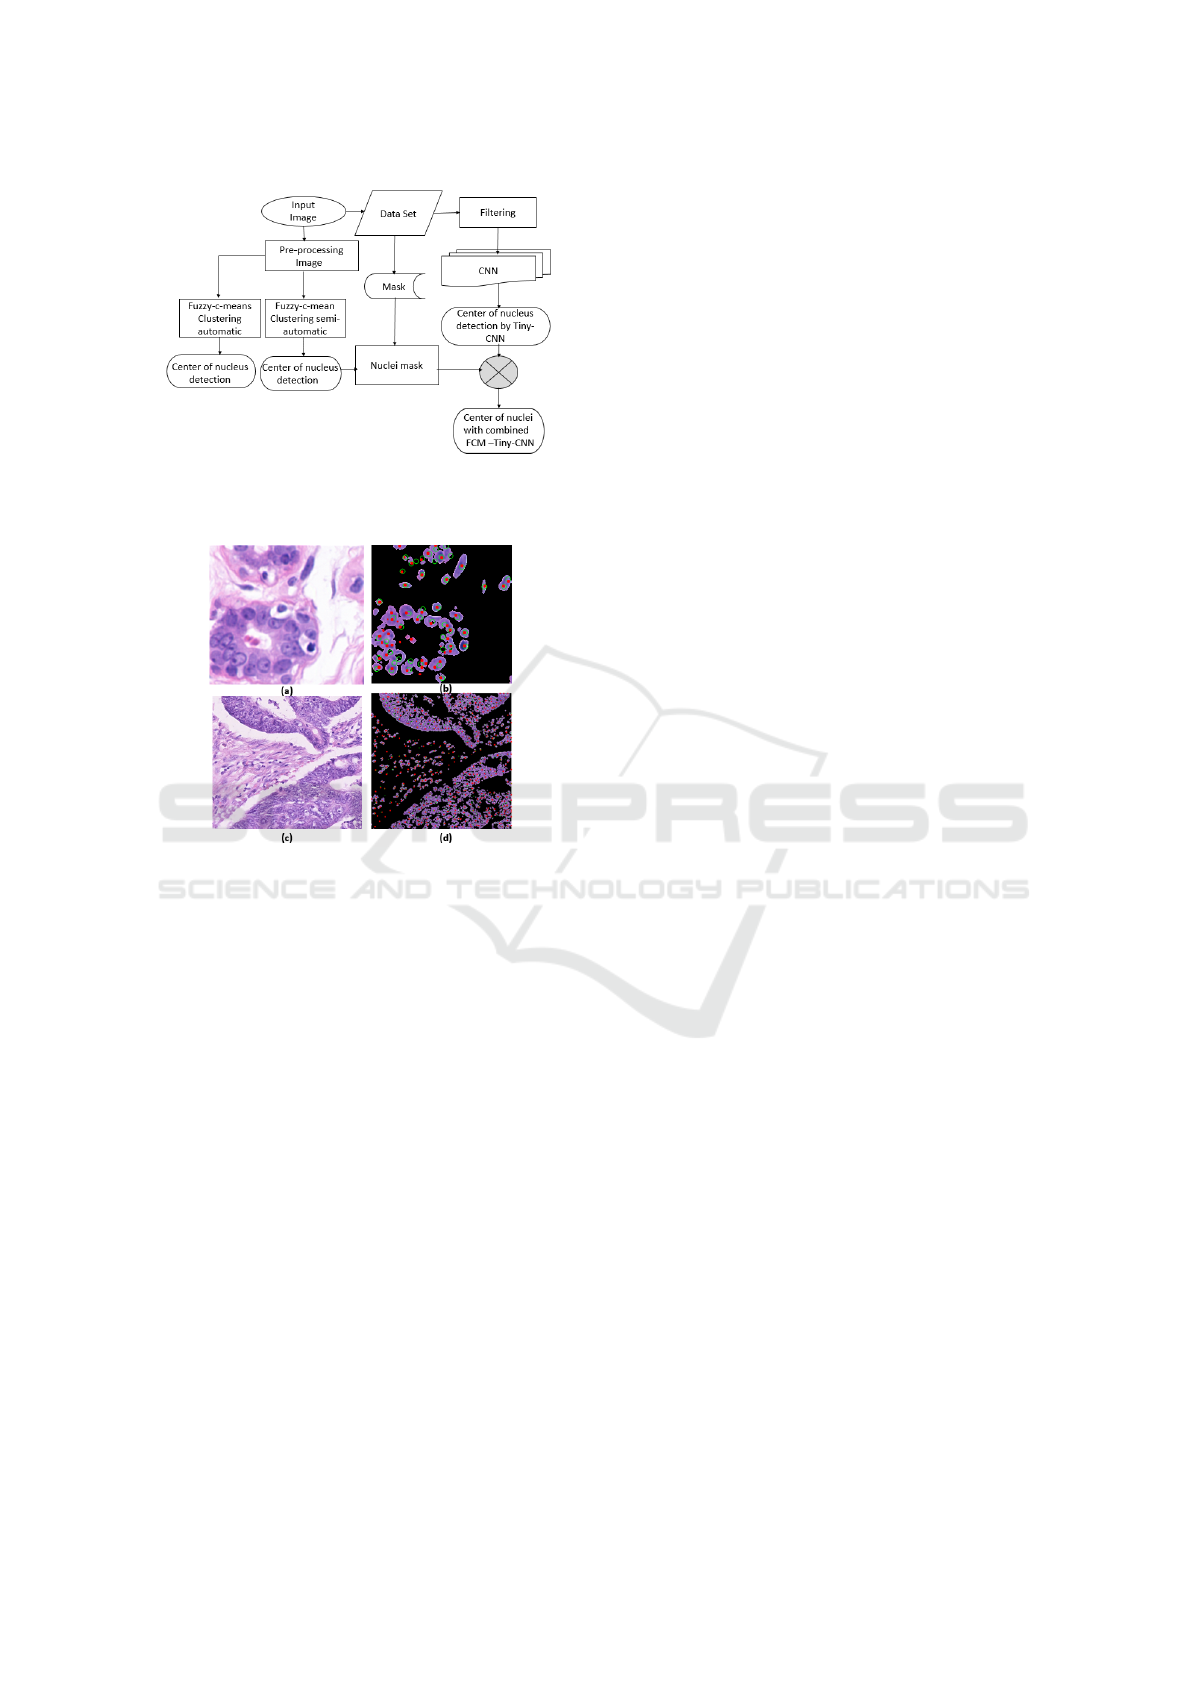
Figure 8: Proposed methodology, comparing FCM center
detection with Tiny-CNN center detection, combined FCM
and Tiny-CNN to detect center of nuclei.
Figure 9: a) An example image of UCSB-58 data set and, b)
red points represent outputs of nucleus center detection by
Tiny-CNN; green circles refer to ground truth information.
c) An example image of CRC-100 data set and, d) output of
detected nucleus centers Tiny-CNN and ground-truth.
manual segmentation and the overlap accuracy of au-
tomated segmentation of histopathological images.
All information about the experimental results
about detection of nuclei in histopathological images
in this study, are shown in Table 1. each different
method in this study give the different performance.
In this paper, the proposed methods has obtained of
true positive rate (TPR) of nucleus center detection
has reached to be between (0.863 - 0.964) at UCSB-
58 data set consisting of 58 images. In addition,
in this data set the (F-M or F1-score) has reached
to 0.979 in Tiny-CNN and 0.934 in the combined
FCM and Tiny-CNN and others FCM approaches are
reached between (0.89 - 0.933), whereas,in CRC data
set the true positive rate (TPR) has obtained results
between (0.547 - 0.621) and (F-M) has reached be-
tween (0.528 - 0.769), in this instance, the evaluating
of boundary in this study, has a directly effect the true
positive rate (TPR) as shown in Table 1.
5 CONCLUSIONS
In this study, we evaluated and compared fuzzy C-
means (FCM) clustering algorithm with tiny convo-
lutional neural network to detect center of nuclei in
histopathological images. To further explore nuclei in
data set images we combined and experimented two
approaches (Tiny-CNN and FCM semi-automatic) as
shown in Fig. 8. High results performance in (F-
M) reach to ( between 0.899 - 0.979) are observed
in the first data University of California Santa Bar-
bara’s UCSB-58 set. However, we also observed in
the second, data set University of Warwick’s CRC-
100 set, the highest results performance in (F-M) be-
tween (0.741 - 0.769). In our models, provides ba-
sis for the qualitative form similarity between models
prediction and ground truth information to detect nu-
clei in histopathological images. The correct nuclei
is detected, according to ground-truth information as
shown in Fig. 9, it has shown that the prediction of
Tiny-CNN method with ground-truth information on
the UCSB-58 and CRC-100 data sets.
The future work of this study, we will con-
sider comparing performance of Tiny-CNN with
other CNN established method to detect nuclei in
histopathological images.
REFERENCES
Al-Kofahi, Y., Lassoued, W., Lee, W., and Roysam, B.
(2010). Improved automatic detection and segmen-
tation of cell nuclei in histopathology images. IEEE
Trans. on Biomedical Engineering, 57(4):841–852.
Albayrak, A. and Bilgin, G. (2016). Mitosis detection using
convolutional neural network based features. In IEEE
17th Int. Symposium on Computational Intelligence
and Informatics, CINTI’16, pages 335–340. IEEE.
Albayrak, A. and Bilgin, G. (2018). Automatic cell seg-
mentation in histopathological images via two-staged
superpixel-based algorithms. Medical & Biological
Engineering & Computing, pages 1–13.
Braz, E. F. and Lotufo, R. (2017). Nuclei detection us-
ing deep learning. Simp
´
osio Brasileiro de e Proces-
samento de Sinais, pages 1059–1063.
Gelasca, E. D., Obara, B., Fedorov, D., Kvilekval, K., and
Manjunath, B. (2009). A biosegmentation benchmark
for evaluation of bioimage analysis methods. BMC
Bioinformatics, 10(1):368.
Glenn, T. C., Zare, A., and Gader, P. D. (2015). Bayesian
fuzzy clustering. IEEE Transactions on Fuzzy Sys-
tems, 23(5):1545–1561.
Hafiane, A., Bunyak, F., and Palaniappan, K. (2008). Fuzzy
clustering and active contours for histopathology im-
age segmentation and nuclei detection. In Int. Conf.
on Advanced Concepts for Intelligent Vision Systems,
pages 903–914. Springer.
Automatic Nuclei Detection in Histopathological Images based on Convolutional Neural Networks
199
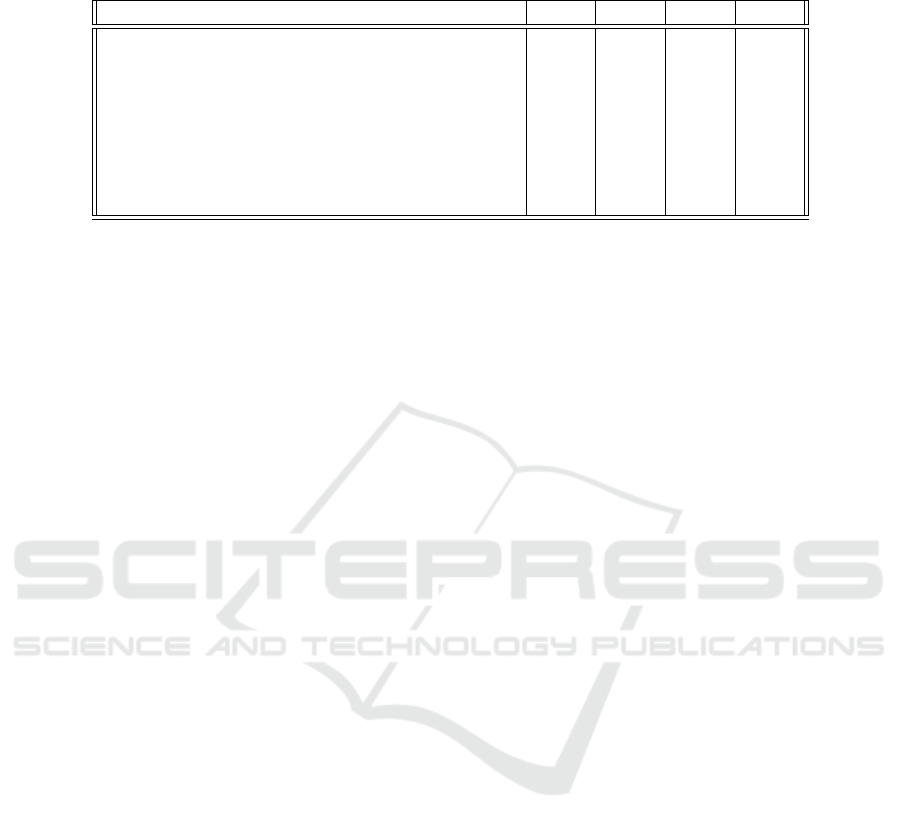
Table 1: Nuclei detection results with UCSB-58 and CRC-100 histopathological image data sets by using Tiny-CNN and
FCM semiautomatic, automatic method, and, combined FCM semiautomatic with Tiny-CNN.
Data Set TPR PPV F-M DSC
UCSB-58 set with Tiny-CNN 0.964 0.996 0.979 0.979
UCSB-58 set with FCM semiautomatic 0.881 0.994 0.933 0.933
UCSB-58 set with FCM automatic 0.828 0.994 0.899 0.899
CRC-100 set with Tiny-CNN 0.621 0.989 0.769 0.769
CRC-100 set with FCM semiautomatic 0.466 0.994 0.617 0.617
CRC-100 set with FCM automatic 0.451 0.994 0.528 0.528
UCSB-58 set with combined FCM and Tiny-CNN 0.863 0.994 0.934 0.934
CRC-100 set with combined FCM and Tiny-CNN 0.547 0.967 0.741 0.741
Hatipoglu, N. and Bilgin, G. (2017). Cell segmentation
in histopathological images with deep learning algo-
rithms by utilizing spatial relationships. Medical &
Biological Engineering & Computing, 55(10):1829–
1848.
John, J., Nair, M. S., Kumar, P. A., and Wilscy, M. (2016).
A novel approach for detection and delineation of cell
nuclei using feature similarity index measure. Biocy-
bernetics and Biomedical Engineering, 36(1):76–88.
Kainz, P., Urschler, M., Schulter, S., Wohlhart, P., and Lep-
etit, V. (2015). You should use regression to detect
cells. In International Conference on Medical Im-
age Computing and Computer-Assisted Intervention,
pages 276–283. Springer.
Khoshdeli, M., Cong, R., and Parvin, B. (2017). Detection
of nuclei in H&E stained sections using convolutional
neural networks. In IEEE EMBS Int. Conf. on Biomed-
ical & Health Informatics, BHI’17, pages 105–108.
Kong, H., Akakin, H. C., and Sarma, S. E. (2013). A gen-
eralized laplacian of gaussian filter for blob detection
and its applications. IEEE Transactions on Cybernet-
ics, 43(6):1719–1733.
LeCun, Y., Kavukcuoglu, K., Farabet, C., et al. (2010).
Convolutional networks and applications in vision. In
ISCAS, volume 2010, pages 253–256.
Moita, A. S., Jacinto, F., and Moreira, A. L. N. (2018).
Design, test and fabrication of a droplet based mi-
crofluidic device for clinical diagnostics. In Proceed-
ings of the 11th Int. Joint Conference on Biomed-
ical Engineering Systems and Technologies-Volume
1: BIODEVICES, BIOSTEC’18, pages 88–95. IN-
STICC, SciTePress.
Phung, S. L. and Bouzerdoum, A. (2009). Matlab library
for convolutional neural networks. University of Wol-
longong, Tech. Rep., URL: http://www. elec. uow. edu.
au/staff/sphung.
Sirinukunwattana, K., Raza, S. E. A., Tsang, Y.-W., Snead,
D. R., Cree, I. A., and Rajpoot, N. M. (2016). Local-
ity sensitive deep learning for detection and classifi-
cation of nuclei in routine colon cancer histology im-
ages. IEEE Trans. on Medical Imaging, 35(5):1196–
1206.
Sornapudi, S., Stanley, R. J., Stoecker, W. V., Almubarak,
H., Long, R., Antani, S., Thoma, G., Zuna, R., and
Frazier, S. R. (2018). Deep learning nuclei detection
in digitized histology images by superpixels. Journal
of Pathology Informatics, 9.
Suganya, R. and Shanthi, R. (2012). Fuzzy c-means
algorithm-a review. Int. Journal of Scientific and Re-
search Publications, 2(11):1.
Vedaldi, A. and Lenc, K. (2015). Matconvnet: Convolu-
tional neural networks for matlab. In Proceedings of
the 23rd ACM International Conference on Multime-
dia, pages 689–692.
Vink, J. P., Van Leeuwen, M., Van Deurzen, C., and
De Haan, G. (2013). Efficient nucleus detector
in histopathology images. Journal of Microscopy,
249(2):124–135.
Xu, H., Lu, C., Berendt, R., Jha, N., and Mandal, M.
(2017). Automatic nuclei detection based on gener-
alized laplacian of gaussian filters. IEEE Journal of
Biomedical and Health Informatics, 21(3):826–837.
Xu, J., Xiang, L., Liu, Q., Gilmore, H., Wu, J., Tang, J.,
and Madabhushi, A. (2016). Stacked sparse autoen-
coder (SSAE) for nuclei detection on breast cancer
histopathology images. IEEE Transactions on Med-
ical Imaging, 35(1):119–130.
BIOSIGNALS 2019 - 12th International Conference on Bio-inspired Systems and Signal Processing
200
