
Can Sit-to-walk Assessment Maximize Instrumented Timed Up & Go
Test Output?
Slavka Viteckova
1
, Radim Krupicka
1
, Petr Dusek
2
, Patrik Kutilek
1
,
Zoltan Szabo
1
and Ev
ˇ
zen R
˚
u
ˇ
zi
ˇ
cka
2
1
Faculty of Biomedical Engineering, Czech Technical University in Prague, Kladno, Czech Republic
2
Department of Neurology and Centre of Clinical Neuroscience, First Faculty of Medicine and General University Hospital
in Prague, Charles University in Prague, Prague, Czech Republic
Keywords:
iTUG, Angular Rate, Sit-to-Stand, Transition, Movement.
Abstract:
Daily human activities commonly include standing from a seated position. In research this transition is inves-
tigated, among others, as a part of a functional Timed Up & Go test. Spatio-temporal parameters are widely
used to assess the sit-to-walk transition. Usually, the parameters calculated for the sit-to-walk signal is in
its entirety. Another approach primarily splits the transition into phases and then calculates parameters for
individual phases separately. The objective of this work is to examine whether splitting the Timed Up & Go
test into subphases provides additional value for transition assessment. In order to compare both approaches,
we utilized angular rate parameters (duration, peak value, mean, variance) and analyzed their reliability. The
reliability proved to be dependent on the subject group and transition phase. In addition, we compared tran-
sition parameters from the entire transition and individual phases between the two subject groups. The mean
only differentiated between the subject groups in individual phases, but not is entire transition. To summarize,
splitting the transition into phases turned out to be beneficial for sit-to-walk transition assessment.
1 INTRODUCTION
Standing from a seated position is a commonly per-
formed daily activity. The sit-to-stand movement is a
part of functional tests such as Timed Up & Go test.
The Timed Up & Go (TUG) test is a modified timed
version of the ”Get-Up and Go” Test (Mathias et al.,
1986). TUG involves rising from a chair, walking 3
m, turning 180
◦
, walking back to the chair, and sitting
down again. Usually, a TUG is measured as the total
time it takes to perform the test.
The increasing utilization of inertial measurement
units during the last decade increases the ability to
separate individual TUG subcomponents (Salarian
et al., 2010; Greene et al., 2010; Zakaria et al., 2015;
Smith et al., 2016; Craig et al., 2017; Newman et al.,
2018), i.e. sit-to-walk, walking forward, 180 degree
turn, walking back to the chair and turn-to-sit, and
consequently their individual assessment.
Recent studies employed two approaches to the
sit-to-walk (StW) assessment. The first approach ana-
lyzed the entire StW at once. Salarian et al. (Salarian
et al., 2010) tested four StW parameters (duration,
peak angular velocity, mean angular velocity, and the
range of trunk movement) in Parkinson disease pa-
tients and older adults. They did not reveal any differ-
ence between the tested subject groups. Also, Weiss
et al. (Weiss et al., 2013) did not observe a differ-
ence in the transition measures (duration, accelera-
tion amplitude range, median and standard deviation)
of PD patients and older adult groups. Gal
´
an et al.
(Gal
´
an-Mercant and Cuesta-Vargas, 2014) showed a
difference in duration and acceleration-based param-
eters (minimal, maximal, and mean value) between
frail and non-frail older adults. The second approach,
Zakaria et al. (Zakaria et al., 2015) modified the StW
assessment so that they divided the transition into two
phases: sit-bend and bend-stand. Then, they assessed
the duration, acceleration and angular rate measures
(peak values, RMS) in elderly subjects with low and
high risk of falls. No differences were observed in the
transition phase measures for both groups. Although
a number of studies utilized the instrumented TUG,
only a few of them included StW assessment (Salarian
et al., 2010; Weiss et al., 2013; Zakaria et al., 2015;
Gal
´
an-Mercant and Cuesta-Vargas, 2014). Moreover,
Millor et al. (Millor et al., 2014) noted that the angu-
lar kinematics of StW transitions in the TUG test did
Viteckova, S., Krupicka, R., Dusek, P., Kutilek, P., Szabo, Z. and R ˚uži
ˇ
cka, E.
Can Sit-to-walk Assessment Maximize Instrumented Timed Up Go Test Output?.
DOI: 10.5220/0007523902090213
In Proceedings of the 12th International Joint Conference on Biomedical Engineering Systems and Technologies (BIOSTEC 2019), pages 209-213
ISBN: 978-989-758-353-7
Copyright
c
2019 by SCITEPRESS – Science and Technology Publications, Lda. All rights reserved
209
not yield meaningful information. None of the pre-
vious studies assessed or compared both approaches,
i.e. the assessment of the entire StW and individual
phases at the same time.
Reliable outcomes are crucial for the interpreta-
tion of results and the subsequent adoption in clinical
practice (Smith et al., 2016). Salarian et al. (Salarian
et al., 2010) examined a TUG inter-session reliability
including the sit-to-walk transition of elderly subjects
and patients with Parkinson’s disease (PD). Their
work did not provide reliability per subject groups,
rather the analysed reliability of the mixed group. The
results showed the poor reliability of all analysed pa-
rameters (ICC<0.5). Newman et al. (Newman et al.,
2018) also assessed the intra-session reliability of a
TUG including the StW transition among children
with traumatic brain injury and controls. Although
the reliability of the sit-to-walk parameters was as-
sessed previously none of the previous works studied
the reliability of the sit-to-walk transition with a focus
on its phases.
The aim of this study is to analyse the division of
the StW transition into two phases. Specifically, to
examine the additional value of splitting the transi-
tion into subphases when compared to the transition
assessment at once. For this purpose, we compared
parameters computed for an entire StW transition and
its individual phases. Then, we assessed the reliabil-
ity of all computed parameters and compared the dis-
tinctiveness between the two subject groups, namely
older adults and Parkinson disease patients.
2 METHODS
2.1 Participants and Protocol
Two groups of participants were enrolled in this study.
The first group included 35 early untreated Parkinson
disease (PD) patients (24 males, 11 females), mean
age 58.6 (+-13.4). The second group, control group
(CG), included 36 volunteers (32 males, 4 females),
mean age 64.3 (+-9.5). All PD patients and CG were
evaluated twice within one session (TUG
1
, TUG
2
).
All subjects accomplished an extended Timed Up &
Go Test (ETUG) (Wall et al., 2000). Each subject
was measured while she/he rose from a chair during
the ETUG, walked 10 meters, turned, walked back,
and sat down again. The study was approved by the
Ethics Committee of the General University Hospital
in Prague, Czech Republic, and therefore performed
in accordance with the ethical standards established
in the 1964 Declaration of Helsinki.
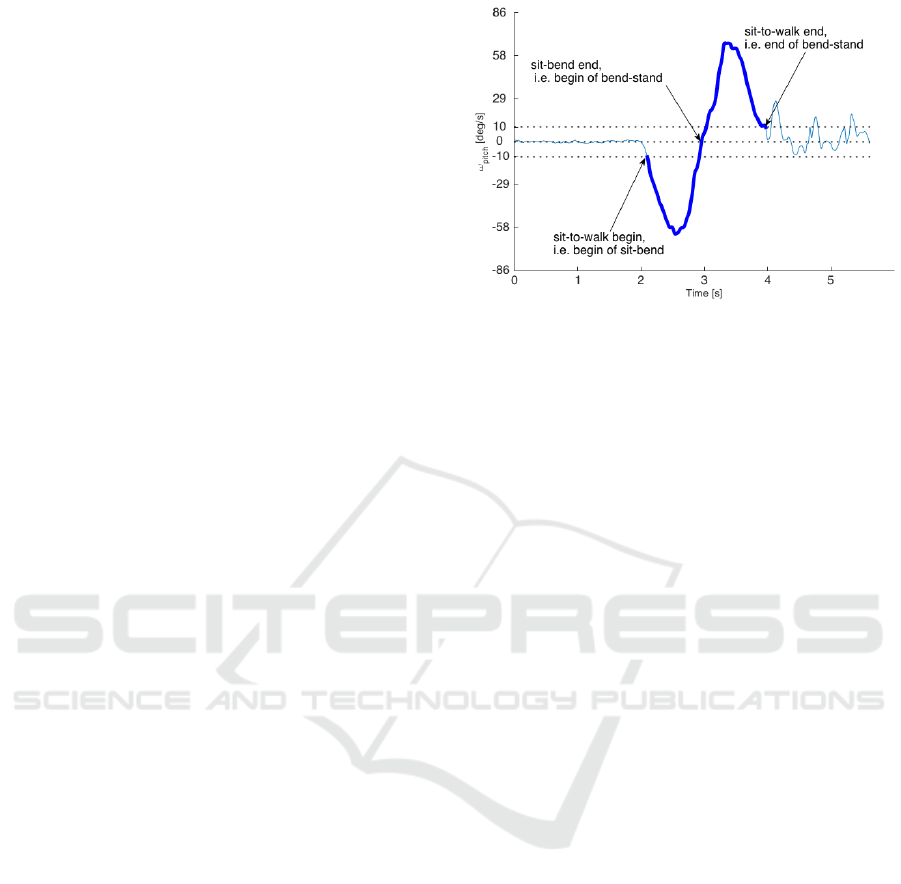
Figure 1: Plot showing pitch angular rate of one subject.
Bold - sit-to-walk phase of TUG.
2.2 Data Acquisition and Processing
Xbus Master (Xsens Technologies B.V.), a
lightweight (330g) and portable device using MTx
units for orientation and acceleration measurements
of body segments, was used for the measurement of
3-D orientation and 3-D acceleration. Kinematic data
was recorded from 5 gyro-accelerometers with a data
sampling rate of 100 Hz. Units were symmetrically
attached to the lateral shank of each lower leg, 4 cm
above the ankle joint, and the chest, 2 cm below the
sternal notch.
Before further processing, the raw angular rate
signal was low-pass filtered with a zero-phase second-
order Butterworth filter with a 20 Hz corner fre-
quency. In this study, we focused on the sit-to-walk
(StW) transition.
In accordance with previous studies, the chest an-
gular rate sensor was used for further processing and
computation of the StW parameters. It was showed
that the TUG sit-to-walk transition can be detected as
the movement with an pitch angular rate higher than
10 deg/s (Higashi et al., 2008). As a negative angular
rate indicates a clockwise rotation, the beginning of
the StW, i.e. the beginning of the sit-bend phase, was
detected from the pitch angular rate as a value less
than -10 deg/s. As the crossing of the angular rate sig-
nal to zero means a rotation or direction change, the
end of sit-bend phase, i.e. beginning of bend-stand
phase, was detected as the crossing of the angular rate
to the value zero (Figure 1). Finally, the end of StW,
i.e. end of bend-stand phase, was identified as a value
lower than 10 deg/s (Higashi et al., 2008).
To assess the StW we employed the mean, peak
value, duration, and variance of pitch angular rate sig-
nal. All parameters were calculated for both phases
and the entire transition. Thus, we calculated 12 pa-
rameters in total.
BIOSIGNALS 2019 - 12th International Conference on Bio-inspired Systems and Signal Processing
210

2.3 Statistical Analysis
Statistical analyses were performed to examine the re-
liability of the StW parameters. The Intra-Class Cor-
relation (ICC) between two measurements was used.
Absolute agreement was reported. According to Mc-
Graw et al. (McGraw and Wong, 1996) reliability
greater than 0.90 is considered as excellent, reliability
greater than 0.75 is considered as good, greater than
0.50 is moderate, and lower than 0.50 is poor.
Next, the hypotheses on whether the StW parame-
ters of both sit-to-walk phases are able to distinguish
a healthy subject from a PD patient was tested. The
Shapiro-Wilk test was used to verify the normality of
parameters in each observed dataset. The assumption
of a normal data distribution in the observed datasets
had been rejected (significance level p=0.05). There-
fore, the nonparametric Wilcoxon rank sum test was
used to compare statistical significance differences
in the sit-to-walk transition between PD patients and
control group data. The significance level was set to
p<0.05. All preprocessing and analyses were carried
out offline using the MatLab (MatLab R2015, Math-
works, Inc., Natick, MA, USA) programming envi-
ronment.
3 RESULTS
From Table 1, it can be seen that out of the four pa-
rameters, three parameters in the control group and
one parameter in PD patients demonstrated poor re-
liability (ICC<0.50) in all three cases (entire StW,
sit-bend, bend-stand). For the control group these
were: duration, mean and variance. For PD pa-
tients this was only for duration. The peak value in
the control group showed a higher reliability (moder-
ate, ICC>0.50) in the bend-stand phase then in other
cases (poor, ICC<0.50). The mean and variance in
PD had poor reliability in the sit-bend phase and mod-
erate (ICC>0.50) in the entire StW and bend-stand.
When comparing PD patients and the control
group, the peak value, and variance were signifi-
cantly different in the entire StW, sit-bend and bend-
stand phases. The mean value showed the difference
between the groups in the sit-bend and bend-stand
phases (Figure 2). The duration did not show a differ-
ence in any of the tested cases. A significant differ-
ence in the entire StW but not sit-bend or bend-stand
phases was not observed for any of utilized parame-
ters.
4 DISCUSSION
In this work, we compared the results of the entire sit-
to-walk transition to a more detailed approach with
transition phases. We evaluated StW transition. Addi-
tionally, we divided the sit-to-walk transition into two
phases, namely sit-bend and bend-stand, and evalu-
ated them separately.
First, we analysed whether the StW measures cal-
culated per phase have similar reliability as measures
calculated for entire StW. The analyses were provided
per subject group. Based of poor reliability results
(Table 1) it can be inferred that the parameter dura-
tion of the entire StW and its phases is not suitable for
StW assessment (the entirety or its parts). The results
showed a higher reliability in PD patients than the CG
for almost for all parameters and tested cases. This
can be elucidated by the reduced concentration of the
CG to perform a StW. In the PD group, some param-
eters (mean, variance) exhibited a lower reliability in
the sit-bend phase than in other phases. In contrast
to the peak parameter, mean and variance are affected
by the accuracy of StW detection. Especially the de-
tection of the StW beginning is a challenging task be-
cause the sit-bend phase may be preceded by gently
bending forward and backward. Thus, a comparison
of detection methods with respect to their impact to
StW parameters is needed to make results more com-
parable across studies.
In addition, the training effect might play impor-
tant role in reliability assessment of two consecutive
trials. To our knowledge, the training effect of TUG
subcomponents has not yet been studied.
Second, we tested whether StW phases can dif-
ferentiate between PD patients and older adults bet-
ter than entire StW. The present study is consistent
with previous works. No differences between PD a
CG were observed for duration and mean parameters
computed for entire StW (Salarian et al., 2010; Weiss
et al., 2013). Unlike duration, the mean parameter re-
vealed a difference between these groups in both indi-
vidual phases (sit-bend, bend-stand). Finally, we sug-
gest that splitting StW into phases can benefit a TUG
StW analysis.
Nevertheless, there are some limitations to this re-
search study. The most important is that the sam-
ple size of the subjects was not high. However, 71
subjects proved to be sufficient for preliminary re-
search which managed to test the basic attributes of
the method proposed for further studies of TUG.
Can Sit-to-walk Assessment Maximize Instrumented Timed Up Go Test Output?
211
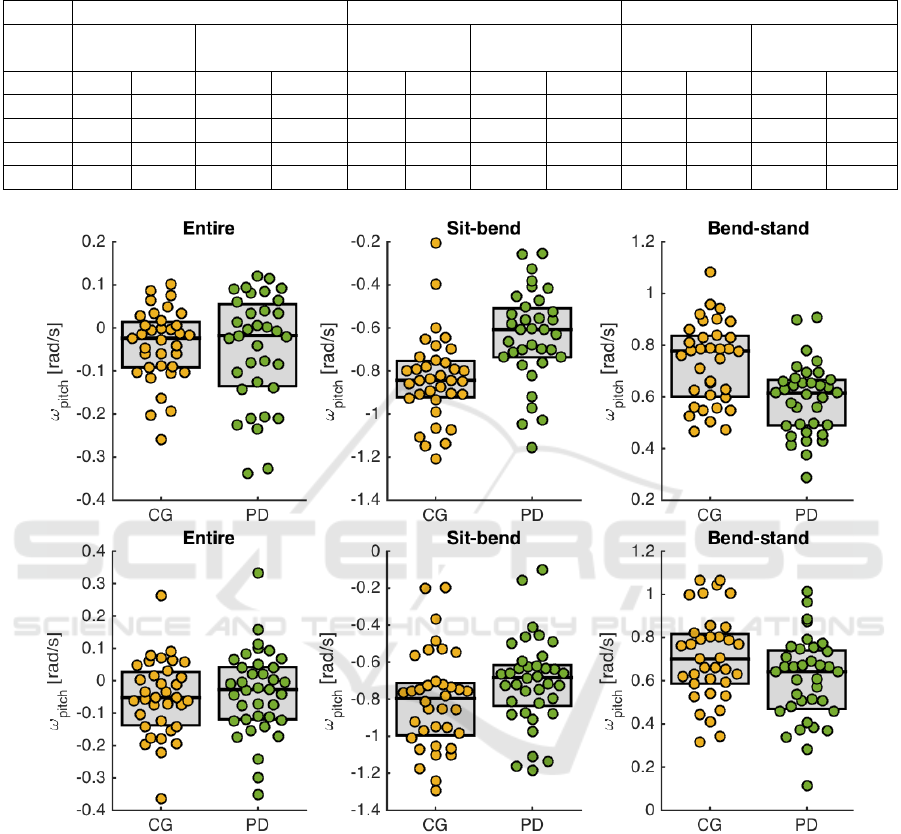
Table 1: Intra-class correlation and Wilcoxon rank sum test outcomes for the two TUG measurements. TUG
1
-first TUG mea-
surement, TUG
2
-second TUG measurement, Var.-variance,
∗
-statistically significant difference,
-moderate or good intraclass
correlation.
Entire StW Sit-bend phase Bend-stand phase
ICC PD vs CG ICC PD vs CG ICC PD vs CG
(p-value) (p-value) (p-value)
CG PD TUG
1
TUG
2
CG PD TUG
1
TUG
2
CG PD TUG
1
TUG
2
Time 0.12 0.40 0.06 0.38 0.17 0.48 0.06 0.42 0.09 0.33 0.14 0.16
Peak 0.42 0.73
<0.01
∗
<0.01
∗
0.43 0.74
<0.01
∗
<0.01
∗
0.53
0.74
<0.01
∗
0.09
Mean 0.30 0.72
0.80 0.49 0.19 0.39 <0.01
∗
0.04
∗
0.44 0.53
<0.01
∗
0.04
∗
Var. 0.40 0.53
<0.01
∗
<0.01
∗
0.43 0.31 0.01
∗
<0.01
∗
0.37 0.70
0.03
∗
0.02
∗
Figure 2: Scatter plots showing mean pitch angular rate differences between PD patients and control group (CG) in the entire
StW, sit-bend and bend-stand phases. The top scatter plot represents the first TUG measurement (TUG
1
) and the bottom
represents the second TUG measurement (TUG
2
).
5 CONCLUSIONS
This paper tested and compared two approaches to
Timed Up & Go sit-to-walk transition analysis: the
analysis of the entire transition at once and the anal-
ysis per phases. The reliability of sit-to-walk param-
eters was tested as well as the ability to differentiate
between subject groups. We can designate that the
transition splitting into phases can provide new in-
sight into sit-to-walk transition assessment.
ACKNOWLEDGEMENTS
This work has been supported by the Czech science
foundation, grant No. 16- 07879S “REM sleep be-
havior disorder: predicting the risk of neurodegener-
ation” and Ministry of Health of the Czech Repub-
lic, AZV Grant no. 16- 28119a ”Analysis of move-
ment disorders for the study of extrapyramidal dis-
eases mechanism using motion capture camera sys-
tems”.
BIOSIGNALS 2019 - 12th International Conference on Bio-inspired Systems and Signal Processing
212

REFERENCES
Craig, J. J., Bruetsch, A. P., Lynch, S. G., Horak, F. B.,
and Huisinga, J. M. (2017). Instrumented balance and
walking assessments in persons with multiple sclero-
sis show strong test-retest reliability. Journal of Neu-
roEngineering and Rehabilitation, 14:43.
Gal
´
an-Mercant, A. and Cuesta-Vargas, A. I. (2014). Differ-
ences in trunk accelerometry between frail and non-
frail elderly persons in functional tasks. BMC research
notes, 7:100–100.
Greene, B. R., O’Donovan, A., Romero-Ortuno, R., Cogan,
L., Scanaill, C. N., and Kenny, R. A. (2010). Quanti-
tative falls risk assessment using the timed up and go
test. IEEE Transactions on Biomedical Engineering,
57(12):2918–2926.
Higashi, Y., Yamakoshi, K., Fujimoto, T., Sekine, M., and
Tamura, T. (2008). Quantitative evaluation of move-
ment using the timed up-and-go test. IEEE Engineer-
ing in Medicine and Biology Magazine, 27(4):38–46.
Mathias, S., Nayak, U., and Isaacs, B. (1986). Balance in
elderly patients: the ”get-up and go” test. Arch Phys
Med Rehabil, (1):387–9.
McGraw, K. O. and Wong, S. P. (1996). Forming inferences
about some intraclass correlation coefficients. Psycho-
logical Methods, 1(1):30–46.
Millor, N., Lecumberri, P., Gomez, M., Mart
´
ınez-Ramirez,
A., and Izquierdo, M. (2014). Kinematic parameters
to evaluate functional performance of sit-to-stand and
stand-to-sit transitions using motion sensor devices: A
systematic review. IEEE Transactions on Neural Sys-
tems and Rehabilitation Engineering, 22(5):926–936.
Newman, M., Hirsch, M., Peindl, R., Habet, N., Tsai, T.,
Runyon, M., Huynh, T., and Zheng, N. (2018). Re-
liability of the sub-components of the instrumented
timed up and go test in ambulatory children with trau-
matic brain injury and typically developed controls.
Gait and Posture, 63:248–253. cited By 0.
Salarian, A., Horak, F., Zampieri, C., Carlson-Kuhta, P.,
Nutt, J., and Aminian, K. (2010). Itug, a sensitive
and reliable measure of mobility. IEEE Transactions
on Neural Systems and Rehabilitation Engineering,
18(3):303–310.
Smith, E., Walsh, L., Doyle, J., Greene, B., and Blake, C.
(2016). The reliability of the quantitative timed up
and go test (qtug) measured over five consecutive days
under single and dual-task conditions in community
dwelling older adults. Gait & Posture, 43:239–244.
Wall, J., Bell, C., Campbell, S., and Davis, J. (2000). The
timed get-up-and-go test revisited: Measurement of
the component tasks. J Rehabil Res Dev, 37:109–13.
Weiss, A., Mirelman, A., Buchman, A., Bennett, D., and
Hausdorff, J. (2013). Using a body-fixed sensor to
identify subclinical gait difficulties in older adults
with iadl disability: Maximizing the output of the
timed up and go. PLoS ONE, 8(7). cited By 24.
Zakaria, N. A., Kuwae, Y., Tamura, T., Minato, K., and
Kanaya, S. (2015). Quantitative analysis of fall risk
using tug test. Computer Methods in Biomechanics
and Biomedical Engineering, 18(4):426–437. PMID:
23964848.
Can Sit-to-walk Assessment Maximize Instrumented Timed Up Go Test Output?
213
