
Nonlinear Dynamics Method in the Impedance Signals Analysis of the
Eye Blood Flow of Patients with Glaucoma
Anna A. Kiseleva
1
, Petr V. Luzhnov
1
, Alexander P. Nikolaev
1
, Elena N. Iomdina
2
and
Olga A. Kiseleva
2
1
Bauman Moscow State Technical University, Moscow, Russian Federation
2
Moscow Helmholtz Research Institute of Eye Diseases, Moscow, Russian Federation
Keywords: Nonlinear Dynamics, Transpalpebral Rheophthalmography, Eye Blood Flow, Glaucoma.
Abstract: The article considers the possibility of analyzing the signals of transpalpebral reophthalmography with the
help of the method of nonlinear dynamics. In analyzing the signals, it was considered a method with a
reconstruction of the signal attractor. An optimal time delay was chosen for the reconstruction, which allowed
us to construct an attractor in the space of selected coordinates. Next, we analyzed the mass centers of the
reconstructed attractors, the position of the coordinates allowed us to formulate a decisive rule for comparing
and dividing signals into groups.Verification of the results carried out on the model signals. The application
of this technique was shown with the help of the examples of signal analysis in patients with primary open-
angle glaucoma.
1 INTRODUCTION
In the structure of ophthalmopathology, primary
open-angle glaucoma (POAG) occupies one of the
first places among eye diseases that inevitably end in
blindness (Quigley, H. A., Broman, A. T., 2006).
Currently, the pathogenesis of the development and
progression of POAG is associated with increased
intraocular pressure (IOP) (Cherecheanu A.P.,
Garhofer G., et al., 2013). Increased IOP damages the
nerve cells of the retina, from which the optic nerve
is formed. It is manifested by a gradual loss of vision
function. However, other factors can lead to the
development of POAG. So, a lot of researches have
described studies where, along with increased IOP,
one of the risk factors for the development of POAG
and the progressive deterioration of visual functions
in this diseaseis a decreasing level of the blood filling
in the brain vessels and eye vessels (Caprioli, J.,
Coleman, A. L., 2010; Venkataraman, S. T., Flanagan,
J. G., et al., 2010; Calvo, P. et al., 2012). Studying the
eye hemodynamics can provide the necessary
information about the clinical course of POAG.
Electrical impedance method is a technique for
obtaining an image in sections of an impedance
distribution body (resistance of various organs in
response to an electric current) by means of non-
invasive electrical sounding (Adler A., Gaburro R.,
2016). The current flowing through the body creates
a volume distribution of electrical potential (voltage).
The potential decreases along the current line with
distance from the active (injecting current) electrode.
The voltage drop per unit length (electric field
strength) is proportional to the magnitude of the
current and the resistance of the body in accordance
with Ohm’s law. By measuring the voltage drop and
knowing the amount of current, it is possible to
calculate the resistance value. The reconstruction
algorithm allows the use of voltages measured only
on the surface of the body, to calculate the spatial
distribution of resistivity (or electrical conductivity)
within it. This method is the basis of the method of
reophthalmography (ROG) (Lazarenko V.I.,
Komarovskikh E.N., 2004). ROG is the method for
assessing the state of the blood flow in the eye. ROG
is a method for studying the pulse blood filling in the
vessels of various organs and tissues, based on
recording changes in the total electrical resistance of
tissues. In the classical method of registration, the
electrodes are mounted directly on the surface of the
eye near the lens. It leads to necessity of anesthesia
for conducting researches.
To solve the limitations of the classical technique,
a new registration technique has been developed - the
method of transpalpebral reophthalmography (TP
ROG) (Luzhnov P.V., Shamaev D.M., et al., 2015;
Kiseleva, A., Luzhnov, P., Nikolaev, A., Iomdina, E. and Kiseleva, O.
Nonlinear Dynamics Method in the Impedance Signals Analysis of the Eye Blood Flow of Patients with Glaucoma.
DOI: 10.5220/0007554800750080
In Proceedings of the 12th International Joint Conference on Biomedical Engineering Systems and Technologies (BIOSTEC 2019), pages 75-80
ISBN: 978-989-758-353-7
Copyright
c
2019 by SCITEPRESS – Science and Technology Publications, Lda. All rights reserved
75
Luzhnov P.V., Shamaev D.M., et al., 2017; Shamaev
D. M., Luzhnov P. V., et al., 2016). In this version of
the study, the electrodes are positioned on the closed
eyelid.
Analysis of the received signals includes
qualitative and quantitative analysis. Qualitative
analysis of signals is the definition of the pulse curve
form. Evaluating the type of the pulse curve, usually
emit hypertonic, normotonic and hypotonic types.
Unfortunately, now the method of analyzing the type
of the pulse wave is not objectivized. Factors
affecting vascular tone include biophysical,
biomechanical and hydrodynamic factors. Together,
they affect the type of the pulse curve and further
determine the result of the qualitative analysis of signals.
From the point of view of modern biophysics, the
combination of these factors, namely, their mutual
influence on each other, can be described using the
nonlinear properties of the system (Strogatz H., S.,
2014). Dynamic processes play an important role in
the development and manifestation of the nonlinear
properties of systems, in particular dynamic chaos.
Chaos is characterized, first of all, by internal self-
sustaining fractal fluctuations (Betelin, V.B., Eskov,
V.M., et al. 2017). This effect is found in the analysis
of many biological signals - studies of the electrical
activity of the heart (Elhaj, F., Salim, N., et al., 2016),
neural activity of the brain (Akar S.A., Kara S., et al.,
2015), respiration (Kiseleva A., Luzhnov P., et
al.,2018), and blood filling of various organs. The
theoretical basis for describing chaos in the work
(Takens F., 1981) was proposed by F. Takens. In
accordance with the Takens theorem, using phase-
spatial representations of signals - attractors for
analysis, it becomes possible to conduct their
qualitative and quantitative comparison (Charlton
P.H., Bonnici T., et al. 2017).
Thus, the main idea of this work is to eva-
luate the possibility of types transpalpebral
reophthalmography signals comparing with the help
of nonlinear dynamics methods, assessing the main
comparison parameters and further verifying these
parameters for analyzing signals of a transpalpebral
reophthalmography in patients with primary open-
angle glaucoma.
2 MATERIALS AND METHODS
2.1 Problem Statement
Due to the fact that in the qualitative analysis of pulse
curves, the presence of the physiological relationship
between vascular tones is taken into account, the
signals are usually divided into three main types:
hypotonic, hypertonic and normotonic types. As an
object of study, model signals of these types were
considered. An example of a pulse curve waveform is
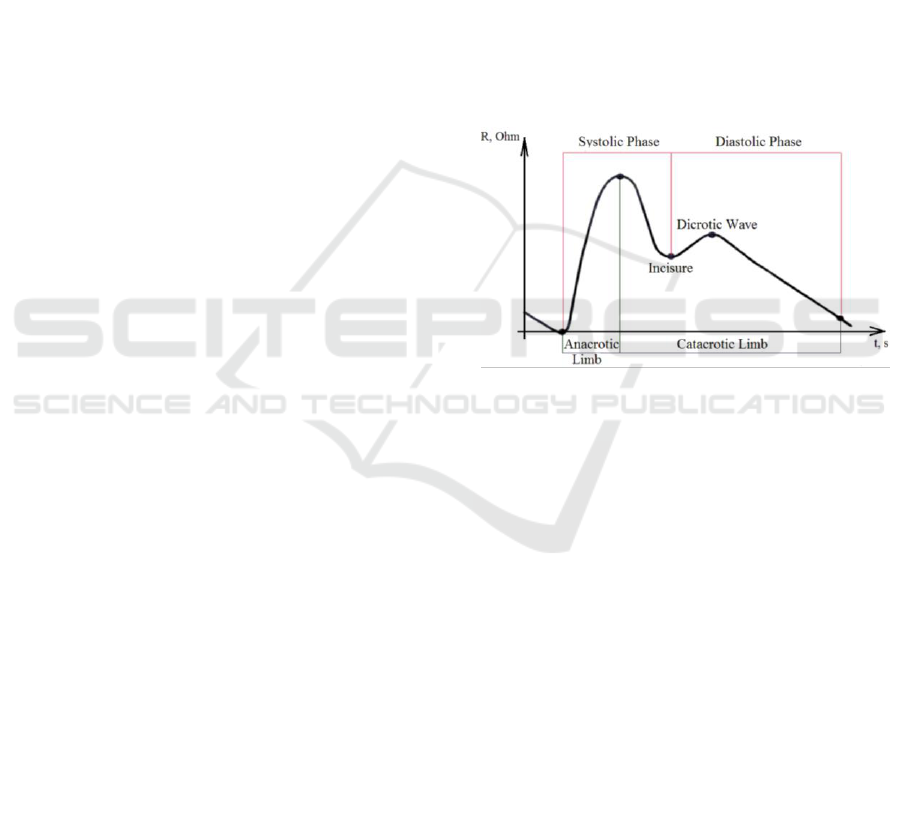
shown in Figure 1.
Currently, a contour analysis based on the method
described in work (Webber C. L., Sbilut J. P., 1994),
is used for the analysis of such type signals (Figure
1). In contour analysis, the most informative
indicators are measured: the amplitudes of the
systolic and diastolic waves, the amplitude of the
rheographic wave at the incisure level, the duration of
the anacrotic limb and the catacrotic limb.
This analysis underlies the classification of
signals currently used in clinical practice. A
significant drawback of this classification is a high
probability of errors during automatic separation of
the signals.
Figure 1: The shape of the pulse blood filling curve of
model signals with the release of the main signal regions.
To solve this problem, it has been proposed to use
the analysis of phase-spatial portraits of the pulse
curve, which allows to classify signals not only by
their quantitative characteristics (wave amplitude
value, length of sections), but also helps to divide
signals into groups with the help of analysing the
shape of the pulse curve itself. As a result, the
following stages of work have been formulated:
Stage 1 - The reconstruction of the pulse curve
attractor;
Stage 2 - The analysis of the obtained form of
the attractors;
Stage 3 - The formulation of the classification
algorithm;
Stage 4 - The verification of results.
2.2 Reconstruction of the Attractor
The phase portrait (signal attractor) can be
constructed in two ways. The first method (the delay
method) involves constructing a pseudo-phase
BIODEVICES 2019 - 12th International Conference on Biomedical Electronics and Devices
76
portrait by displaying the observed values of x (t) on
a subspace with coordinates x (t + d), where d is the
time delay. The second method is based on the
imaging the phase portrait on a subspace with
coordinates x (t), x * (t), where x * (t) is the estimate
of the first derivative of x (t) in the t point (Palit K.,
Mukherjee S., et al., 2013). Due to the fact that TP
ROG signals are complex in their structure, we have
considered the first method to simplify calculations
and reduce processing time.
According to the Takens theorem (Takens F.,
1981), attractor reconstruction process of a biological
system consists in building on a number {x
i
}
i
=
1,...,
∞
a
new (reconstructed) attractor with the same
parameters as the original one, which have been
received as a result of measurement at certain
intervals of the considered signal x(t) (Palit K.,
Mukherjee S., 2011). For this, m-dimensional vectors
are constructed {zj}
j
=
1,...,
∞
, where z
j,k
=x
j+d(k–1)
, where
d - time delay. Then, for sufficiently large m, the
parameters of the reconstructed attractor in the m-
dimensional space Z coincide with the parameters of
the original attractor in the n-dimensional space X
(Webber C. L., Sbilut J. P., 1994). Selection and
calculation of dimension m-dimensional space is
described in (Luzhnov P.V., Shamaev D.M. et. al.,
2018).
The key role for calculating all parameters of the
obtained attractor belongs to the correct choice of
time delay (Webber C. L., Sbilut J. P., 1994).
Typically, the time delay is selected so that each
reconstructed next vector add the most information
about the attractor or less can be correlated with the
previous one (Gracia J., Seppa V-P., et. al., 2017).
When reconstructing biological attractors, stable
results in the selection time delay gives technique
proposed in (Maiorov O. Yu., Glukhov A. B., et al.,
2007), which is based on the form of the original
signal. To analyze the pulse curve, it is necessary to
distinguish in the received portrait the beginning of
the cardiac cycle, the maximum amplitude and
incisure. Based on the analysis of the duration of
these sections, values of 0.08 sec and 0.22 sec have
been chosen in accordance with the data described in
the work (Kiseleva A., Luzhnov P., et al.,2018).
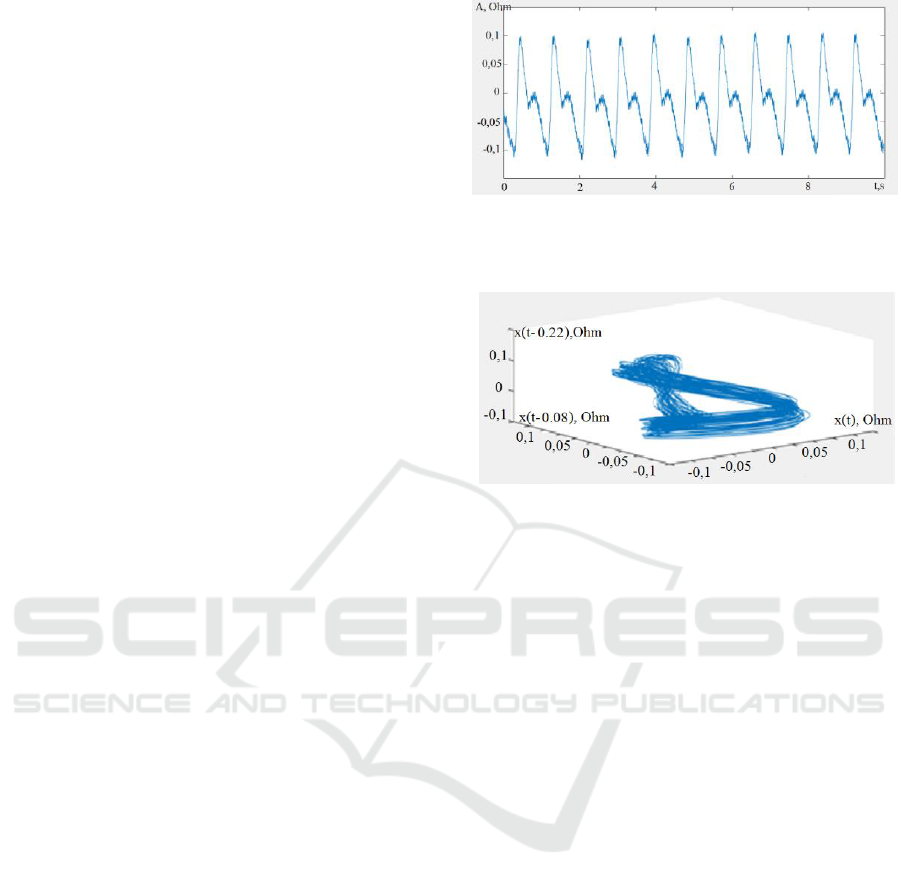
Figure 2 shows an example of the resulting
attractor of the signal of the pulse blood filling with
the 60 seconds duration. The waveform of the signal
itself (Figure 2a) and the resulting signal attractor
(Figure 2b) are shown.
Figure 2(a): The analyzed signal of pulse blood filling (10
sec. section), X axis - time, s, Y axis - signal amplitude,
Ohm.
Figure 2(b): The resulting phase portrait of a signal with the
60 seconds duration, on the X axis: signal x(t), Ohm, on the
Y axis: signal x(t - 0.08), Ohm, on the Z axis: signal x(t -
0.22), Ohm.
2.3 Analysis of the Shape Obtained
Attractors
In (Luzhnov P. V., Shamaev D. M., et al., 2018;
Kiseleva A., Luzhnov P., et al., 2018), an analysis of
the obtained attractors shape based on the mass center
of the obtained figures was considered. In the
framework of these works, the projection of the
attractors on 3 axes (XY, YZ, XZ) was considered,
the resulting form of the attractor was approximated
by two triangles with one common base. In the works,
the ratio of heights drawn from the vertices of
polynomial triangles to a common base was analyzed.
In this work, it has been proposed to modify the
algorithm and consider not the attractors of the pulse
curve, but analyze the attractors of the derived signal.
A significant advantage of this method is the exact
separation of the cardiocycle into systolic and
diastolic components. Figure 3 shows the derivative
of the pulse curve signal and its reconstructed
attractor. Areas A and B correspond to the systolic
and diastolic signal components, respectively.
Nonlinear Dynamics Method in the Impedance Signals Analysis of the Eye Blood Flow of Patients with Glaucoma
77
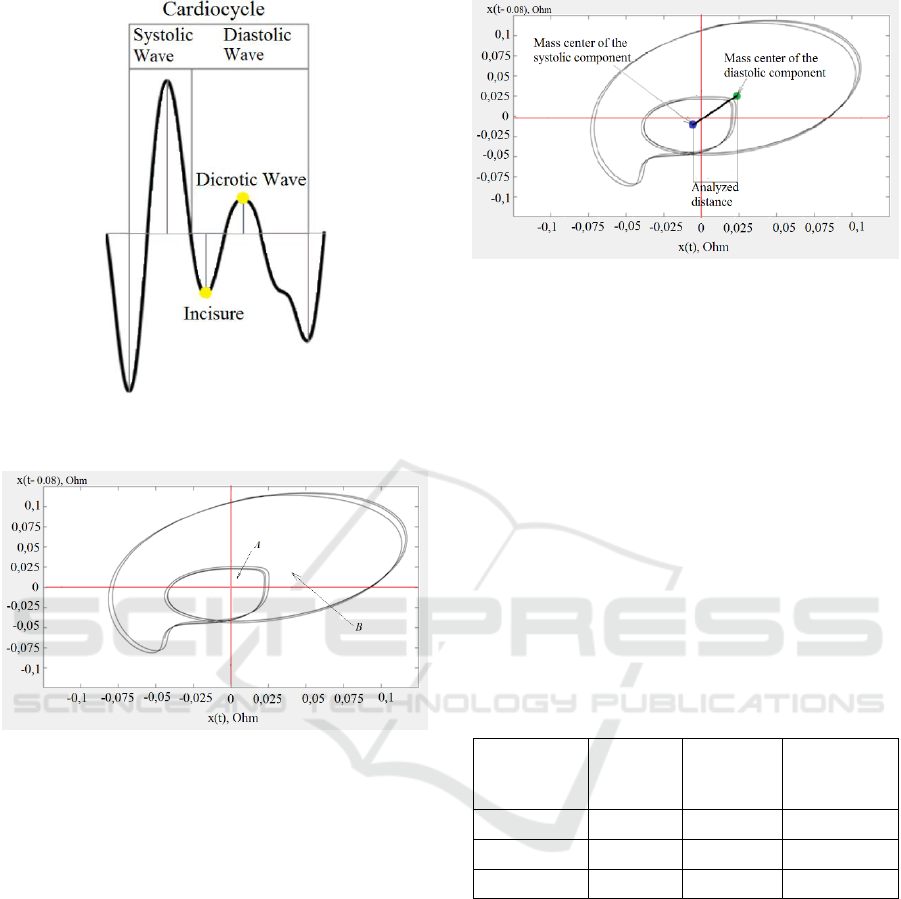
Figure 3(a): Derivative waveform pulse volume,
highlighting the main areas of signal.
Figure 3(b): The attractor derivative signal projected on XY
axis. On the X axis - the signal x (t), Ohm, on the Y axis is
the signal x (t - d), Ohm, area A - the systolic part, area B -
the diastolic part.
2.4 Formulation of the Classification
Algorithm
Analyzing the shape of the attractor (Figure 3b), it is
obvious that the resulting shape can be approximated
by two geometric figures - ovals.
To analyze the obtained forms of the attractor
(Figure 3b), it has been proposed to consider the
distance between the mass centers of regions A and B
(Figure 4). For the introduction of automatic signals
separation, it was necessary to divide the mass centers
of the signals according to three main types:
hypotonic type, hypertonic and normotonic type.
We considered model signals of each type
(normotonic, hypotonic, hypertonic), the
requirements for the centers of mass location for each
signal type (Figure 5) were formulated based on the
Figure 4: The attractor derivative signal with directions the
mass centers of systolic and diastolic components.
analysis. Moreover, it was determined that the
coordinates of the mass center of the systolic
component are identical for signals of three types and
had following coordinates: 0.002 (X coordinate) and
0.002 (Y coordinate). The following visual results
have been obtained on the projection plane of the
phase space based on the model signals with the
condition of their splitting into normotonic,
hypotonic and hypertonic types (Figure 5). The
results with the obtained coordinates of diastolic
centers are presented in Table 1. The diameter of the
region around the mass center of each signal type is
0.001 and was chosen according to the average spread
of the mass centers of the signal around the obtained
point.
Table 1: Mass center coordinates.
Type signal
X
Y
Distance
between
centres
Normotonic
-0.008
-0.008
0.010
Hypotonic
0.001
0.0005
0.001
Hypertonic
-0.002
-0.002
0.004
As a result, the decision rule for signal
classification have been formulated: if the mass
center of the systolic component of the signal falls
within the range of 0.002 (X) and 0.002 (Y), and the
center of the signals diastolic component lies in the
ranges presented in Table 1, the distance between
centers do not exceed the values shown in Table 1 for
each type of signal, then the algorithm will
automatically separate the signals.
BIODEVICES 2019 - 12th International Conference on Biomedical Electronics and Devices
78
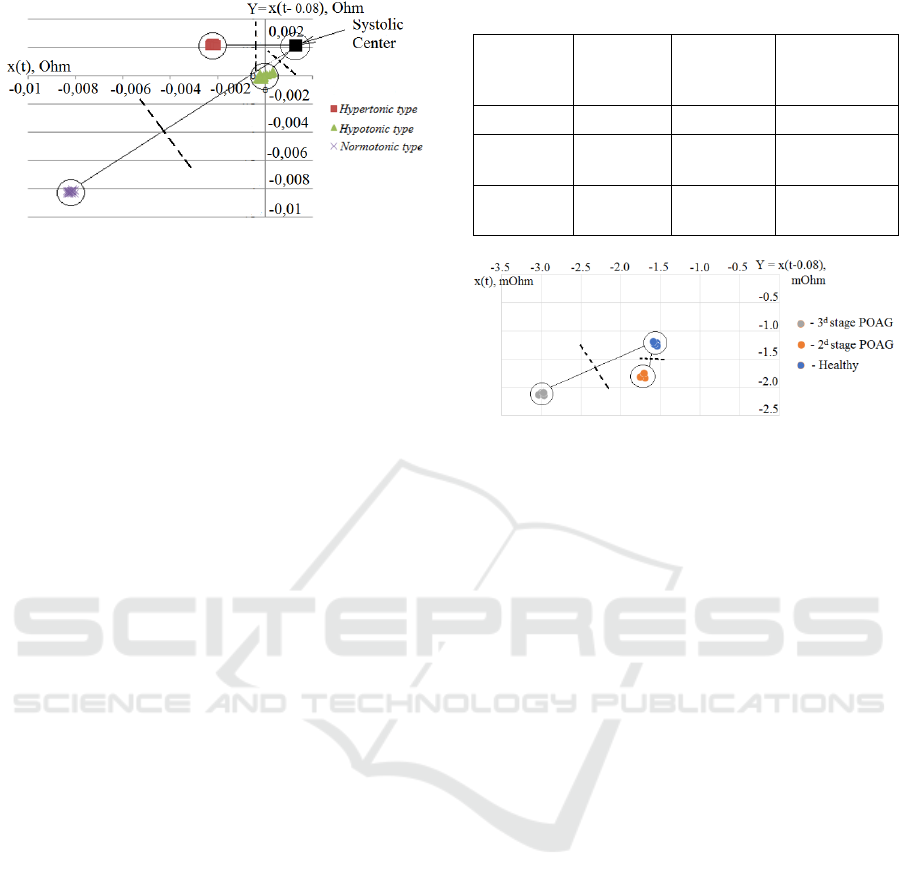
Figure 5: The mass centers of the systolic component and
the diastolic component for the types of signal. The dashed
line shows the boundary separation between the types of
signals.
2.5 Using of the Method in Clinical
Practice
The developed method can be used to classify the
pulse blood filling signals. In our work, the
application of this method for the signals of pulse eye
blood filling was considered. The application of the
considered classification method becomes possible
due to the identity of the forms of the pulse curves.
To test the method on the TP ROG signals, 3 types
of signals have been considered: 1) without
ophthalmopathology; 2) stage II POAG; 3) stage III
POAG. The study was performed in the group of 10
subjects (average age 54.2 ± 15.4 years) without
ophthalmopathology and in the group of 10 patients
with POAG were divided into two parts: the 1-st part
- 6 patients with stage II of POAG (mean age 72.0 ±
8.2 years), the 2-nd part - 4 patients with stage III
POAG (mean age 69.4 ± 6.8 years). The study has
been conducted on each signals type with the 3
seconds duration. Table 2 shows the coordinates of
the obtained diastolic centers. The obtained
coordinates of the systolic center are 0.30 ± 0.30 (X
coordinate) and 0.25 ± 0.02 (Y coordinate).
Similar to Figure 5, in Figure 6 for the case of a
POAG on the plane of projections, the boundaries of
the separation according to the stage of the disease are
shown.
To specify the values of the mass centers, it is
necessary to normalize TP ROG signals amplitudes
and conduct a study on a larger sample of TP ROG
signals.
Table 2: Mass center coordinates for TP ROG signals.
Type
signal
X, mOhm
Y, mOhm
Distance
between
centers
Healthy
-1.5
-1.2
2.1
2
nd
stage
POAG
-1.7
-1.8
2.1
3
d
stage
POAG
-3.0
-2.1
3.8
Figure 6: The centers of mass of the systolic component for
ophthalmic signals. The dashed line shows the boundary
separation between the types of signals.
3 RESULTS
As a result of this work, a new method for separating
signals based on nonlinear dynamics has been
proposed. To solve the problem, the following steps
have been carried out: 1) the methods of nonlinear
dynamics have been considered and the optimal
method for biological systems has been selected; 2)
using the selected method, phase portraits of the
considered biological signals have been
reconstructed; 3) a classification algorithm has been
developed and a decisive rule for signal separation
has been formulated; 4) verification passed.
In the future, it is planned to carry out the
separation of signals in real time, as well as the
possible application of this algorithm for TP ROG
signals analysing for pulse blood filling in eyes
researches.
CONFLICT OF INTEREST
The authors declare that they have no conflict of
interest. The paper was supported by a grant from
RFBR (No.18-08-01192).
Nonlinear Dynamics Method in the Impedance Signals Analysis of the Eye Blood Flow of Patients with Glaucoma
79

REFERENCES
Adler A., Gaburro R., WRB Lionheart, “Electrical
Impedance Tomography”, in Handbook of
Mathematical Methods in Imaging, 2nd ed O Scherzer
(Ed), Springer, 2016.
Akar S.A., Kara S., Agambayev S., Bilgic V. (2015)
Nonlinear analysis of EEG in major depression with
fractal dimensions. 37th Annual International
Conference of the IEEE on Engineering in Medicine
and Biology Society: 7410–7413. DOI:
10.1109/EMBC.2015.7320104.
Betelin, V.B., Eskov, V.M., Galkin, V.A. et al. (2017)
Stochastic volatility in the dynamics of complex
homeostatic systemsDokl. Math. 95: 92. DOI:
10.1134/S1064562417010240.
Caprioli, J., Coleman, A. L. (2010) Blood Pressure,
Perfusion Pressure, and Glaucoma. Am. J.
Ophthalmol. 149, 704–712.
Calvo, P. et al. (2012) Predictive value of retrobulbar
blood flow velocities in glaucoma suspects. Investig.
Ophthalmol. Vis. Sci. 53, 3875–3884.
Charlton P.H., Bonnici T., Tarassenko L., et al. (2017)
Extraction of respiratory signals from the
electrocardiogram and photoplethysmogram: Technical
and physiological determinants. Physiological
Measurement 38(5): 669-690. DOI: 10.1088/1361-
6579/aa670e.
Cherecheanu A.P., Garhofer G., Schmidl D., Werkmeister
R., Schmetterer L. Ocular perfusion pressure and ocular
blood flow in glaucoma. CurrOpinPharmacol. 2013;
13: 36-42. DOI: 10.1016/j.coph.2012. 09.003.
Elhaj, F., Salim, N., Harris, A., Swee, T. and Ahmed, T.
(2016). Arrhythmia recognition and classification using
combined linear and nonlinear features of ECG signals.
Computer Methods and Programs in Biomedicine, 127,
pp.52-63. DOI 10.1016/j.cmpb.2015.12.024.
Gracia J., Seppa V-P., Pelkonen A., Kotaniemi-Syrjanen A.
et al. (2017) Nonlinear Local Projection Filter for
Impedance Pneumography. European Medical
andBiological Engineering Conference 65: 306-309.
DOI: 10.1007/978-981-10-5122-7_77.
Kiseleva A., Luzhnov P., Dyachenko A. and Semenov Y.
(2018). Rheography and Spirography Signal Analysis
by Method of Nonlinear Dynamics.In Proceedings of
the 11th International Joint Conference on Biomedical
Engineering Systems and Technologies - Volume 1:
BIODEVICES, ISBN 978-989-758-277-6, pages 136-
140. DOI: 10.5220/0006579301360140.
Lazarenko V.I., Komarovskikh E.N. Results of the
examination of hemodynamics of the eye and brain in
patients with primary
open-angle glaucoma. Vestnik Oftal’mologii 120(1),
32–36 (2004).
Luzhnov P.V., Shamaev D.M., Iomdina E.N., Markosyan
G.A., Tarutta E.P., Sianosyan A.A. (2017) Using
quantitative parameters of ocular blood filling with
transpalpebralrheoophthalmography. In: Eskola H.,
Väisänen O., Viik J., Hyttinen J. (editors). EMBEC &
NBC 2017. IFMBE Proceedings, vol. 65; p. 37–40,
https://doi. org/10.1007/978-981-10-5122-7_10.
Luzhnov P.V., Shamaev D.M., Iomdina E.N., Tarutta E.P.,
Markosyan G.A., Shamkina L.A., Sianosyan A.A.
(2015) Transpalpebraltetrapolarreoophtalmography in
the assessment of parameters of the eye blood
circulatory system.
VestnikRossiiskoiakademiimeditsinskikhnauk; 70(3):
372–377, https://doi.org/10.15690/vramn.v70i3.1336.
Luzhnov P. V., Shamaev D. M., Kiseleva A. A., Iomdina E.
N. (2018), Analyzing rheoophthalmic signals in
glaucoma by nonlinear dynamics methods. IFMBE
Proceedings 68/2: pp.827-831. DOI: 10.1007/978-981-
10-9038-7_152.
Maiorov O. Yu., Glukhov A. B., Prognimak A. B.,
Fenchenko V. N. (2007) Realization of the method of
displacement by estimating the sizes of the axes of the
attractor of the dynamic brain system. - Proceedings of
the Institute of Cybernetics. - K., p. 153, pp. 5–12.
Palit K., Mukherjee S., Bhattacharya D.K. (2013) A high
dimensional delay selection for the reconstruction of
proper phase space with cross auto-
correlation.Neurocomputing 113: 49-
57.https://doi.org/10.1016/j.neucom.2013.01.034.
Palit K., Mukherjee S. (2011) Generalized autocorrelation
and its application in attractorreconstruction. Bull. Pure
Appl. Math. 5(2): 218–230.
Quigley, H. A., Broman, A. T. (2006) Number of people
with glaucoma worldwide. Br. J. Ophthalmol. 90, 262–
267.
Shamaev D. M., Luzhnov P. V., Pika T. O., Iomdina E. N.,
Kleyman A. P., Sianosyan A. A. (2016), Applying
transpalpebral rheoophthalmography to monitor
effectiveness of the treatment of patients with
glaucoma”. International Journal of Biomedicine 6(4):
pp.287–289. DOI: 10.21103/Article6(4)_OA8.
Strogatz H., S. (2014). Nonlinear Dynamics and Chaos.
With Applications to Physics, Biology, Chemistry, and
Engineering. 2nd ed. Boca Raton, p.532.
Takens F. Detecting strange attractors in turbulence / In
Rand D.A. and Young L.S. // Dynamical Systems and
Turbulence, Lecture Notes in Mathematics. 1981. V.
898. Р. 366–381.
Venkataraman, S. T., Flanagan, J. G. & Hudson, C.
(2010) Vascular Reactivity of Optic Nerve Head and
Retinal Blood Vessels in Glaucoma- A
Review. Microcirculation 17, 568–581.
Webber C. L., Sbilut J. P. Dynamic Assessment of
Physiological Systems and States Using Rrecurrence
Plot Strategies.// J. Appl. Physiol., 1994, 76, p.965–
993.
BIODEVICES 2019 - 12th International Conference on Biomedical Electronics and Devices
80
