
Generation of 3D Building Models from City Area Maps
Roman Martel
1
, Chaoqun Dong
1
, Kan Chen
1
, Henry Johan
2
and Marius Erdt
1,2
1
Fraunhofer Singapore, Singapore
2
Nanyang Technological University, Fraunhofer IDM@NTU, Singapore
Keywords:
Computer Vision, 3D Building Models, City Area Maps, Text Recognition, Deep Learning.
Abstract:
In this paper, we propose a pipeline that converts buildings described in city area maps to 3D models in the
CityGML LOD1 standard. The input documents are scanned city area maps provided by a city authority.
The city area maps were recorded and stored over a long time period. This imposes several challenges to
the pipeline such as different font styles of typewriters, handwritings of different persons, varying layout, low
contrast, damages and scanning artifacts. The novel and distinguishing aspect of our approach is its ability to
deal with these challenges. In the pipeline we, firstly, identify and analyse text boxes within the city area maps
to extract information like height and location of its described buildings. Secondly, we extract the building
shapes based on these locations from an online city map API. Lastly, using the extracted building shapes and
heights, we generate 3D models of the buildings.
1 INTRODUCTION
A 3D model of a city is a valuable tool for city aut-
horities to plan new construction projects. In the past,
city planning was done using hand drawings and ty-
pewriters. Therefore, for many older city areas there
is no digital data available which can be utilized by
3D modeling and rendering tools. Usually, creating
3D models of buildings in these areas is done manu-
ally which is time consuming and costs lots of efforts.
In this paper, we propose a pipeline to generate 3D
building models automatically based on archived city
area maps provided by city authorities.
Our input city area maps contain streets, smaller
overview maps and buildings with detailed shapes. A
couple of these buildings are marked. For the marked
buildings, several text boxes, distributed around the
map, add various additional information. The input
in Figure 1 shows an example city area map. These
maps pose several challenges for automatic document
analysis. As they are often maintained over a long
time period, they exhibit different font styles of ty-
pewriters and many different handwritings. Further-
more, the general layout of the documents varies as
well. For example, the text boxes with additional
building information can appear at arbitrary locati-
ons. In addition, long storage in archives may lead
to low contrast and damages. Making the city area
maps available to digital processing by scanning can
yield to additional artifacts.
The novelty of our approach lies in its robustness
to deal with these challenges. The output of our pi-
peline is a list of 3D models for all the marked buil-
dings in the city area maps. We use the CityGML
standard (Gr
¨
oger et al., 2012) with level of detail
(LOD) 1 to store our models. LOD1 is used for sim-
ple building models with no details which are, howe-
ver, sufficient to get an overview of a city area. The
output in Figure 1 shows an example for CityGML
LOD1 models. Whenever we use the term 3D model,
we mean a model according to this standard.
This paper is structured as follows. Section 2 sum-
marizes related work. Section 3 gives an overview of
the proposed pipeline. Subsequently, in Sections 4, 5
and 6 the different parts of the pipeline are described
in detail. Finally, Section 7 summarizes our results
and outlines future work.
2 RELATED WORK
Previous work related to the analysis of city area maps
focused on the analysis of floor plans of single buil-
dings (Ahmed et al., 2011) or the automatic detection
of rooms in floor plans (Ahmed et al., 2012). In the
context of 3D building model generation (Sugihara
et al., 2015) proposed a pipeline to automatically ge-
nerate models based on polygons which have been
manually marked on a 2D digital map before. (Bil-
Martel, R., Dong, C., Chen, K., Johan, H. and Erdt, M.
Generation of 3D Building Models from City Area Maps.
DOI: 10.5220/0007554905690576
In Proceedings of the 14th International Joint Conference on Computer Vision, Imaging and Computer Graphics Theory and Applications (VISIGRAPP 2019), pages 569-576
ISBN: 978-989-758-354-4
Copyright
c
2019 by SCITEPRESS – Science and Technology Publications, Lda. All rights reserved
569
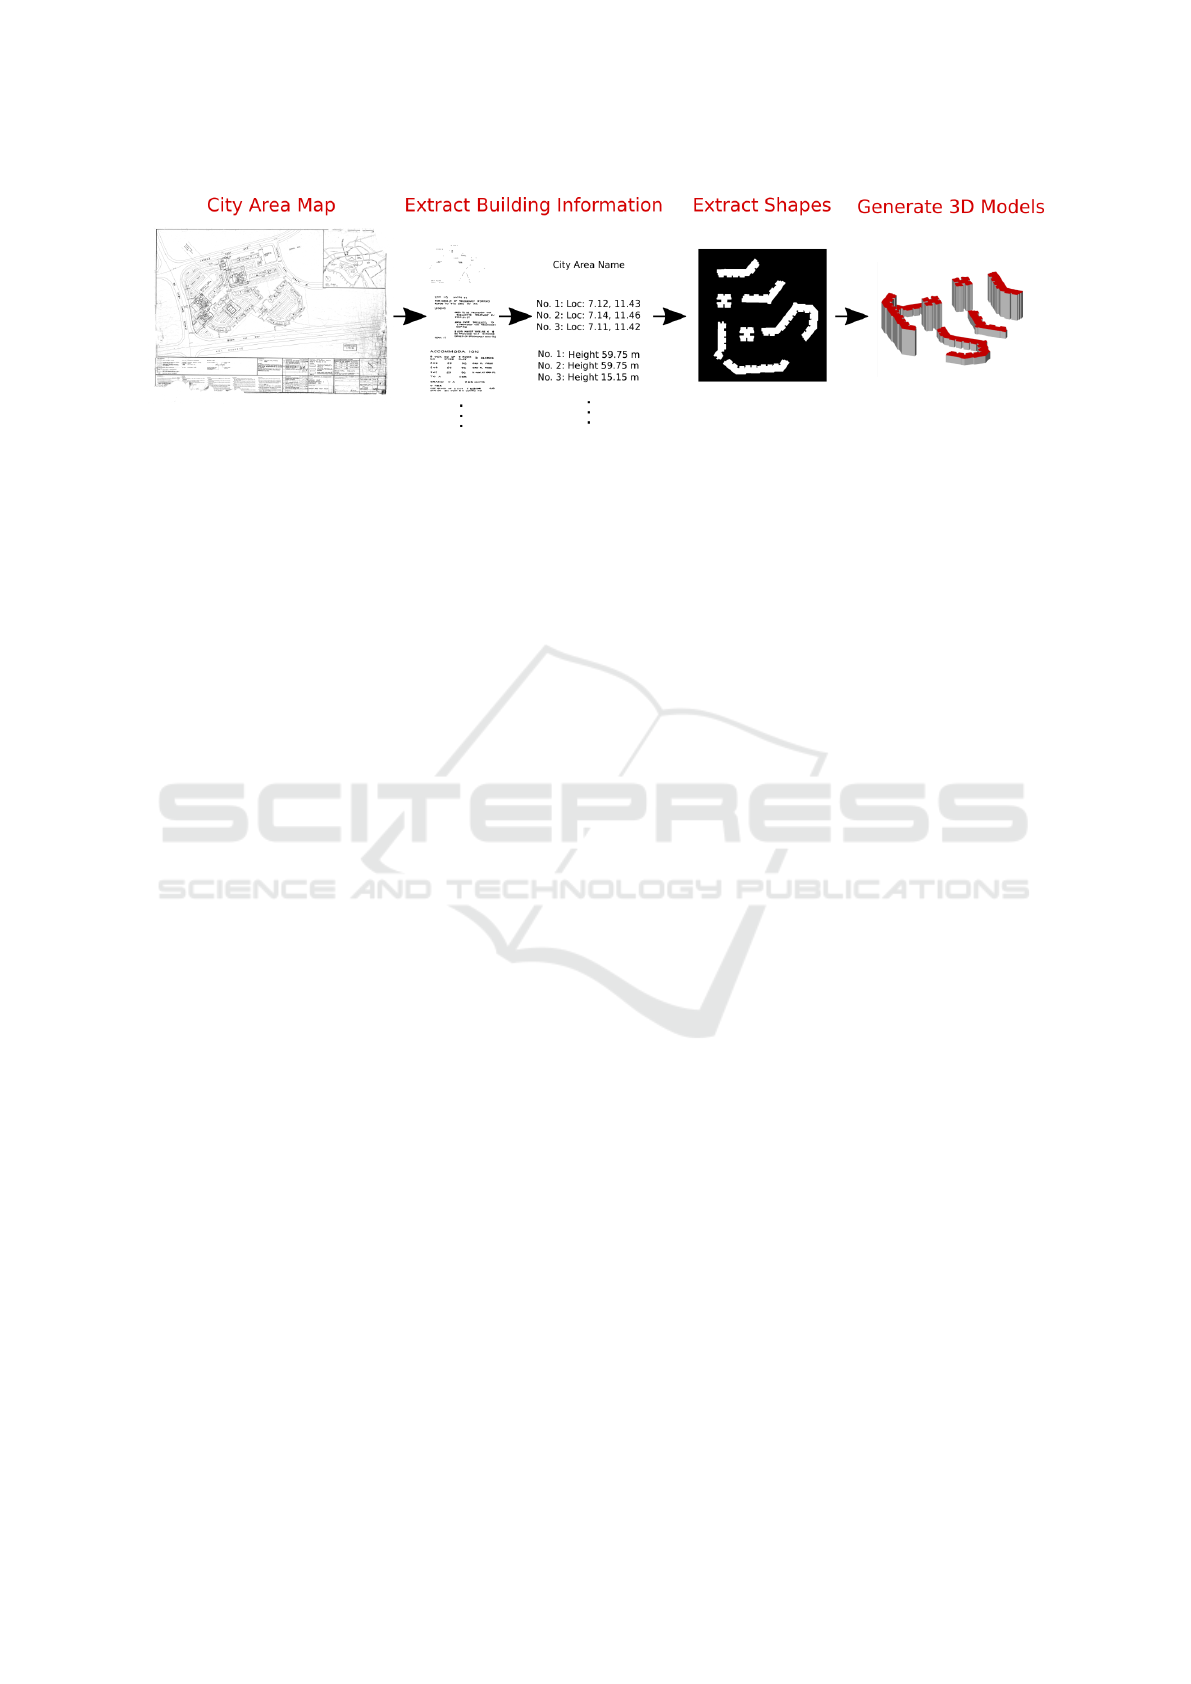
Figure 1: Overview of the proposed pipeline. The input is a city area map with text boxes describing several marked buildings.
First, the content of the text boxes are analysed and information like location and height for all marked buildings extracted.
Afterwards, using the locations, the shape of the buildings are extracted from an online city map API. Finally, 3D models are
generated based on the shape and height information.
jecki et al., 2017) also investigated the generation of
building models with a low level of detail. Their ap-
proach uses building footprints, additional informa-
tion about the building and statistical data to deduce
the height and shape of the buildings. A variety of ap-
proaches have been developed for the reconstruction
of very detailed building models based on photo and
laser scanning data. An overview can be found in
(Fritsch and Klein, 2018). Furthermore, the CityGML
standard (Gr
¨
oger et al., 2012), used to store the re-
sulting 3D models of our pipeline, is itself focus of
ongoing research (Biljecki et al., 2016).
The text analysis methods used in Section 4 are
related to previous work in text detection and recogni-
tion. Comprehensive surveys of this area can be found
in (Ye and Doermann, 2015) and (Zhu et al., 2016).
Most recent approaches which are able to deal with
challenging scenarios are based on deep neural net-
works (Jaderberg et al., 2016), (Bartz et al., 2017a),
(Zhou et al., 2017), (Liu et al., 2018). They exhi-
bit impressive results in terms of accuracy and ro-
bustness to variations of image quality, illumination,
text fonts, rotations and distortions. They, however,
also heavily depend on large image data sets with ap-
propriate labeling. The previous approaches which
are most relevant to ours rely on manually designed
features like extremal regions (Neumann and Matas,
2010), (Neumann and Matas, 2012) or stroke width
measures (Epshtein et al., 2010). They first seek cha-
racter candidates using the features and rely on post
processing and classifiers to filter out the true cha-
racters. Due to the unique character of the input city
area maps and the consequential lack of appropriately
labeled data we chose a similar approach to (Neu-
mann and Matas, 2010) for the text analysis part of
our pipeline. We also extract maximally stable ex-
tremal regions (MSER) and use post-processing and
a classifier to detect true characters. An additional
argument for this approach is the availability of an
open-source implementation for the MSER extraction
(Bradski, 2000).
3 OVERVIEW OF THE
PROPOSED PIPELINE
We propose a pipeline that converts buildings in a city
area map to 3D models in the CityGML LOD1 stan-
dard. The overview of this pipeline is illustrated in
Figure 1. The input are scanned versions of archi-
ved city area maps provided by city authorities. These
maps contain among others a couple of marked buil-
dings which are described in more detail in several
text boxes. We assume that these text boxes contain
information about the location and height of the mar-
ked buildings. The provided city area maps show a
large variation of quality, style and layout. We, the-
refore, invested a lot of effort to make the proposed
pipeline robust to this versatile input. Our approach
can be divided into three parts. For all marked buil-
dings in the city area maps, we
1. use text analysis to extract the location and
height from the text boxes describing the building
(Section 4).
2. search the location with an online city map API
and extract the shape from the resulting city area
image (Section 5).
3. generate a 3D model using the extracted shape and
height (Section 6).
4 BUILDING INFORMATION
EXTRACTION
This section describes the extraction of the location
and height information of buildings in the city area
VISAPP 2019 - 14th International Conference on Computer Vision Theory and Applications
570
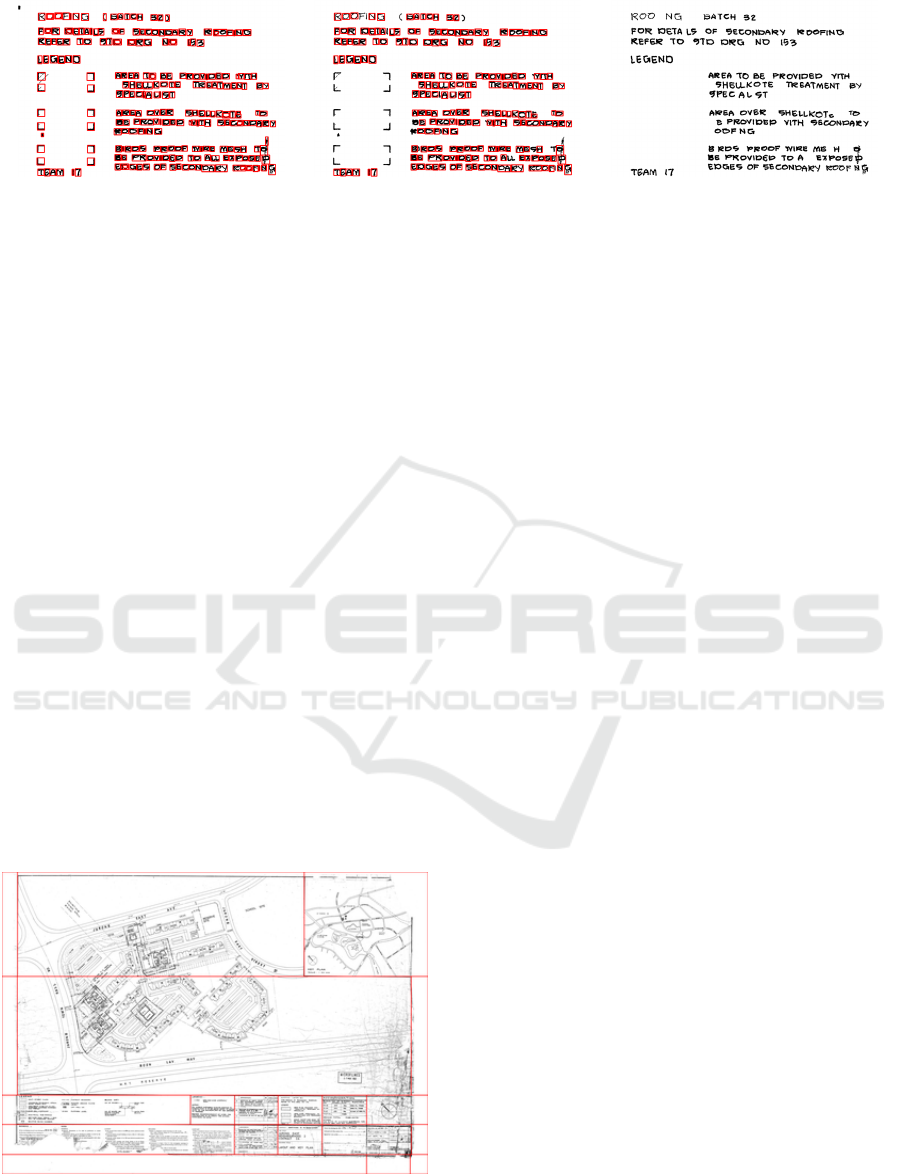
(a) Result of finding text character
candidate regions using MSER
(Matas et al., 2002). Each detected
region is marked with a box.
(b) Text vs non-text classification
result. The classifier correctly finds
most of the text boxes while
excluding non-text elements.
(c) The same text box after
extracting the regions classified as
text characters.
Figure 2: Example for the text extraction for a segmented text box of a city area map.
maps. The input are the previously described city
area maps. Several text boxes, distributed at arbi-
trary locations in the maps, add additional informa-
tion for a couple of marked buildings. However, these
text boxes contain many non-text elements as well.
This makes it impossible to process them with Optical
Character Recognition (OCR) software directly. The
non-text elements can be of arbitrary nature. Typical
are drawings, diagrams, grid cells, separation lines,
noise and artifacts due to the scanning process.
Our approach therefore contains several steps:
1. Segmenting the text boxes in the input maps
(Section 4.1)
2. Extracting candidates for characters in the text
boxes (Section 4.2)
3. Classifying these candidates into text or non-text
(Section 4.3)
4. Recognizing the content of the characters classi-
fied as text (Section 4.4)
4.1 City Area Map Segmentation
Figure 3: Example for a city area map segmentation result.
The segments mainly align with the text box borders. The
segmentation of the map area is irrelevant because the target
information is contained in the text boxes only.
We segment the full city area map into smaller
parts containing the text boxes and fragments of the
map. Our method uses simple image statistics. We
extract long horizontal and vertical lines from the map
using a rank filter (Soille, 2002). This results in an
image containing mainly the separating lines of the
text boxes. The city area maps have been binarized
during the scanning process. Therefore, to find the
location of the lines separating the boxes, we sim-
ply count the black pixels per line and column. We
smooth the resulting pixel count curves to make our
approach robust to noise and small rotations in the
documents. Finally, we create a histogram of all pixel
count maxima. The highest p percentile of the max-
ima count values are considered to be separating lines
with p being an empirically determined hyperparame-
ter of our approach. The result of this method applied
on a typical city area map is shown in Figure 3.
4.2 Character Candidate Extraction
After the image segmentation, we continue proces-
sing each segmented text box separately. To get pos-
sible candidates for characters we first apply a median
filter to denoise the text box. Afterwards, we extract
the candidates using the maximally stable extremal
regions (MSER) algorithm (Matas et al., 2002). The
output of this method are regions surrounding possi-
ble characters. Figure 2a shows an example where
each detected region is marked with a box. These re-
gions are eventually extracted resulting in an image
containing only the parts within the regions.
4.3 Text vs. Non-text Classification
Identifying which character candidates are real alpha-
numeric characters or not is a typical binary classifi-
cation problem. To solve it, we experimented with a
couple of machine learning models ranging from Lo-
gistic Regression, Support Vector Machines to Con-
volutional Neural Networks (CNN). To train these
Generation of 3D Building Models from City Area Maps
571
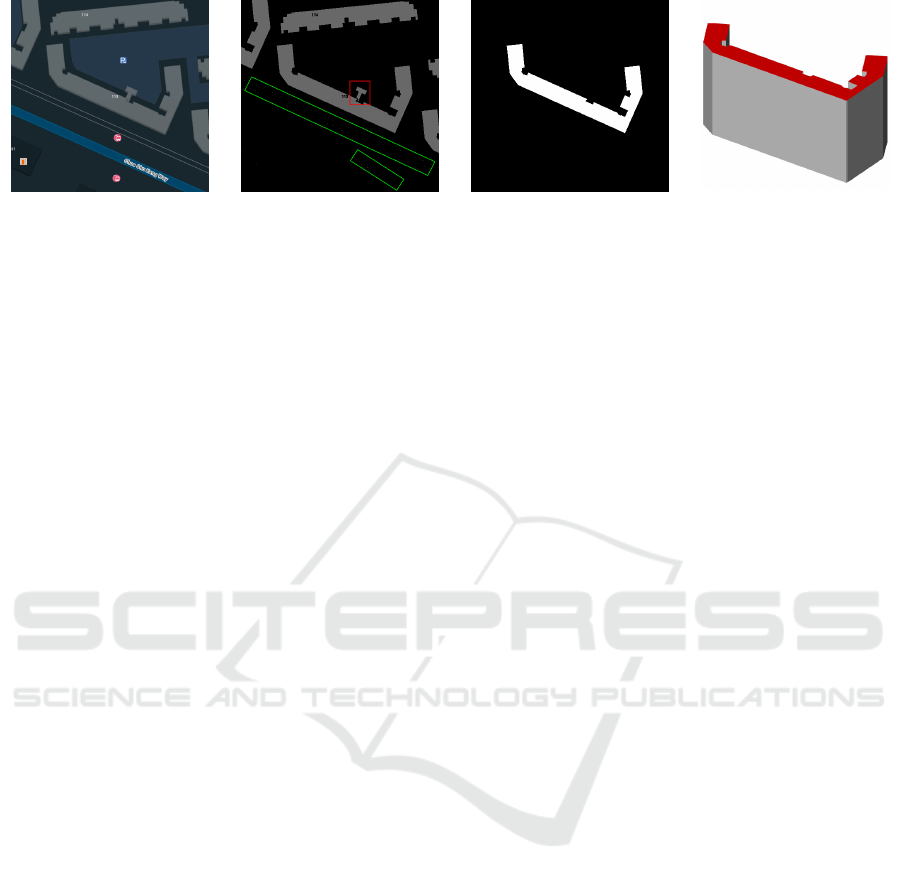
Figure 4: Image retrie-
ved from the new One-
Map Static Map API by
the center coordinates of
Block No.113 (NewOne-
Map, 2018).
Figure 5: Thresholding re-
sult with a contiguous noisy
object indicated in red rec-
tangular.
Figure 6: Extracted shape
of the target building.
Figure 7: Result of the 3D
model generation for the
shape shown in Figure 6.
models we, however, needed to first create a data set.
We therefore took a subset of all character candida-
tes and manually labeled them to be alphanumeric or
not. The result was a data set with 12602 images of
which 54% represented real alphanumeric characters.
Afterwards, we trained the different models on this
data set. So far, we achieved the best classification
results on a hold-out test set with a simple VGG-like
CNN (Simonyan and Zisserman, 2014). An example
of applying this classifier on a text box containing the
extracted character candidate regions can be seen in
Figure 2b. The boxes mark characters identified as
alphanumeric. Extracting only the regions of the cha-
racters within these boxes yields Figure 2c.
4.4 Text Recognition
The resulting text boxes containing the plain text only
can finally be used as input for an Optical Character
Recognition (OCR) software. There are several OCR
tools designed for this task (Smith, 2007), (Breuel,
2008). Furthermore, there are deep learning appro-
aches which could also be utilized (Shi et al., 2015),
(Bartz et al., 2017b). As we deal with texts containing
several different font styles and handwriting, we need
to fine-tune a model for an OCR software or deep le-
arning architecture to our data. This is still work in
progress and the only yet missing part of the pipeline.
The result of these tools is the text content of the
text boxes in the city area maps. This content can
hence be processed by standard text search engines.
The location and height information in the provided
city area maps are indicated consistently across the
whole data set by the same keywords. One can there-
fore search the text content for these keywords to find
the location and height for each described building.
This will serve as input for the following parts of the
pipeline.
5 BUILDING SHAPE AND SIZE
EXTRACTION
5.1 Shape Extraction
In order to generate the 3D model of a target building,
whose location and height information are obtained
from text extraction and recognition as described
above, the next step is to get the building shape and
size. However, processing a city area map as shown
in Figure 3 may lead to less accurate building shape
and size. This is because some of the old maps were
drawn by hand and afterwards digitalized by scan-
ning. Hence, inaccuracies due to the limitation of hu-
man drawing precision, the thickness of the pen and
other undesired noise is inevitable. Furthermore, de-
aling with such complicated noisy images generally
means longer computational time.
Due to the aforementioned reasons, instead of
using the original archived city area map, our met-
hod extracts a more accurate building shape and size
in a faster way by leveraging an online API, which is
the new OneMap API. Specifically, we used new On-
eMap Search API and Static Map API (NewOneMap,
2018). The Search API returns the coordinates of a
building based on its address. The Static Map API
returns an image of a map section based on some pre-
defined parameters such as image center coordinates,
zoom level, image size and so on. Figure 4 shows an
example image retrieved by the API based on the cen-
ter coordinates of a certain building. (Block No.113,
which is the target building in this case.)
For the purpose of getting as many details as pos-
sible, we use the maximum zoom level and the big-
gest image size provided by the new OneMap Static
Map API. Only a grayscale version of this image will
be processed later. Dealing with such an image will
lead to much more accurate building shape and scale
VISAPP 2019 - 14th International Conference on Computer Vision Theory and Applications
572
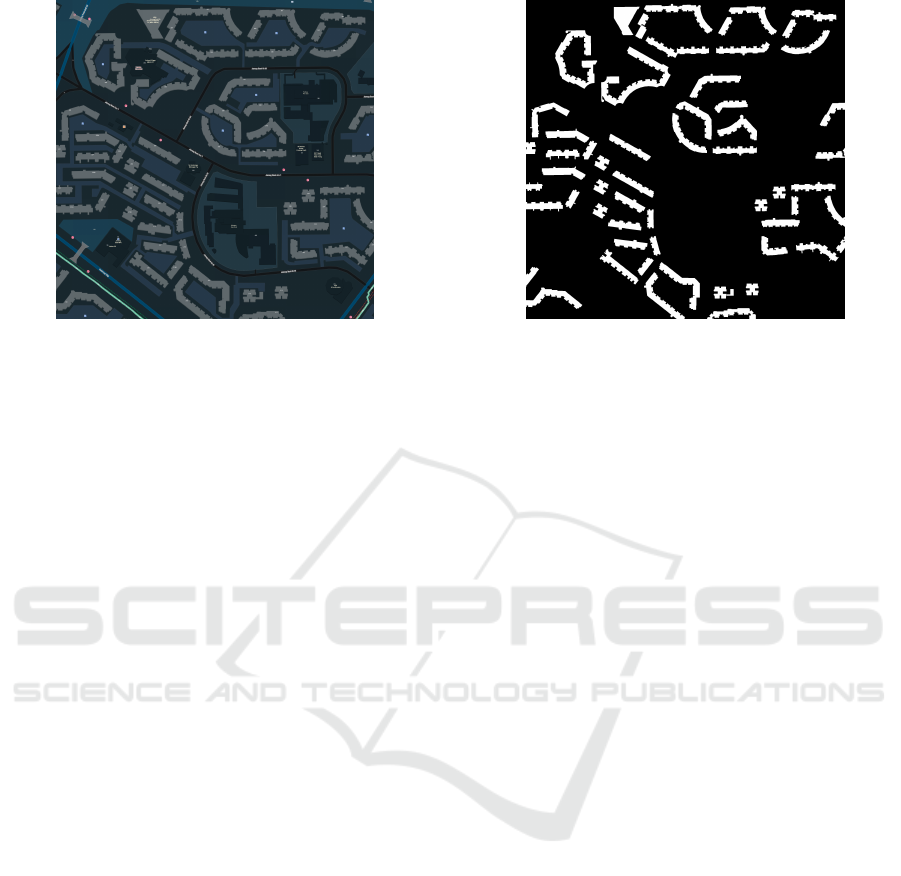
Figure 8: Image of a large neighborhood retrieved from the
new OneMap Static Map API (NewOneMap, 2018).
as well as a much shorter processing time compared
to working on a noisy and possibly damaged archived
plan.
In the retrieved images of the new OneMap Sta-
tic Map API, all buildings of interest, which are the
public housing buildings, have the same grayscale va-
lue. Hence, one simple thresholding operation is able
to segment all of them successfully. Then, we can get
the target building boundary shape based on the con-
tour characteristics of all the objects left after thres-
holding. Firstly, we remove all the objects whose con-
tour area is small. The main purpose of doing this is
to get rid of contiguous objects around the target buil-
ding. According to the original city area map, these
objects are surrounding constructions, which are not
part of the target building. Figure 5 illustrates such an
object among all the segmented building candidates
by drawing a red box around it. Additionally, small
building parts cropped along the image boundary and
other noise sharing the same grayscale value (small
dots below Block No.113 in the green boxes in Fi-
gure 5) are eliminated as well. Secondly, we pick
the object whose contour centroid is the closest to
the image center among all the remaining objects as
the target building. As mentioned before, the target
building center coordinates are returned from the new
OneMap Search API then passed to the new OneMap
Static Map API. The Static Map API uses these coor-
dinates as the generated image center. Therefore, the
target building centroid and the image center overlap
in most of the cases in which the building has a regu-
lar shape. Finally, the shape of the target building is
extracted based on the detected contour. The result is
shown in Figure 6.
Figure 9: Extracted shapes of the target buildings in a large
neighborhood.
5.2 Size Computation
Since a fixed zoom level is used in the new One-
Map Static Map API for generating the images, we
can compute the actual size of the building based on
the scale corresponding to this zoom level. Later, by
combining the computed actual size of the building
planar with the extracted building height from text
analysis part, we are able to generate the 3D building
models with correct ratio. The advantage of this met-
hod is that the scale is universal for all buildings if the
zoom level is unchanged, as in our case. This is ex-
tremely useful for creating 3D models of a large neig-
hborhood. Conversely, for the archived city maps, the
scale used for drawing may change from map to map.
When creating 3D models for all buildings in a large
area or even a whole city, several maps with different
scales may be used. As a consequence, extra effort is
needed to align the scales between different maps if
we directly extract the building shapes and sizes from
the archived city area maps.
6 3D MODEL GENERATION
Based on the shape and the size information from
Section 5, we first refine the extracted shape of a
building ground print using image processing operati-
ons (dilation, erosion and contour retrieval). We then
extrude it to 3D using the height information from
Section 4. As such, we can generate 3D models for
all buildings described in the input city area map. An
example of a resulting 3D model is shown in Figure
7.
Figure 8 shows a big neighborhood retrieved from
the new OneMap Static Map API and Figure 9 shows
the extracted shapes of all the target buildings in this
Generation of 3D Building Models from City Area Maps
573

Figure 10: A view of 3D models of all target buildings from the neighborhood in Figure 8.
Figure 11: Another view of 3D models of all target buildings from the neighborhood in Figure 8.
neighborhood by our method. As described above,
with the size and height information we can gene-
rate 3D models of these buildings with correct ratio.
Figure 10 and Figure 11 give illustrations of the 3D
building models in such a big neighborhood from two
different views.
7 CONCLUSIONS AND FUTURE
WORK
We have proposed a pipeline to automatically gene-
rate 3D building models based on archived city area
maps. The pipeline is still in the middle of implemen-
tation as the text recognition part, described in Section
4.4, is still in development. We, however, showed re-
sults for the automatic extraction of text from the city
area maps such that it can serve as input for typical
OCR tools. During that, we showed how to deal with
the challenges of the input maps. We demonstrated
how to segment text boxes from non-text areas and
how to separate text characters from other elements
like noise or drawings. Furthermore, assuming that
we find the location and height information, we sho-
wed how to extract the shape and size of buildings
using the new OneMap APIs. Finally, we presented
results for generating 3D building models using the
height, shape and size information.
The novelty and challenge of our approach is that
it leverages generally available data sources which
are however not primarily designed for the generation
of 3D building models. The building information is
obtained from scanned analog maps and the shape de-
duced from an online city map which contains much
more content irrelevant for the task. In contrast, the
approach in (Sugihara et al., 2015) relies on additi-
onal polygons added to a digital map. The building
information like number of stories is also provided
digitally for each polygon. In (Biljecki et al., 2017)
plans containing solely building footprints and a di-
gital database with additional information about each
building is used. Therefore, compared to our appro-
ach, the usage of text detection and recognition is not
necessary and both are able to deliver more detailed
results. The building models in (Sugihara et al., 2015)
have a higher level of detail because of the detailed
annotations in the polygons and in (Biljecki et al.,
2017) the height estimation is more precise, due to
the combination of several data sources.
The limitation of the building information ex-
traction is that some characters like ’i’, ’t’, ’j’, ’l’ and
VISAPP 2019 - 14th International Conference on Computer Vision Theory and Applications
574

’1’ are difficult to differentiate from the noise in the
maps. As a consequence, the current classifier tends
to exclude these characters which are therefore often
missing in the extracted text. We plan to fix this is-
sue by adding more examples for these cases to our
training data set. Besides that, to complete the imple-
mentation of the pipeline, we are still working on fine
tuning an OCR model to recognize the extracted text.
To do this, we need to create a second data set contai-
ning the extracted words and sentences and manually
label them with the correct text content.
Figure 12: Image re-
trieved with annotation
on top of target buil-
ding (Block No.243)
boundary (NewOneMap,
2018).
Figure 13: Extraction of
distorted target building
shape.
For the shape extraction part, one of the current
major problems is that some annotations may lay on
top of the building boundary. Then after shape ex-
traction, the retrieved building shape will be distorted.
In Figure 12, the block number is overlapped with the
building boundary of Block No.243. Figure 13 shows
the failure case of extracting its shape. We plan to add
post-processing to refine the extracted shape for such
a situation. Also, even though the maximum zoom
level of the new OneMap Static Map API is used for
generating the image to be processed, its resolution is
still a bit too low, so some artifacts may be introdu-
ced along the building boundary. We intend to add
image super resolution or vectorization parts to over-
come this problem.
ACKNOWLEDGEMENTS
This research is supported by the National Research
Foundation, Prime Ministers Office, Singapore under
the Virtual Singapore Programme.
Furthermore, we gratefully thank the Housing &
Development Board (HDB) for providing us the ar-
chived neighborhood maps.
We also want to express our appreciation to new
OneMap for providing us their APIs to retrieve their
map images.
REFERENCES
Ahmed, S., Liwicki, M., Weber, M., and Dengel, A. (2011).
Improved automatic analysis of architectural floor
plans. In 2011 International Conference on Document
Analysis and Recognition, pages 864–869.
Ahmed, S., Liwicki, M., Weber, M., and Dengel, A. (2012).
Automatic room detection and room labeling from ar-
chitectural floor plans. In 2012 10th IAPR Internati-
onal Workshop on Document Analysis Systems, pages
339–343.
Bartz, C., Yang, H., and Meinel, C. (2017a). See: To-
wards semi-supervised end-to-end scene text recogni-
tion. arXiv preprint arXiv:1712.05404.
Bartz, C., Yang, H., and Meinel, C. (2017b). STN-OCR:
A single neural network for text detection and text re-
cognition. CoRR, abs/1707.08831.
Biljecki, F., Ledoux, H., and Stoter, J. (2016). An improved
LOD specification for 3D building models. Compu-
ters, Environment and Urban Systems, 59:25–37.
Biljecki, F., Ledoux, H., and Stoter, J. (2017). Generating
3D city models without elevation data. Computers,
Environment and Urban Systems, 64:1–18.
Bradski, G. (2000). The OpenCV Library. Dr. Dobb’s Jour-
nal of Software Tools.
Breuel, T. M. (2008). The OCRopus open source OCR sy-
stem.
Epshtein, B., Ofek, E., and Wexler, Y. (2010). Detecting
text in natural scenes with stroke width transform.
In Computer Vision and Pattern Recognition (CVPR),
2010 IEEE Conference on, pages 2963–2970. IEEE.
Fritsch, D. and Klein, M. (2018). 3D preservation of buil-
dings – reconstructing the past. Multimedia Tools and
Applications, 77(7):9153–9170.
Gr
¨
oger, G., Kolbe, T., Nagel, C., and H
¨
afele, K. (2012).
OGC city geography markup language (CityGML)
encoding standard, version 2.0, ogc doc no. 12-019.
Open Geospatial Consortium.
Jaderberg, M., Simonyan, K., Vedaldi, A., and Zisserman,
A. (2016). Reading text in the wild with convolutional
neural networks. International Journal of Computer
Vision, 116(1):1–20.
Liu, X., Liang, D., Yan, S., Chen, D., Qiao, Y., and Yan, J.
(2018). FOTS: Fast oriented text spotting with a uni-
fied network. In Proceedings of the IEEE Conference
on Computer Vision and Pattern Recognition, pages
5676–5685.
Matas, J., Chum, O., Urban, M., and Pajdla, T. (2002). Ro-
bust wide baseline stereo from maximally stable ex-
tremal regions. In Proceedings of the British Machine
Vision Conference, pages 36.1–36.10. BMVA Press.
doi:10.5244/C.16.36.
Neumann, L. and Matas, J. (2010). A method for text lo-
calization and recognition in real-world images. In
Asian Conference on Computer Vision, pages 770–
783. Springer.
Neumann, L. and Matas, J. (2012). Real-time scene text
localization and recognition. In Computer Vision and
Pattern Recognition (CVPR), 2012 IEEE Conference
on, pages 3538–3545. IEEE.
Generation of 3D Building Models from City Area Maps
575

NewOneMap (2018). New OneMap Search API, https:
//docs.onemap.sg/#search. New OneMap Static Map
API, https://docs.onemap.sg/#static-map Contains in-
formation from new OneMap accessed on 13th No-
vember 2018 from new OneMap Static Map API,
which is made available under the terms of the Sin-
gapore Open Data Licence version 1.0: https://www.
onemap.sg/legal/opendatalicence.html.
Shi, B., Bai, X., and Yao, C. (2015). An end-to-end trai-
nable neural network for image-based sequence re-
cognition and its application to scene text recognition.
CoRR, abs/1507.05717.
Simonyan, K. and Zisserman, A. (2014). Very deep con-
volutional networks for large-scale image recognition.
CoRR, abs/1409.1556.
Smith, R. (2007). An overview of the tesseract OCR engine.
In Proceedings of the Ninth International Conference
on Document Analysis and Recognition - Volume 02,
ICDAR ’07, pages 629–633, Washington, DC, USA.
IEEE Computer Society.
Soille, P. (2002). On morphological operators based on rank
filters. Pattern Recognition, 35(2):527 – 535.
Sugihara, K., Murase, T., and Zhou, X. (2015). Automa-
tic generation of 3D building models from building
polygons on digital maps. In 2015 International Con-
ference on 3D Imaging (IC3D), pages 1–9.
Ye, Q. and Doermann, D. (2015). Text detection and re-
cognition in imagery: A survey. IEEE Transacti-
ons on Pattern Analysis and Machine Intelligence,
37(7):1480–1500.
Zhou, X., Yao, C., Wen, H., Wang, Y., Zhou, S., He, W.,
and Liang, J. (2017). EAST: an efficient and accurate
scene text detector. CoRR, abs/1704.03155.
Zhu, Y., Yao, C., and Bai, X. (2016). Scene text detection
and recognition: Recent advances and future trends.
Frontiers of Computer Science, 10(1):19–36.
VISAPP 2019 - 14th International Conference on Computer Vision Theory and Applications
576
