Computer Vision and Deep Learning Tools
for the Automatic Processing of Wasan Documents
Yago Diez
1
, Toya Suzuki
1
, Marius Vila
2
and Katsushi Waki
1
1
Faculty of Science, Yamagata University, Japan
2
Department of Computer Science and Applied Mathematics, University of Girona, Spain
Keywords:
Wasan, Document Processing, Kanji Detection, Kanji Recognition, Deep Learning.
Abstract:
”Wasan” is a type of mathematical texts unique from Japan developed during the Edo period (1603-1867).
These ancient documents present a wealth of knowledge and are of great cultural and historical importance.
In this paper we present a fully automatic algorithm to locate a landmark element within Wasan documents.
Specifically, we use classical computer vision techniques as well as deep learning tools in order to locate
one particular kanji character called the ”ima” kanji. Even though the problem is challenging due to the low
image quality of manually scanned ancient documents and the complexity of handwritten kanji detection and
recognition, our pipeline including noise reduction, orientation correction, candidate kanji region detection and
kanji classification achieves a 93% success rate. Experiments run on a dataset with 373 images are presented.
1 INTRODUCTION
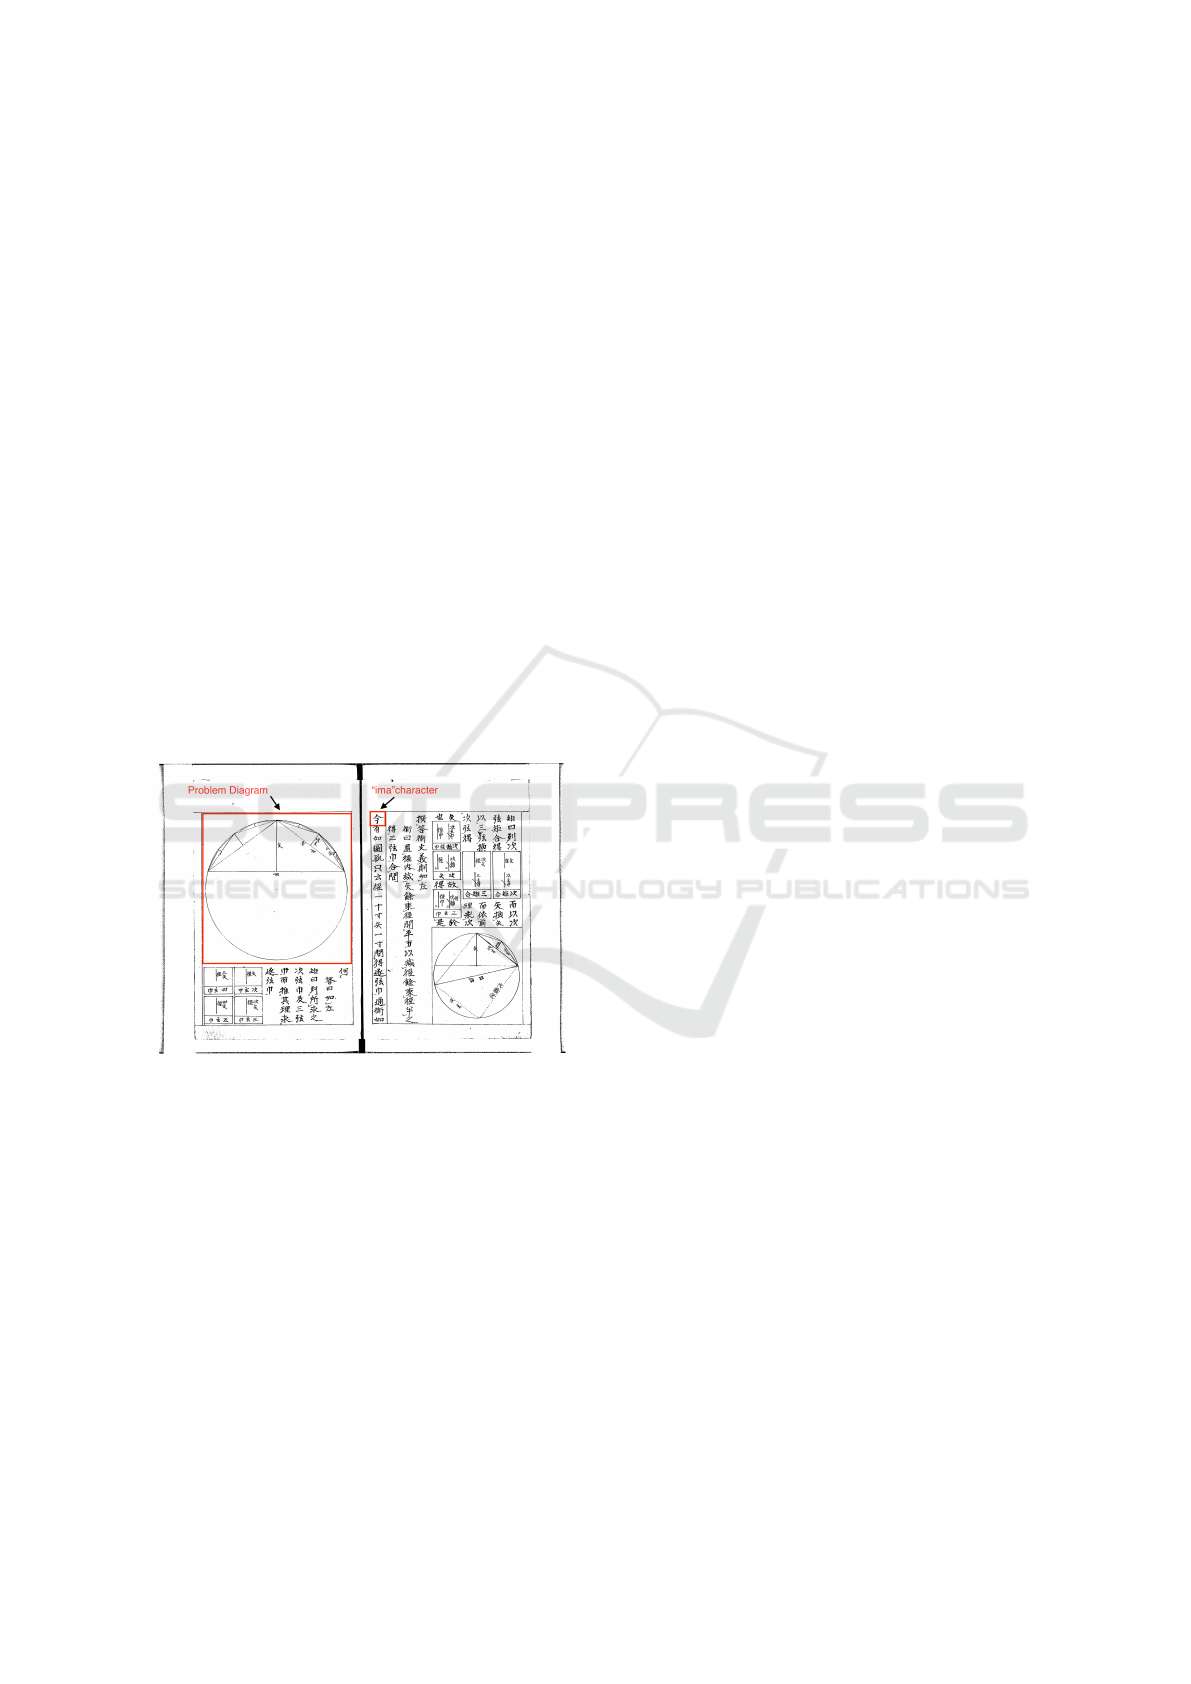
Figure 1: Wasan document example. The ”ima” kanji char-
acter marks the starting point in the description of a new
problem and is typically placed beside the graphical de-
scription of the geometric problem.
”Wasan” is a type of mathematical texts unique to
Japan developed during the Edo period (1603-1867).
Japanese citizens have used Wasan documents to
learn mathematics or as a type or mental training
hobby ever since(Matsuoka, 1996; Martzloff, 1990).
This paper belongs to a line of research aiming
to construct a document database of Wasan. This
database will enable users to search and retrieve prob-
lems based on their geometric properties. This ef-
fort aims at dealing with the problem of the aging
of researchers within the Wasan research area as it
has been estimated that the whole area is in dan-
ger of disappearing within 15 years. By building
an online-available database, searchable with state-
of-the-art tools and built using modern computer vi-
sion and deep learning techniques, we aim at collect-
ing the knowledge of traditional Wasan scholars and
making it available for young researchers and educa-
tors. Specifically, we believe that the possibility of
automatically describing Wasan problems in terms of
their geometrical components will represent a power-
ful new tool of interpretation and description of these
documents. It is our hope that this future electronic
Wasan document data base will help find new insight
on the historical and cultural importance of traditional
Japanese mathematics.
In the current paper, we present the first of a set
of tools that use computer vision and deep learning
techniques for the automatic analysis of Wasan docu-
ments. Wasan problems are mostly geometric in na-
ture. Their description is composed of a diagram ac-
companied by a textual description using handwrit-
ten Japanese characters known as kanji. Figure 1
presents an example of a Wasan document. The start
of the description of a problem is marked by one par-
ticular kanji called ”ima” and representing the ini-
tial part of the sentence: ”Now, as shown,...”. This
”ima” (now) kanji is typically placed beside or un-
derneath the graphical description of the geometri-
cal problem and, thus, represents, a necessary start-
ing point for any algorithm aiming at automatically
processing these documents.
Therefore, in this paper our goal is to automat-
ically determine the position of the ”ima” kanji in
Diez, Y., Suzuki, T., Vila, M. and Waki, K.
Computer Vision and Deep Learning Tools for the Automatic Processing of Wasan Documents.
DOI: 10.5220/0007555607570765
In Proceedings of the 8th International Conference on Pattern Recognition Applications and Methods (ICPRAM 2019), pages 757-765
ISBN: 978-989-758-351-3
Copyright
c
2019 by SCITEPRESS – Science and Technology Publications, Lda. All rights reserved
757

Wasan documents. In order to do this, we use several
classical computer vision techniques (Agrawal and
Doermann, 2013; Marr and Hildreth, 1980; Fernan-
des and Oliveira, 2008) as well as some of the most
recent developments in the Deep Learning branch
of Artificial Intelligence (Krizhevsky et al., 2012).
Specifically we use the following steps:
First we preprocess the documents to alleviate
some of the problems that they present in terms of im-
age quality: On the one hand, we use a Hough line de-
tector to correct possible tilts in orientation introduced
during the process of digitizing the original docu-
ments. On the other hand, we use a noise removal
step to clear small spurious regions of the image and
improve the performance of the subsequent steps of
the pipeline. In the second step of the pipeline the im-
ages resulting from the preprocessing steps are then
used in blob detector algorithms in order to determine
regions that are candidates to containing kanji char-
acters. Each candidate region is transformed into an
image and passed on to the final step. Finally, we run
a Convolutional Neural Network (CNN)-based clas-
sifier in order to classify the single kanji contained in
each of the images resulting from the previous step.
The position of the images classified as containing the
”ima” kanji constitute the final result of our algorithm.
Notice how the techniques used are general-
purpose, so their adaptation to Wasan documents de-
veloped in the current work for the particular prob-
lem of locating the ”ima” kanji will serve as basis for
future applications. The rest of the paper is organ-
ised as follows: Section 2 presents details and ref-
erences of the algorithms used throughout our image-
processing pipeline. Section 3 discusses experimental
results dealing with the kanji detection and classifica-
tion steps. Finally, conclusions and future work are
presented in section 4.
2 MATERIALS AND METHODS
Our Database was composed of images that had
been previously manually scanned from original Edo
period Wasan documents. Our documents were
downloaded from the publicly accessible database in
(YUWasanDB, 2018). This database includes ”The
Sakuma collection ” consisting of the works of the fa-
mous Wasan mathematician ”Aida Yasuaki” and one
of his disciples know as ”Sakuma”. We had access to
images corresponding to 431 books with each book
containing between 15 and 40 pages with problem de-
scriptions. For the purposes of this paper, we manu-
ally chose 373 images that contained the start of the
description of mathematical problems and, thus, the
”ima” character. Both the scanning procedure and the
conservation state of some of the document resulted
in some issues that make the automatic processing of
the images challenging. In the following sections we
will deal with two of these issues: Noise and image
tilt.
2.1 Noise Correction
Noise can be defined as any unwanted information
contained in a digital image. The digital image acqui-
sition process is the primary source of noise. Noise
can produce undesirable effects such as blurred ob-
jects, artifacts, unrealistic edges and unseen lines. It
is almost impossible to totally remove noise without
distorting an image, but it is essential to reduce it in
order to perform image analysis.
Noise reduction in ancient documents is a partic-
ularly challenging issue (Arnia et al., 2015). One of
the main problems that it entails is that it is often not
possible to affect the binarization process of the docu-
ments. This makes it necessary to consider only oper-
ations on what typically are very low quality (in terms
of resolution and information-to-noise ration) binary
images (Agrawal and Doermann, 2013).
In order to reduce the noise present on the images,
we used morphological transformations. Morpholog-
ical transformations are a set of shape-based opera-
tions that process binary images. Morphological op-
erations apply structuring elements or ”kernels” to an
input image and generate an output image. The use of
these operations for noise removal in documents rep-
resents a very active research area (Barna et al., 2018;
Goyal et al., 2018; Tekleyohannes et al., 2018).
The most basic morphological operations are ero-
sion and dilation. They have a wide range of function-
alities, such as removing noise, isolation of individ-
ual elements, joining disparate elements and finding
bumps or holes in an image: The Dilation operation
convolves an image A with a kernel (B). As the kernel
B is scanned over the image, at each position we com-
pute the maximal pixel value overlapped by B and re-
place one image pixel with it. This maximizing opera-
tion causes white regions within an image to grow. In
a typical text document image, the white background
dilates around the black regions of the text. On the
other hand, Erosion computes local minima, causing
the black areas to get bigger.
In this paper we were constrained by the large
quantities of noise but also by the fact that kanji char-
acters that we want to segment often present small
parts that can be easily mistaken with noise. Con-
sequently, we designed the following procedure using
morphological operations:
ICPRAM 2019 - 8th International Conference on Pattern Recognition Applications and Methods
758

First, an erosion operation is applied to the whole
input image obtaining a new image with well-defined
kanji. The goal was to obtain an image where all the
elements belonging to each kanji are interconnected.
Also we obtained much better defined lines. The
erode operation is performed 8 times with a typical
square kernel of 3x3 pixels. Subsequently, an algo-
rithm to remove lines is used. This algorithm con-
sists in convolving the image using a kernel with liner
shape. When all kernel pixels are black, they are con-
verted to white. Then the image obtained is used as
a mask, applying a binary OR operation, to obtain a
new, cleaner image. In the next step, blobs which have
a small enough size, so that they are not confused with
any element of a kanji, are removed. Then, the first
step is applied again to this new image in order to in-
terconnect the elements of each kanji. Similarly to the
fourth step, the blobs which have a size smaller than
an eroded kanji are removed. Finally, and similar to
the third step, the image obtained in the sixth step is
used as a mask to obtain the final resulting image.
2.2 Orientation Correction
The second issue that our data presented was that dur-
ing the process of manually scanning the original doc-
uments, small tilt angles were introduced. This repre-
sented a problem as the structure of Wasan documents
relies on some orientation-dependant characteristics.
Specifically, the position of the diagram explaining
the problem respect to the ”ima” character that we
want to detect is either placed immediately over or
just to the right of the character. Consequently, prop-
erly identifying the vertical and horizontal directions
in the image is an important step towards further au-
tomatic processing of Wasan documents.
Wasan documents often present ”pattern lines”.
These are vertical and/or horizontal lines that helped
the writers maintain a coherent structure and orien-
tation over each of the pages. In our case, these
lines clearly show the tilt angle introduced during the
scanning process as, instead of following the vertical
direction on the scanned image their slope deviates
slightly from it. As the noise removal process also
removed these lines, we started this orientation cor-
rection process from the original images:
Taking into account the peculiarities of Wasan
documents and the quality limitations in our images,
we focused on finding the lines that used to indicate
the vertical direction. Thus, our orientation correc-
tion procedure, can be divided into three main parts 1)
Line detection 2) Line Filtering to remove lines that
have slopes too far from the image vertical 3) Among
the resulting lines, detection of the main lines in the
image by grouping those lines that were close in the
image.
Figure 2 presents an example of the process. In
the first step we detected lines in the image using a
Hough Line transform algorithm. The Hough trans-
form is a well known feature extraction technique
dating as far back as 1962 that is frequently used in
many applications in Computer Vision and related ar-
eas . For this work we explored the two versions of
the Hough transform implemented in the OPENCV
library (Bradski, 2000): Probabilistic and determinis-
tic. The visible ink density of the original documents
resulted in discontinuous lines at pixel level. This
caused the deterministic version of the Hough trans-
form to yield poor results. The probabilistic version
(Matas et al., 1998) , though, was able to find many
lines in our images. These lines, however, did often
not contain information that was useful in terms of
orientation as they were often made up of kanji parts
and were very short. Consequently we filtered these
results to consider only lines over a certain length
threshold. We also filtered out the lines that were too
far away from the image vertical as our goal was to
find the original vertical lines and the tilt angles in
the images were found not to be very large. Once a
small number of lines was left, we observed that many
of the smaller lines were actually part of longer lines
that had some part in the middle that was either faint
or had been totally erased. We grouped those lines by
proximity of their endpoints. All grouped lines were
then converted to a single ”summary line” that aimed
at following the path of the original vertical in the im-
ages.
2.3 Individual Kanji Character
Segmentation Kanji
In this section we describe the part of our pipeline that
segments individual kanji characters.
kanji Characters are made up of a number of
strokes ranging from one to around 20 strokes for the
most common kanji. From the point of view of image
processing, they are small regions made up of even
smaller and disconnected regions. Furthermore hand-
written kanji (such as the ones in Wasan documents)
often present irregular or incomplete shapes.
In order to segment regions that are candidates
to containing kanji (and, specifically, the ”ima” kanji
that we are aiming at segmenting) we will use a com-
puter vision technique known as blob detection. We
tested four different blob detectors, Figure 3 presents
an example of their results.
The first detector used was implemented using the
OPENCV library (Bradski, 2000) while the other 3
Computer Vision and Deep Learning Tools for the Automatic Processing of Wasan Documents
759
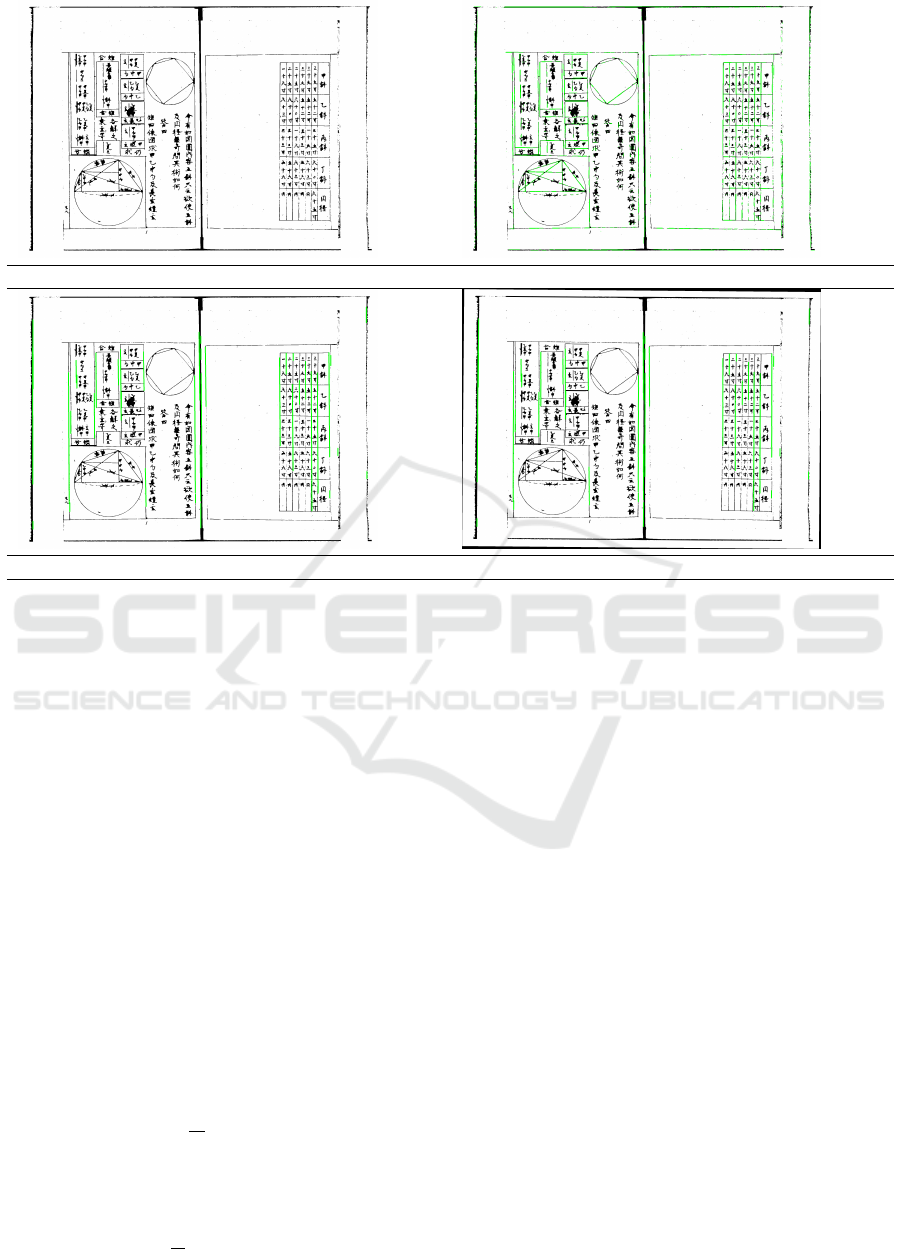
a: Original image b: Lines Detected With Probabilistic Hough Line Transform
c: Filtered Lines d: Corrected image
Figure 2: Orientation Correction.
where implemented using the SciKit library (van der
Walt et al., 2014).
Simple Blob Detector
This algorithm aims at exploiting differences in
pixel intensity by thresholding the source image at
different levels of gray and produce a a number of
binary images. Then connected components are ex-
tracted from every binary image and their centers
of masses are considered. These centers are then
grouped among several binary with the aim of detect-
ing blobs by proximity of the coordinates of the cen-
ters. Finally, blob connected components are merged
into single blobs represented by a center and a radius.
Laplacian of Gausian LoG
The input image is convolved by a Gaussian kernel
with t representing a scale parameter. The Laplacian
of the space of the scales is considered:
∇
2
L = L
xx
+ L
yy
The goal is to highlight dark blobs (indicated by
large positive values) or bright blobs (large negative
values) of radius r =
√
2t (Lindeberg, 2015).
Difference of Gaussians DoG
The Laplacian operator of the scale space can be
approximated by finite differences:
∇
2
norm
L(x, y;t) ≈
t
∆t
(L(x, y;t + ∆t) −L(x, y;t))
This approach is known as the difference of Gaus-
sians (DoG) approach (Marr and Hildreth, 1980).
Determinant of the Hessian DoH
This operator is defined by considering the Hes-
sian matrix of the scale-space representation L. The
determinant of this operator
detH
norm
L = t
2
(L
xx
L
yy
−L
2
xy
)
is then used to detect maxima of this operator.
The blobs in the image are defined from this scale-
space maxima. Blobs defined using this technique
are reported to present better properties under non-
Euclidean affine transformations than the LoG and
Dog operators ((Lindeberg, 2015)).
We also took advantage of the orientation correc-
tion and used the relative position of the blobs de-
tected to merge small blobs that were very close and
could be fit into a bounding box of a maximum given
size along the y axis. This step slightly improved the
results of the blob detector based on pixel intensities
and had a very small effect on the results of the DoG,
LoG and DoH blob detectors.
2.4 Classification of Kanji Images
In the final step of our algorithm we focused on the
classification of the obtained kanji images to automat-
ICPRAM 2019 - 8th International Conference on Pattern Recognition Applications and Methods
760
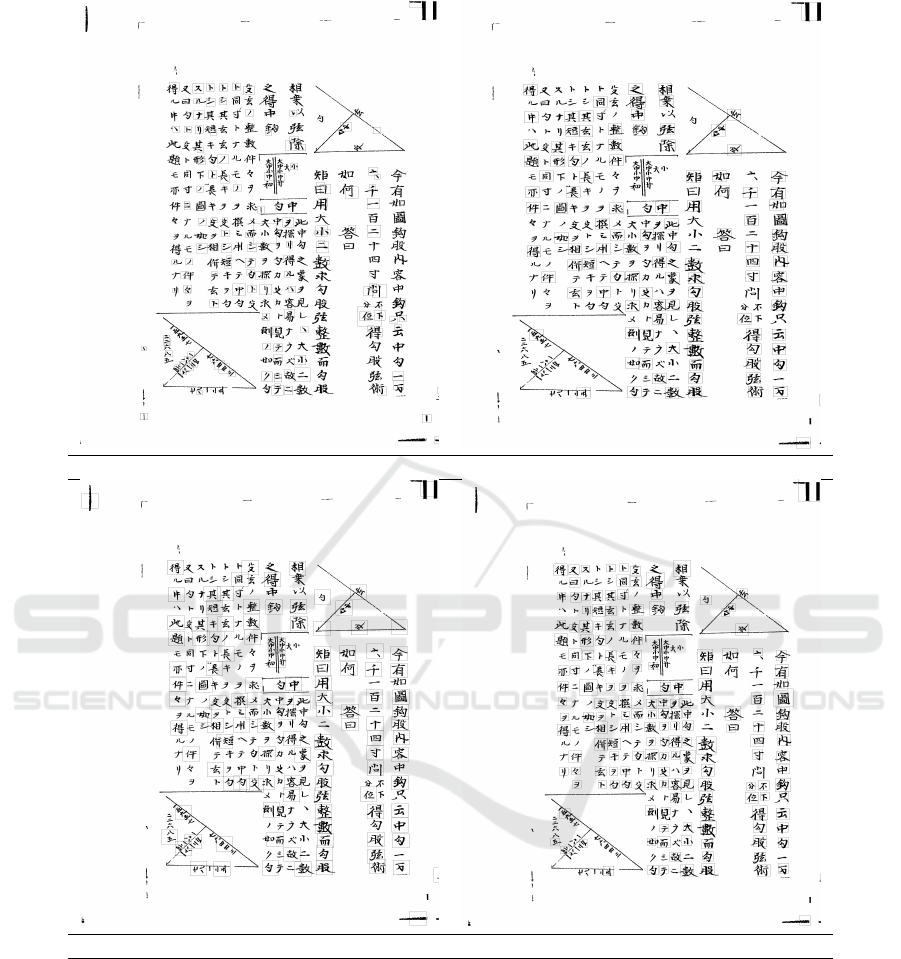
a: Opencv Simple Blob Detector b: Lagrangian Of Gaussians
c: Difference of Gaussians d: Determinant of Hessian
Figure 3: Kanji detector Methods.
ically locate the occurrences of the ”ima” kanji. Im-
age classification has been for some time one of the
areas where artificial intelligence approaches (more
recently in their Deep Learning variants) have ob-
tained best results.
Specifically, classification of kanji characters
(both Chinese and Japanese) is a well established re-
search area producing a large number of commercial
applications as well as research papers. Among the
first, we find, on the one hand the OCR applications
aimed mainly at automatic text recognition (gener-
ally working with printed characters, see, for exam-
ple, (OCRconvert, 2018) ) and on the other software
solutions aimed at students of the Japanese and Chi-
nese languages (using both printed and handwritten
characters, (see, for example (Yomiwa, 2018))).
Concerning the research papers, we will only
mention the methods that mostly resemble the ap-
proach that we have used in this paper. Basically,
we have followed closely the Deep Learning, CNN
Computer Vision and Deep Learning Tools for the Automatic Processing of Wasan Documents
761
approach used in (Tsai, 2016; Simonyan and Zisser-
man, 2014) and also broadly followed in (Gre¸bowiec
and Protasiewicz, 2018) in terms of the architecture.
However, we have also considered data augmentation
following (Cires¸an et al., 2010) and used the publicly
available ETL Database (ETL, 2018) to obtain kanji
image to retrain our deep learning architecture.
Convolutional neural networks (CNN) consists of
layers that transform an input image into a value that
is then used to classify it in one of the existing classes.
In our case, each kanji candidate image is assigned to
one of the existing kanji classes. These layers contain
element-wise operations to introduce non-linearities
and hence increase the capacity of the network to rep-
resent concepts as complex as the shape of a hand-
written character. See (Tsai, 2016) for a descrip-
tion of the different types of layers and their func-
tion. Regarding the shape (architecture) of our net-
work, we followed the ideas described in (Tsai, 2016;
Simonyan and Zisserman, 2014). Convolutional lay-
ers are followed by activation and max-pooling layers.
This is repeated with convolutional layers of increas-
ing size. Finally, a fully-connected layer is used be-
fore computing the final class scores with a softmax
function. Non-linearity is ensured by placing ReLU
layers both after every convolutional layer.
In order to train our network we used images of
handwritten Japanese characters obtained from the
ETL Character Database. Specifically we used the
images corresponding to 876 different kanji charac-
ters contained in file ETL-8. We also explored the
possibility of using Elastic distortions for data aug-
mentation as presented in (Cires¸an et al., 2010). How-
ever, we were not able to improve our classification
results. The most likely explanation is that as our
training dataset already has a large enough number
of images per class (around 80).
3 RESULTS AND DISCUSSION
In this section we will analyze the performance of the
algorithms presented throughout the paper. All tests
were run on a 2.6GHz computer under a linux Ubuntu
environment with an NVIDIA GTX 1080 graphics
board. The computer vision techniques were imple-
mented using the SciKit (van der Walt et al., 2014)
and OpenCV (Bradski, 2000) libraries. The CNN pre-
sented where implemented using Keras and Tensor-
flow.
Regarding the images used in the experiments, all
373 images containing the ”ima” character were used.
In the experiments that required manual checking, a
subset of images was chosen due to the long time
needed for manual checks. Specifically, this involved
25 images per method in for the counting of correctly
detected kanji and false positive kanji in section 3.2
and 100 images per method for the rest of checks in
section 3.2 (detection of ”ima”) and all the checks in
section 3.3. Some of these images contained more
than one ”ima” kanji.
3.1 Running Time Considerations
Our pipeline consisted of four steps, the two ini-
tial steps were common and took, on average: 3.72s
(noise removal) and 7.73s (orientation correction).
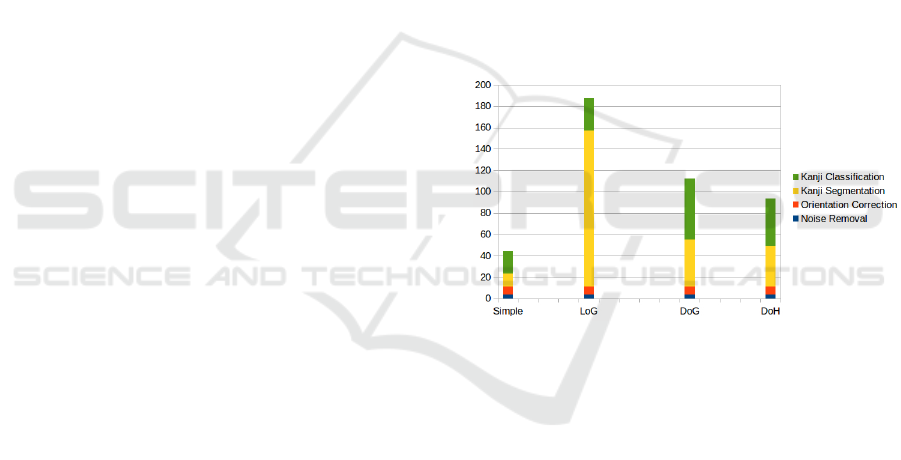
Figure 4 presents these two runtimes as well as the
subsequent kanji detection (for the four methods stud-
ied) and the classification of the resulting candidate
kanji regions with the used CNN. All times are pre-
sented in seconds. Apart from these times, training
the CNN took approximately 190 minutes. This pro-
cess only needs to be performed once and, thus, we
have left it out of the runtime discussion.
Figure 4: Runtimes for the 4 algorithm variants tested.
The simple blob detector was fastest overall, al-
though, as we will see, it did not produce satisfac-
tory results. For the rest of methods, the kanji de-
tection step (using blob detectors) determined the fi-
nal time, with methods producing more detection (in-
cluding false positive ones) taking longer to run both
the detection and classification steps. Overall, even
the slowest pipeline took about 3 minutes to run in
a single image (LoG, detection 145.49s, classifica-
tion 30.70s). This shows that the automatic process-
ing of large quantities of Wasan documents is feasible
although code optimization and multi-process execu-
tion will need to be considered.
3.2 Kanji Detection Experiment
In this first experiment we aimed at determining
which of the blob detectors produced best results for
our problem. We automatically counted the num-
ber of blobs detected and then proceeded to manually
ICPRAM 2019 - 8th International Conference on Pattern Recognition Applications and Methods
762
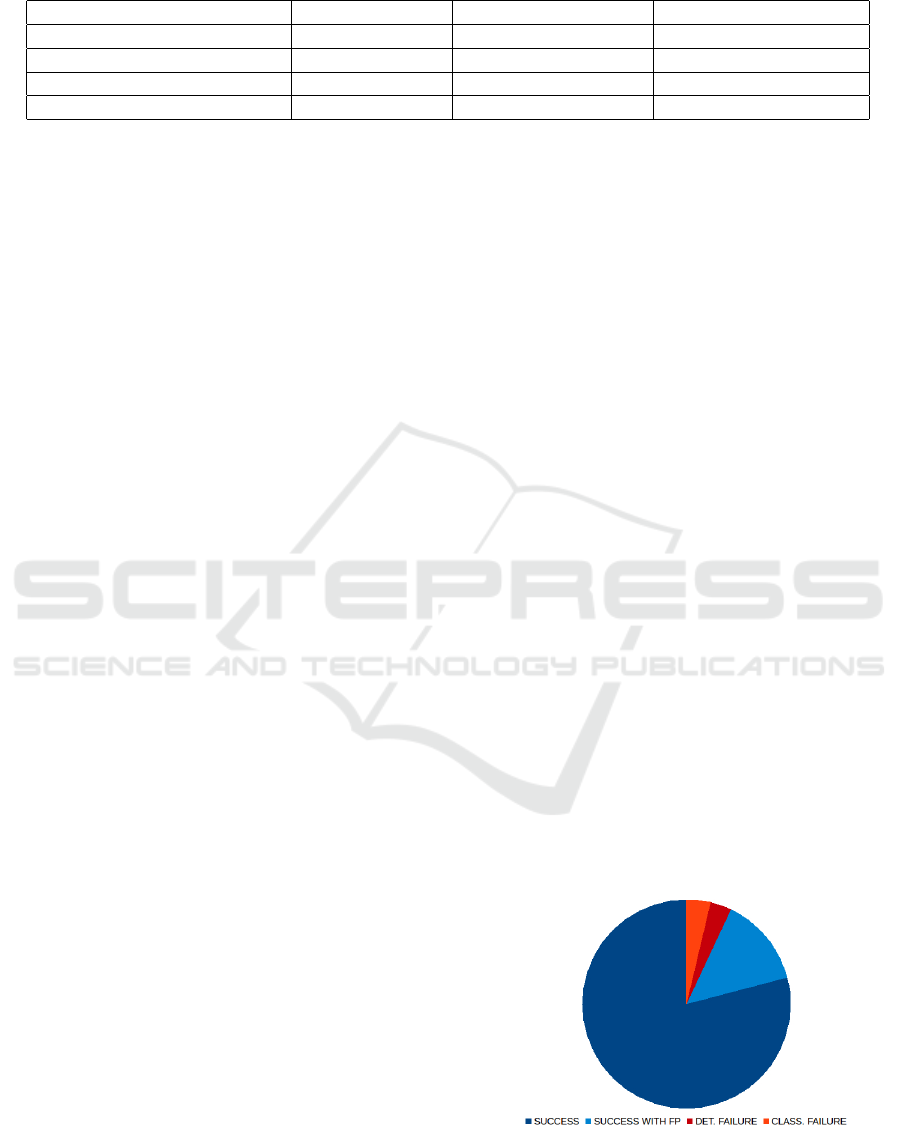
Table 1: Blob detector methods for kanji Segmentation. Summary Table.
Method Name 1 Detected kanji % False Positive kanji % ”ima” kanji detection %
Opencv Simple Blob Detector 63.30 4.43 69.35
LoG 71.57 2.42 96.71
DoG 74.21 3.06 93.54
DoH 86.91 1.50 83.87
count the number of kanji that had not been detected.
We note these ”False negative” (FN), detections. We
also manually counted what of the detected blobs did
not contain any kanji and noted them ”False positive”
(FP), detections. Using these values we were able to
determine the actual number of kanji present in each
page. Then we were able to compute the percentage
of kanji detected in every page (over the total num-
ber of kanij). The average over the test set for this
correct detection percentage is presented in Table 1
second column. The ratio of FN detections over the
total number of kanji is presented in column three.
Finally, the average percentage of occurrence of the
”ima” kanji correctly detected is presented in column
four. A typical page had around 200 kanij characters
with only one occurrence of the ima kanji although
in a small number of cases the ”ima” kanji appeared
twice in the same page.
The table shows how the best performance in
terms of the detection of the ”ima” kanji was obtained
by the LoG blob detector. It’s failure rate of 3.29%
ranked higher above all method and illustrates the ad-
equacy of scale space blob detectors for our very spe-
cific problem. As this was the main goal of the current
paper, this is the method that we will use in our full-
pipeline experiment in section 3.3.
To complement the analysis, we observe that in
terms of the detection of all the kanji in a page, the
DoG and, specially, the DoH methods performed bet-
ter than the LoG blob detector. however, specially for
the DoH method, this higher capacity to detect kanji
regions (expressed both in higher percentage of de-
tected kanji and lower FP kanji detection) did not re-
sult in a better rate of location of the ”ima” kanji. This
was slightly surprising to us as in the data analyzed
the DoH method seemed to perform best over all but
had a tendency to ”miss” the one kanji that mattered in
our application. This is likely explained by the shape
of the ”ima” kanji, which is small and made up of four
or five (depending on the writer) small connected re-
gions. Visual inspection of the results seemed to indi-
cated that the DoH method was very good at detecting
kanji regions but had some trouble with smaller kanji,
specially if they were not totally surrounded by other
kanji as is often the case with ”ima”.
This differences in behaviour of the different blob
detector method indicate the possibility that combin-
ing their outputs might result in future work in im-
proved results for ”ima” recognition as well as the
development of an automatic tool for the automatic
extraction of the full text of the description of Wasan
problems.
3.3 Classification of the ”ima” Kanji
After considering the LoG blob detector as the best
suited to locate the ”ima” kanji, in this section we an-
alyze the results of running its output through the last
step of our pipeline.
Specifically, the CNN described in section 2.4 was
asked to classify every candidate kanji region in one
of the 876 kanji classes that we had trained it with.
During the trainig of the CNN the system achieved
a 99.12% accuracy that is in line with previous kanji
recognition applications (Tsai, 2016; Cires¸an et al.,
2010; Gre¸bowiec and Protasiewicz, 2018).
Figure 5 shows the percentage of: 1) Success,
defined as the percentage of correct ”ima” kanji de-
tection without wrongly detection any other kanji as
”ima” at the same time. 2) Success with FP, the per-
centage of detections that happened along with the
misclassified of some other kanji as ”ima”. 3) De-
tection Failure: The percentage of failed location of
the ”ima” kanji because it was not inside a kanji can-
didate region and 4) Classification Failure: The per-
centage of cases in which a properly detected occur-
rence of the ”ima” kanji was classified as some other
kanij class.
Figure 5: Summary of results.
The results show how the high success of the de-
tection of the ”ima” kanji (93.02% total success rate
Computer Vision and Deep Learning Tools for the Automatic Processing of Wasan Documents
763

including success with FP) makes our method suitable
to achieve our goals in this paper. There is, however,
still room for improvement. Specifically, the 13.95%
FP rate might result in extended human review time
over the results to filter the wrong classification. The
most likely explanation for these classification errors
is that the CNN that we used had not been trained
to include all possible kanji variants. We checked that
the kanji most often confused with ”ima” did not have
its own class properly defined. Consequently, extend-
ing our kanji image library will likely result in a re-
duced false positive misclassification rate. The failure
rate of 6.97% is acceptable in the context of our ap-
plication and can be attributed in almost equal parts to
failure in classification and detection. Regarding the
failure due to the misclassificatio of a correctly de-
tected ”ima” kanji, a possible issue is that the ground
truth present in the ETL database (ETL, 2018) cor-
responds to modern writing of the kanji which differ
slightly from some of the ways in which they were
written in the Edo period.
4 CONCLUSIONS AND FUTURE
WORK
We have presented what is, to the best of our knowl-
edge the first work using computer vision tools and
deep learning for the analysis of Wasan documents.
We have presented a tool to select an important struc-
tural element, the ”ima” character that indicates the
position of the start of the textual problem and lies
beside or underneath the graphical description of the
problem. The application presented in this paper rep-
resents, thus, the first step in the construction of a
data base of Wasan documents that can be search-
able in terms of the geometric properties of each prob-
lem. The results presented in this work illustrate how
our algorithms are able to overcome the image quality
problems present in the images (mainly noise in data,
low resolution and orientation tilt) and locate the oc-
currences of the ”ima” character with a high success
rate of 93.02%. Among the issues that remain is the
presence of a 13.95% of false positive detections and
the 6.97% of cases in which the detection failed.
Both issues will be addressed in future work.
In order to reduce False positives, we will widen
our Kanji database so that it includes more than the
present 876 kanji classes. Regarding the cases in what
the algorithm failed, roughly half where due to detec-
tion failure and the other half to classification failure.
The first issue will be addressed by combining the re-
sults of the three blob detectors obtaining best results
in Experiment1 (LoG,DoG,DoH). while the second
can be addressed by tailoring the ground truth for the
”ima” kanji so it is closer to the writing peculiarities
of the EDO period. The experiments included in this
paper also indicate that modifying the code used to
produce the experiments presented to obtain the full
text of the description of each Wasan problems is fea-
sible with minor modifications of the current code.
REFERENCES
Agrawal, M. and Doermann, D. (2013). Clutter noise re-
moval in binary document images. IJDAR, 16(4):351–
369.
Arnia, F., Fardian, Muchallil, S., and Munadi, K. (2015).
Noise characterization in ancient document images
based on DCT coefficient distribution. In ICDAR
2015, pages 971–975.
Barna, N. H., Erana, T. I., Ahmed, S., and Heickal, H.
(2018). Segmentation of heterogeneous documents
into homogeneous components using morphological
operations. In 17th IEEE/ACIS 2018, Singapore, Sin-
gapore, June 6-8, 2018, pages 513–518.
Bradski, G. (2000). The OpenCV Library. Dr. Dobb’s Jour-
nal of Software Tools.
Cires¸an, D. C., Meier, U., Gambardella, L. M., and Schmid-
huber, J. (2010). Deep, big, simple neural nets for
handwritten digit recognition. Neural Computation,
22(12):3207–3220. PMID: 20858131.
ETL (2018). Etl character database. http://etlcdb.db.
aist.go.jp/. Accessed: 2018-11-20.
Fernandes, L. A. and Oliveira, M. M. (2008). Real-time
line detection through an improved hough transform
voting scheme. Pattern Recognition, 41(1):299 – 314.
Goyal, B., Dogra, A., Agrawal, S., and Sohi, B. S. (2018).
Two-dimensional gray scale image denoising via mor-
phological operations in NSST domain & bitonic fil-
tering. Future Generation Comp. Syst., 82:158–175.
Gre¸bowiec, M. and Protasiewicz, J. (2018). A neural frame-
work for online recognition of handwritten kanji char-
acters. In 2018 FedCSIS, pages 479–483.
Krizhevsky, A., Sutskever, I., and Hinton, G. E. (2012). Im-
agenet classification with deep convolutional neural
networks. In Proceedings of the 25th International
Conference on Neural Information Processing Sys-
tems - Volume 1, NIPS’12, pages 1097–1105, USA.
Curran Associates Inc.
Lindeberg, T. (2015). Image matching using generalized
scale-space interest points. Journal of Mathematical
Imaging and Vision, 52(1):3–36.
Marr, D. and Hildreth, E. (1980). Theory of Edge Detec-
tion. Proceedings of the Royal Society of London Se-
ries B, 207:187–217.
Martzloff, J.-C. (1990). A survey of japanese publica-
tions on the history of japanese traditional mathemat-
ics (wasan) from the last 30 years. Historia Mathe-
matica, 17(4):366 – 373.
ICPRAM 2019 - 8th International Conference on Pattern Recognition Applications and Methods
764

Matas, J., Galambos, C., and Kittler, J. (1998). Progressive
probabilistic hough transform.
Matsuoka, M. (1996). Wasan, and its cultural background.
In Ogawa, T., Miura, K., Masunari, T., and Nagy, D.,
editors, Katachi
S
Symmetry, pages 341–345, Tokyo.
Springer Japan.
OCRconvert (2018). Japanese ocr (optical character
recognition). https://www.ocrconvert.com/japanese-
ocr. Accessed: 2018-11-20.
Simonyan, K. and Zisserman, A. (2014). Very deep con-
volutional networks for large-scale image recognition.
CoRR, abs/1409.1556.
Tekleyohannes, M. K., Weis, C., Wehn, N., Klein, M.,
and Siegrist, M. (2018). A reconfigurable accelerator
for morphological operations. In 2018 IEEE IPDPS
Workshops 2018, Vancouver, BC, Canada, May 21-25,
2018, pages 186–193.
Tsai, C. (2016). Recognizing handwritten japanese charac-
ters using deep convolutional neural networks.
van der Walt, S., Sch
¨
onberger, J. L., Nunez-Iglesias, J.,
Boulogne, F., Warner, J. D., Yager, N., Gouillart, E.,
Yu, T., et al. (2014). scikit-image: image processing
in Python. PeerJ, 2:e453.
Yomiwa (2018). Real-time offline camera translator for
japanese. http://www.yomiwa.net/. Accessed: 2018-
11-20.
YUWasanDB (2018). Yamagata university wasan sakuma
collection (japanese). http://www2.lib.yamagata-
u.ac.jp/mainlib/rarebooks/sakuma-index.html . Ac-
cessed: 2018-11-20.
Computer Vision and Deep Learning Tools for the Automatic Processing of Wasan Documents
765
