
Cost-constrained Drone Presence Detection through Smart Sound
Processing
Joaqu
´
ın Garc
´
ıa-G
´
omez, Marta Bautista-Dur
´
an, Roberto Gil-Pita, Inma Moh
´
ıno-Herranz,
Miguel Aguilar-Ortega and C
´
esar Clares-Crespo
Department of Signal Theory and Communications, University of Alcal
´
a, Alcal
´
a de Henares 28805, Spain
Keywords:
Drone Detection, Smart Sound Processing, Feature Extraction, Feature Selection, Evolutionary Computation,
Cost Constraints.
Abstract:
Sometimes, drones lead to problems of invasion of privacy or access to restricted areas. Because of that, it is
important to develop a system capable of detecting the presence of these vehicles in real time in environments
where they could be used for malicious purposes. However, the computational cost associated to that system
must be limited if it has to work in an autonomous way. In this manuscript an algorithm based on Smart Sound
Processing techniques has been developed. Feature extraction, cost constrained feature selection and detection
processes, typically implemented in pattern recognition systems, are applied. Results show that it is possible
to detect the presence of drones with low cost feature subsets, where MFCCs and pitch are the most relevant
ones.
1 INTRODUCTION
The use of Unmanned Aerial Vehicles, also known
as drones, is on the rise in the society, mainly be-
cause of the advantages they offer. However, these
vehicles usually run into problems of invasion of pri-
vacy or access to hazardous areas (e.g. airports). For
this reason it is important to develop a system ca-
pable of detecting the presence of drones in partic-
ular environments where they could be used for mali-
cious purposes, such as households, public buildings
or restricted-access areas. In the state of the art there
are many studies which deal with this issue, trying to
detect and locate drones (Ganti and Kim, 2016). The
wide range of methods includes audio, video, temper-
ature, radar and radio frequency based detection.
Video detection systems can cover long distances,
but there is a difficulty when distinguishing between
drones and birds, even after including bird flight pat-
terns which drones do not follow (Ganti and Kim,
2016). In addition, the computational cost of this kind
of systems is high. Talking about the temperature-
based detection, it is an efficient solution if the drone
uses a propulsion engine, which usually appears in
fixed-wing drones. However, most current drones are
made of plastic and their electric engines do not radi-
ate much heat.
Systems based on radar signal are useful for air-
craft detection, but the small size of the drones com-
plicates their detection. Some manuscripts are work-
ing on this alternative (Drozdowicz et al., 2016). Re-
lated to radio frequency based methods, they are use-
ful for the problem at hand since radio frequency is
the communication mode used between drones and
the remote controller (Nguyen et al., 2016). How-
ever, the use of Wi-Fi range (2.4-5 GHz) in no-license
channels causes the appearance of high interferences.
Some proposals have based their study on audio
information, mixed or not with video one. Some au-
thors propose the use of an array of microphones and
an infrared camera to get the information (Case et al.,
2008). They try to trace the path followed by the
drone through beamforming techniques. Others use
only one microphone, but they are focusing on detect-
ing a particular model of drone, so the results could
not be generalizable (King and Faruque, 2016). In one
manuscript, the authors analyze video information to
detect the difference between frames, and in this way
they track the drone movement, while they use audio
information for detecting the vehicle with a threshold
in frequency (Ganti and Kim, 2016). The problem is
that it is not very effective when background noise is
high. In addition, audio appears to be more reliable
for detecting drones according to some studies (Liu
et al., 2017).
This manuscript proposes a real-time implemen-
766
García-Gómez, J., Bautista-Durán, M., Gil-Pita, R., Mohíno-Herranz, I., Aguilar-Ortega, M. and Clares-Crespo, C.
Cost-constrained Drone Presence Detection through Smart Sound Processing.
DOI: 10.5220/0007556007660772
In Proceedings of the 8th International Conference on Pattern Recognition Applications and Methods (ICPRAM 2019), pages 766-772
ISBN: 978-989-758-351-3
Copyright
c
2019 by SCITEPRESS – Science and Technology Publications, Lda. All rights reserved
tation of an energy-efficient system capable of detect-
ing drone presence in smart environments. We want
the system to work in an autonomous way, so com-
putational cost related to the clock frequency of the
processing units will be strictly constrained. In this
sense, evolutionary computation (i.e. genetic algo-
rithms) is proposed for selecting a reduced set of fea-
tures from the full set calculated previously, allowing
a good tradeoff between performance and computa-
tional cost.
2 SMART SOUND PROCESSING
(SSP) SYSTEM
In order to detect drone presence, our study will be
based on an efficient system successfully used in other
applications, like violence detection (Bautista-Dur
´
an
et al., 2017). This is because this set includes fea-
tures like pitch, which can be useful for detecting the
frequency associated to the drone engine, as well as
the rotation speed, size and material of the propellers.
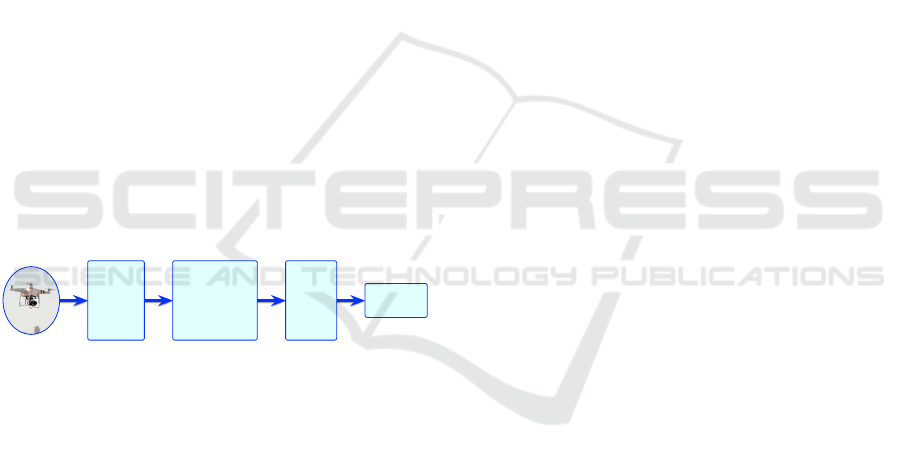
The system has the objective of studying solutions for
audio-based drone detection in real environments and
in real time, where the system has to make a decision
every T seconds. Fig. 1 shows the system diagram,
whose steps will be explained in the following sec-
tions.
Feature
Extraction
Feature
Selection
with
COST
CONSTRAINTS
Detector
BINARY
DECISION
Figure 1: Scheme of the system.
2.1 Feature Extraction
The objective of this step is to extract useful infor-
mation from the audio signal in the form of features.
There are several audio features that have demon-
strated to be really useful in other applications, funda-
mentally related to speech problems (Giannakopoulos
et al., 2006; Mohino et al., 2011; Gil-Pita et al., 2015).
In this manuscript we will apply this type of features
to the problem of drone detection. In this section a
theoretical description of the features will be made.
To extract the features, the audio segments of T sec-
onds are divided into M frames of L samples with an
overlap of S%. The following features have been con-
sidered:
• The Mel-Frequency Cepstral Coefficients
(MFCCs). They are N parameters calculated
from the spectrum that are typically used for
speech recognition. With this measurement, a
compact representation of the spectral envelope is
obtained. The objective is to emulate the human
ear non-linear frequency response through a set
of filters on non-linearly spaced frequency bands
(Gil-Pita et al., 2015).
• The Delta Mel-Frequency Cepstral Coefficients
(∆MFCCs). They are calculated differentiating
the previous MFCCs in two different time frames.
• The Pitch. This feature is related to the funda-
mental frequency and determines the tone of the
speech. It allows to distinguish a person from an-
other. In this manuscript the pitch is evaluated in
every frame through the autocorrelation of the er-
ror of a linear predictor with P coefficients (Mo-
hino et al., 2011).
• The Harmonic Noise Rate (HNR). With this fea-
ture it is feasible to evaluate the purity of the
speech. It measures the relation between the har-
monic energy produced by the vocal cords and the
non-harmonic energy.
• The Ratio of Unvoiced time Frames (RUF). It
measures the presence or absence of clear or
strong speech. The computation consists of divid-
ing the number of time frames with detected pitch
by the total number of frames.
• The Short Time Energy (STE), which is the en-
ergy of the short speech segment. It is a simple
and effective parameter for both voiced and un-
voiced frames (Jalil et al., 2013).
• The Energy Entropy (EE). It allows to detect
changes in the energy level of the audio. It is use-
ful for detecting a quick emergence of a drone in
the environment due to rapid changes in the en-
ergy of the audio. To evaluate this measurement,
each time frame is divided into B blocks, and the
energy of each block is then measured.
• The Zero Crossing Rate (ZCR). It is one of the
most used audio features in time domain. To cal-
culate it, the number of sign changes is divided by
the total length of the frame.
• The Spectral Rolloff (SR). It is calculated in the
frequency domain and is defined as the frequency
below which c% of the magnitude distribution
of Short Time Fourier Transform (STFT) coeffi-
cients are concentrated for a frame.
• The Spectral Centroid (SC) is the center of gravity
of the magnitude spectrum of the STFT.
• The Spectral Flux (SF) measures the spectral
changes between successive frames.
Cost-constrained Drone Presence Detection through Smart Sound Processing
767

Once these features have been extracted, some statis-
tics are applied to them (the mean and the standard
deviation).
2.2 Feature Selection with Cost
Constraints
If we want to get an energy-efficient real time sys-
tem for detecting drone presence, it will have the re-
striction of consumption, as it will be implemented in
some place to work in an autonomous way. In this
scenario, computational cost is an important aspect
to consider. In order to calculate the computational
cost of our system, we have computed the resources
that each feature requires determining the number
of Floating Point Operations Per Second (FLOPS)
(Qian, 2015), which is directly related to the power
consumption of the device. The number of FLOPS of
the system will depend on the set of selected features,
so it must be taken into account which ones are used
in each case (Bautista-Dur
´
an et al., 2017).
Thus, the cost of each feature has been evaluated
and some equations are proposed with the objective
of generalizing the cost according to some parameters
that will be explained. As stated above, the feature
extraction process splits the audio frame of N
samples
(so that T = N
samples
/ f
s
, being f
s
the sampling fre-
quency) into M frames of L samples, with an overlap
between them of S%, so that:
M =
N
samples
S · L
(1)
Some aspects must be taken into account for the anal-
ysis. First of all, some features will have more impact
in cost than others (e.g. MFCCs or pitch-based ones).
In addition, some features need to apply the same pro-
cessing blocks, so their computation do not have to
be repeated. Considering the measurements of Sec-
tion 2.1, four processing blocks that are shared along
more than one measurement have been identified:
• The STFT is shared by the MFCCs, the ∆MFCCs,
the SR, the SC and the SF.
• The MFCCs are shared by the MFCCs and the
∆MFCCs.
• The pitch is shared by the HNR and the RUF.
• The energy is shared by the STE and the EE.
In Table 1 the four processing blocks and their
equations are shown. Four binary variables b
1
, b
2
, b
3
and b
4
related to B
1
, B
2
, B
3
and B
4
(the number of op-
erations associated to the previous processing blocks)
will be defined to determine if the set of features se-
lected requires or not the evaluation of these blocks.
Thus, the total cost C will be calculated using Equa-
tion (2).
C =
4
∑
i=1
b
i
· B
i
+
11
∑
j=1
s
j
·C
j
, (2)
where C
j
is the additional cost of each feature and
s
j
is a binary value which indicates if the feature is
selected or not. Taking into account that the proposed
system makes a decision every T seconds, the FLOPS
can be evaluated.
As there are some features which are linked and
depend on others, we have grouped the measurements
into 8 groups: G
1
(including MFCCs and ∆MFCCs),
G
2
(including Pitch, HNR, and RUF), G
3
(STE), G
4
(EE), G
5
(ZCR), G
6
(SR), G
7
(SC) and G
8
(SF). The
groups, number of features of each measurement, val-
ues of b
S
, b
M
, b
P
and b
E
, and the equations of addi-
tional cost C
f
associated to each measurement are de-
tailed in Table 2. There we can see a typical cost of
the problem at hand, considering each feature is se-
lected individually, so the shared blocks need to be
computed in each of them. The parameters used for
solving the equations are: B = 10 blocks, L = 512
samples, M = 31 frames, N = 25 MFCCs coefficients,
P = 10 Levinson coefficients and S = 50% overlap.
As it has been discussed, it is necessary to find a
reduced set from the 117 features that allows obtain-
ing a good performance and controlling the compu-
tational cost of the system. For this purpose, evo-
lutionary algorithms have been implemented in the
manuscript (Haupt et al., 1998). The configuration
of this algorithm includes the next parameters: 100
individuals, 10 parents, 90 regenerated sons, percent-
age of mutation of 2%, 30 generations, 10 repetitions
of the whole algorithm and minimization of the error
rate as adaptive function.
2.3 Detectors
To evaluate the results and make a decision about the
presence of drone sound, a detector has to be applied.
In the present case, two different detectors have been
used: the Least Squares Linear Discriminant (LSLD)
and a reduced version of the Least Squares Quadratic
Discriminant (LSQD). The computation of the two
detectors is shown in Equations 3 and 4. (Garc
´
ıa-
G
´
omez et al., 2016). They are obtained using the
Wiener-Hopf equations. (Van Trees, 2004)
y = w
0
+
L
∑
n=1
w
n
x
n
, (3)
y = w
0
+
L
∑
n=1
w
n
x
n
L
∑
n=1
n
∑
m=1
x
m
x
n
v
mn
, (4)
ICPRAM 2019 - 8th International Conference on Pattern Recognition Applications and Methods
768

Table 1: Cost of the shared processing blocks.
Block Cost of the block (No. operations)
STFT B
1
= L(M − 1)(5log
2
L + 2) + 4L + 15
MFCCs B
2
= (L · S + 1)(M(2N + 5) + 10N + 23) + N(3N + 11) + N · M(2N + 7) + 29
Pitch B
3
= 2L · M(5log
2
L + P + 3) + M
P(2P
2
+ P + 2L + 1) − L
+ 1
Energy B
4
= M(2L + 3) − 4
Table 2: Details of the groups of features.
Group Caract No. feats b
1
b
2
b
3
b
4
Additional cost (No. operations) Typical cost (MFLOPS)
G
1
MFCCs 50 1 1 0 0 C
1
= 0 1.25
∆MFCCs 50 1 1 0 0 C
2
= N(M − 2) + 1 1.26
G
2
Pitch 2 0 0 1 0 C
3
= 0 2.21
HNR 2 0 0 1 0 C
4
= 9M 2.21
RUF 1 0 0 1 0 C
5
= M 2.21
G
3
STE 2 0 0 0 1 C
6
= 0 0.03
G
4
EE 2 0 0 0 1 C
7
= M (b2L/Bc + 3B −5) + 6B + 3 0.06
G
5
ZCR 2 0 0 0 0 C
8
= (6M + 1)(L −1) 0.10
G
6
SR 2 1 0 0 0 C
9
= M(5N + 8) + 2bM(L · S − 1)/3c 0.74
G
7
SC 2 1 0 0 0 C
10
= M (8N + L · S + 6) +L · S + 4 0.75
G
8
SF 2 1 0 0 0 C
11
= M (9N + 5) − 3N + 1 0.74
where x
n
and x
m
are the training patterns, w
n
and v
mn
are the weights associated to them, w
0
is a bias term
and y is the combination of the training patterns. A
threshold will be applied to this combination to obtain
the binary decision about drone presence.
It is important to indicate that in the beginning
more complex detectors were considered (e.g. arti-
ficial neural networks). However they were discarded
because the results were not as good as expected, due
to the fact that overtraining problems appear as the
dataset is not large enough.
3 RESULTS
To validate the system we have carried out some ex-
periments using a dataset of audio files. These audio
files have been divided in segments of T = 1 second,
which indicates how often a decision is made. All the
files have been resampled to a sampling frequency of
f
s
= 8,000 Hz. Each frame is divided in windows of
L = 512 length and S = 50% overlap between win-
dows, resulting in a total of M = 31 frames per seg-
ment. Then steps detailed in previous sections have
been followed, including feature extraction, feature
selection and detection.
The algorithm has been applied using a constraint
related to the computational cost. Some cost thresh-
olds measured in “Maximum number of Mega Float-
ing Operations Per Second” (MaxMFLOPS) have
been applied (0.5, 1, 1.5, 2, 2.5, 3, 3.5 and 4 MaxM-
FLOPS). This means that the sum of costs of the se-
lected features has to be below these values. The up-
per limit is never reached, since the cost associated to
the case of selecting all the features is below 4 MaxM-
FLOPS. Once the best features have been selected, a
trained detector makes the final decision.
The datasets used in the state of the art are not
suitable for our problem for several reasons: they just
include a model of drone, or the environmental con-
ditions do not change. Because of that, we have used
a novel dataset that was developed in a previous work
(Garc
´
ıa-Gomez et al., 2017). In this dataset, drones
in motion and in a static position are included, as
well as different models of them (Cheerson CX10,
DJI Phantom 3, Eachine Racer 250, etc.). In order to
make the database more challenging, similar no-drone
sounds are included too (plane, helicopter, mower,
etc.). The main characteristics of the used database
are: total duration of 3671 seconds, duration of drone
sound of 1913 seconds, percentage of drone presence
of 50.08%, 36 fragments, minimum audio length of
6 seconds and maximum audio length of 316 sec-
onds. More details about the dataset can be found in
(Garc
´
ıa-Gomez et al., 2017).
The method of validation implemented has been
a tailored version of k-fold cross-validation, since it
allows avoiding loss of generalization of the results.
The data is divided in k subsets, so that each subset is
used for testing and the remaining k − 1 are used for
training. In the case at hand, 36 folds with different
size have been used, each fold containing a different
audio file. In that way, we ensure that data from the
same model of drone or with the same environmental
conditions are not used both for training and testing at
the same time.
Cost-constrained Drone Presence Detection through Smart Sound Processing
769

3.1 Analysis of the Computational Cost
Constraints
Now we will evaluate the effect of the limits in the
computational cost available, as well as the groups of
features more selected and useful. Table 3 displays
the error rate and the percentages of appearance (se-
lection rates) of the groups, in function of the maxi-
mum cost established in MFLOPS, using the LSLD.
The error rate is the sum of the decisions where the
system says there is drone presence and it fails be-
cause there is no drone in the environment, and vice
versa. It has been considered as appearance the se-
lection of one or more features from the group. The
same is displayed in Table 4 using LSQD.
At the beginning, the system selects groups G
3
,
G
4
and G
5
in almost 100% of the cases because of
the low threshold imposed (0.5 MaxMFLOPS). When
we increase this value to 1 MaxMFLOPS, the spectral
features appear. If the restriction is established in 1.5
MaxMFLOPS, the MFCCs start to be selected. When
we reach higher values of MFLOPS (3.5), group G
2
is selected, which is composed of features related to
the pitch. The case of 4.0 MaxMFLOPS allows the
algorithm to select whatever it needs, because the sum
of all the costs is lower than this value.
In general LSQD works better than LSLD, since
the error rate is lower in most cases, specially when
the cost constraint is very limiting. The importance
of some features is reflected in the table. For in-
stance, when group G
1
-MFCCs and ∆MFCCs- ap-
pears (from 1.5 MaxMFLOPS onwards) its appear-
ance is 100%. In fact, the parameter that best reflects
the importance of G
1
is the error rate, since it falls
significantly when that group appears (in the case of
LSLD, from 57.5% of error to 28.5%, and in the case
of LSQD, from 41.9% to 23.4%). Something simi-
lar happens when G
2
-pitch, HNR and RUF- appears
(from 3.5 MaxMFLOPS onwards). Again, its selec-
tion rate is 100% and its contribution to the perfor-
mance of the system is really significant (error falls
from 30.1% to 15.7% with LSLD and from 23.8% to
15.5% with LSQD). The importance of pitch could be
directly related to the particular frequency that drones
present, which is dependent on the size of the device,
the number of blades and the speed.
With regard to the rest of features, G
3
seems to
work well only when using LSLD because of its high
selection rate. The same applies to G
8
, but when us-
ing LSQD. Other features seem to be more robust to
changes in the detector used (G
5
, G
6
and G
7
), since
they present high selection rate for both detectors.
3.2 Analysis of the Model of Drone and
Other No-drone Sounds
Then, the error obtained in each of the models in-
cluded in the drone database will be analyzed. Table
5 shows the different models of drone, the duration of
each of them and the error obtained. In these results
the best constraint and detector in terms of error have
been selected from the previous cases (13.4% of error
with 4.0 MFLOPS and LSLD).
From Table 5 it can be seen that Parrot AR is
the best detected model (0% of error rate), while the
worst one is the UDI 817 (50% of error). This could
be because of its minor presence in the database. As
it can be observed, a large proportion of the database
belongs to DJI Phantom 3, which gets an error rate of
12.2%.
As mentioned previously, the dataset was devel-
oped including no-drone sounds present in smart city
environments, which can be easily confused with the
sound of a drone. In Table 6 the no-drone sounds, the
duration of them and the error obtained are detailed.
From the results it can be observed that the most
confusing sounds are the fire siren, radial saw and
construction work (with error rates of 40.7%, 36.4%
and 22.5%, respectively). This could be because the
fundamental frequency of these sounds is in the range
of the drone frequency (one or two hundreds of Hz).
Likewise, other sounds like helicopter, excavator, mo-
torbike or plane are really well detected as no-drone
sounds, with error rates below 3%. This is especially
interesting in the case of other aerial vehicles (heli-
copter, plane), since they could be more conflicting
with drones as they share the same space of work (the
sky) and they could appear at the same time.
4 CONCLUSIONS
The aim of this work is to develop a system capa-
ble of detecting the presence of drones in real time.
To this end, different experiments related to Smart
Sound Processing (SSP) have been carried out, in-
cluding feature extraction, feature selection and de-
tectors. The objective of the algorithms is to minimize
the error rate while controlling the computational
cost. This has been reached through a constraint in
the number of operations per second (MFLOPS).
Related to the features selected, the results show
that MFCCs and features related to pitch are the best
subsets of features for the problem at hand, for both
linear and quadratic detectors. Depending on the de-
sired final error rate and on the resources of the pro-
cessing device, a compromise should be reached be-
ICPRAM 2019 - 8th International Conference on Pattern Recognition Applications and Methods
770

Table 3: Cost, error rate and probability of appearance of the features groups with LSLD.
MaxMFLOPS (MFLOPS) 0.5 1.0 1.5 2.0 2.5 3.0 3.5 4.0
Error Rate (%) 52.3 57.5 28.5 30.4 31.9 30.1 15.7 13.4
G
1
(MFCC+∆MFCC) 0.0 0.0 100.0 100.0 100.0 100.0 100.0 100.0
G
2
(Pitch+HNR+RUF) 0.0 0.0 0.0 0.0 0.0 0.0 100.0 100.0
G
3
(STE) 73.9 80.8 89.1 93.7 100.0 100.0 25.7 100.0
Selection G
4
(EE) 100.0 100.0 100.0 100.0 100.0 100.0 0.0 100.0
Rate (%) G
5
(ZCR) 91.7 13.6 84.7 83.2 89.0 91.6 0.0 95.3
G
6
(SR) 0.0 100.0 100.0 100.0 100.0 100.0 74.3 93.9
G
7
(SC) 0.0 92.9 96.1 100.0 100.0 91.3 74.3 100.0
G
8
(SF) 0.0 70.2 35.6 40.9 50.6 53.0 15.8 22.9
Table 4: Cost, error rate and probability of appearance of the features groups with LSQD.
MaxMFLOPS (MFLOPS) 0.5 1.0 1.5 2.0 2.5 3.0 3.5 4.0
Error Rate (%) 37.8 41.9 23.4 24.2 22.0 23.8 15.5 15.2
G
1
(MFCC+∆MFCC) 0.0 0.0 100.0 100.0 100.0 100.0 100.0 100.0
G
2
(Pitch+HNR+RUF) 0.0 0.0 0.0 0.0 0.0 0.0 100.0 100.0
G
3
(STE) 18.7 11.0 0.0 0.0 0.0 0.0 0.0 0.0
Selection G
4
(EE) 78.4 46.1 100.0 100.0 100.0 100.0 0.0 100.0
Rate (%) G
5
(ZCR) 100.0 100.0 95.9 96.4 95.9 100.0 0.0 88.6
G
6
(SR) 0.0 100.0 100.0 100.0 100.0 100.0 100.0 100.0
G
7
(SC) 0.0 92.9 74.0 69.9 61.4 67.1 95.4 91.3
G
8
(SF) 0.0 100.0 100.0 100.0 100.0 100.0 61.2 96.6
Table 5: Error Rate of the different models of drones in-
cluded in the database.
Model of drone Duration (s) Error Rate (%)
DJI Phantom 3 1573 12.2
Cheerson CX10 284 13.0
Eachine Racer 250 171 21.6
Parrot AR 103 0.0
UDI 817 17 50.0
Table 6: Error Rate of the no-drone sound included in the
database.
No-drone sound Duration (s) Error Rate (%)
Plane 128 3.1
Helicopter 124 0.0
Hair clipper 249 14.1
Construction work 316 22.5
Excavator 147 0.0
Motorbike 150 1.3
Mower 268 8.2
Radial saw 22 36.4
Fire siren 135 40.7
Drag racer 55 7.1
tween the two parameters. On the one hand, if the sys-
tem requires high performance (13.4% of error rate),
the solution should include both the MFCCs and the
features related to pitch, with at least 3.5 MFLOPS.
On the other hand, a worst solution in terms of er-
ror rate could be reached (23.4%), but only using 1.5
MFLOPS in the system. Regarding to the detectors,
the results are better in quadratic case, specially when
the cost constraint is very restrictive.
In conclusion, the experiments developed show
that it is feasible to implement a real time system ca-
pable of detecting drone presence in an autonomous
way. That is possible thanks to the low cost features
proposed in the manuscript, which can be supported
by nowadays microprocessors.
ACKNOWLEDGEMENTS
This work has been funded by the University of Al-
cal
´
a under Project CCGP2017-EXP/060.
REFERENCES
Bautista-Dur
´
an, M., Garcıa-G
´
omez, J., Gil-Pita, R.,
Mohıno-Herranz, I., and Rosa-Zurera, M. (2017).
Energy-efficient acoustic violence detector for smart
cities. Delta, 1:25.
Case, E. E., Zelnio, A. M., and Rigling, B. D. (2008).
Low-cost acoustic array for small uav detection and
tracking. In Aerospace and Electronics Conference,
2008. NAECON 2008. IEEE National, pages 110–
113. IEEE.
Drozdowicz, J., Wielgo, M., Samczynski, P., Kulpa,
K., Krzonkalla, J., Mordzonek, M., Bryl, M., and
Jakielaszek, Z. (2016). 35 ghz fmcw drone detection
Cost-constrained Drone Presence Detection through Smart Sound Processing
771

system. In Radar Symposium (IRS), 2016 17th Inter-
national, pages 1–4. IEEE.
Ganti, S. R. and Kim, Y. (2016). Implementation of de-
tection and tracking mechanism for small uas. In Un-
manned Aircraft Systems (ICUAS), 2016 International
Conference on, pages 1254–1260. IEEE.
Garc
´
ıa-G
´
omez, J., Bautista-Dur
´
an, M., Gil-Pita, R.,
Mohino-Herranz, I., and Rosa-Zurera, M. (2016). Vi-
olence detection in real environments for smart cities.
In Ubiquitous Computing and Ambient Intelligence,
pages 482–494. Springer.
Garc
´
ıa-Gomez, J., Bautista-Dur
´
an, M., Gil-Pita, R., and
Rosa-Zurera, M. (2017). Feature selection for real-
time acoustic drone detection using genetic algo-
rithms. In Audio Engineering Society Convention 142.
Audio Engineering Society.
Giannakopoulos, T., Kosmopoulos, D., Aristidou, A., and
Theodoridis, S. (2006). Violence content classifica-
tion using audio features. In Hellenic Conference on
Artificial Intelligence, pages 502–507. Springer.
Gil-Pita, R., L
´
opez-Garrido, B., and Rosa-Zurera, M.
(2015). Tailored mfccs for sound environment clas-
sification in hearing aids. In Advanced Computer
and Communication Engineering Technology, pages
1037–1048. Springer.
Haupt, R. L., Haupt, S. E., and Haupt, S. E. (1998). Practi-
cal genetic algorithms, volume 2. Wiley New York.
Jalil, M., Butt, F. A., and Malik, A. (2013). Short-time en-
ergy, magnitude, zero crossing rate and autocorrela-
tion measurement for discriminating voiced and un-
voiced segments of speech signals. In Technological
Advances in Electrical, Electronics and Computer En-
gineering (TAEECE), 2013 International Conference
on, pages 208–212. IEEE.
King, J. M. and Faruque, I. (2016). Small unmanned aerial
vehicle passive range estimation from a single micro-
phone. In AIAA Atmospheric Flight Mechanics Con-
ference, page 3545.
Liu, H., Wei, Z., Chen, Y., Pan, J., Lin, L., and Ren, Y.
(2017). Drone detection based on an audio-assisted
camera array. In Multimedia Big Data (BigMM), 2017
IEEE Third International Conference on, pages 402–
406. IEEE.
Mohino, I., Gil-Pita, R., and
´
Alvarez, L. (2011). Stress de-
tection through emotional speech analysis. Advances
in Computer Science, pages 233–237.
Nguyen, P., Ravindranatha, M., Nguyen, A., Han, R., and
Vu, T. (2016). Investigating cost-effective rf-based de-
tection of drones. In Proceedings of the 2nd Workshop
on Micro Aerial Vehicle Networks, Systems, and Ap-
plications for Civilian Use, pages 17–22. ACM.
Qian, H. (2015). Counting the floating point operations
(flops), matlab central file exchange, no. 50608, ver.
1.0, retrieved june 30, 2015.
Van Trees, H. L. (2004). Detection, estimation, and modu-
lation theory, part I: detection, estimation, and linear
modulation theory. John Wiley & Sons.
ICPRAM 2019 - 8th International Conference on Pattern Recognition Applications and Methods
772
