
Clustering and Classification of Breathing Activities by Depth Image
from Kinect
Mera Kartika Delimayanti
1,3
, Bedy Purnama
1,4
, Ngoc Giang Nguyen
1
, Kunti Robiatul Mahmudah
1
,
Mamoru Kubo
2
, Makiko Kakikawa
2
, Yoichi Yamada
2
and Kenji Satou
2
1
Graduate School of Natural Science and Technology, Kanazawa University, Kanazawa, Japan
2
Institute of Science and Engineering, Kanazawa University, Kanazawa, Japan
3
Department of Computer and Informatics Engineering, Politeknik Negeri Jakarta, Jakarta, Indonesia
4
Telkom School of Computing, TELKOM University, Bandung, Indonesia
Keywords: Breathing Activities, Depth Image, Classification, Support Vector Machine.
Abstract: This paper describes a new approach of the non-contact capturing method of breathing activities using the
Kinect depth sensor. To process the data, we utilized feature extraction on time series of mean depth value
and optional feature reduction step. The next process implemented a machine learning algorithm to execute
clustering on the resulted data. The classification had been realized on four different subjects and then,
continued to use 10-fold cross-validation and Support Vector Machine (SVM) classifier. The most efficient
classifier is SVM radial with the grid reached the best accuracy for all of the subjects.
1 INTRODUCTION
Breathing is a vital physiological task in living
organisms including human, and one of critical
indicators of a person’s health. There are two methods
to monitor breathing rate activities, contact or non-
contact method. The contact method which
frequently called as invasive method, the sensing
device or some parts of this is put on to the subject’s
organs. For non-contact method which frequently
called as noninvasive method, there is no direct
interaction between the instruments with the subject
(Al-Khalidi et al., 2011).
Many medical instruments can be categorized as
invasive approaches such as Respiratory Inductance
Plethysmography (RIP) (Retory et al., 2016),
Thoracic Impedance (Houtveen et al., 2006),
Impedance Pneumography (IP) (Seppa et al., 2010),
Photoplethysmography (PPG) (Moody et al., 1985),
Acoustic Monitoring (Corbishley and Rodriguez-
Villegas, 2008 and Harper et al., 2003), Strain Gauges
(Groote et al., 2000) and Magnetometers (Levine et
al., 1991). All of the methods are implemented to
monitor human breathing activities. Those are state-
of-the-art devices especially for breathing activities
through direct contact. However, these methods’
primary drawback is that they interfere with the
natural respiration of the subject.
The microwave-based techniques had been
developed for some non-contact respiratory
measurements (Singh et al., 2011 and Devis et al.,
2009). Moreover, the optical-based techniques are
refined too includes Structured Light
Plethysmography (SLP) (Aoki et al., 2005) and
Optoelectronic Plethysmography (OEP) (Aliverti et
al., 2000 and Cala et al., 1996). Despite the fact that
there is no need to directly contact with the subject
while measuring, these instruments tend to have the
complicated procedure.
In this research, we proposed a method to measure
the morphological changes of the subject’s chest area
in real-time using Microsoft Kinect V2, which is a
commercial depth camera in order to monitor
breathing activities. Therefore, we can estimate the
activities of the subject based on the monitoring of the
subject’s breathing without contact directly to the
subject.
Figure 1: Microsoft Kinect v2.
264
Delimayanti, M., Purnama, B., Nguyen, N., Mahmudah, K., Kubo, M., Kakikawa, M., Yamada, Y. and Satou, K.
Clustering and Classification of Breathing Activities by Depth Image from Kinect.
DOI: 10.5220/0007567502640269
In Proceedings of the 12th International Joint Conference on Biomedical Engineering Systems and Technologies (BIOSTEC 2019), pages 264-269
ISBN: 978-989-758-353-7
Copyright
c
2019 by SCITEPRESS – Science and Technology Publications, Lda. All rights reserved
The Microsoft had released two series of Kinect;
they were Kinect version 1 (v1) and Kinect version 2
(v2) (Microsoft, 2018). Kinect v2 applied an active
sensor called Time-of-Flight method to measure the
distance of a surface by calculating the round-trip
time of a pulse of light (Kolb et al., 2009). In other
hand, Kinect v1 does not have this ability to do that.
As a result, the depth images resulted from Kinect v2
have better quality compared the other one. Figure 1
shows Microsoft Kinect v2. The mean depth value
from Kinect was reconstructed in time series signal
and after that will be conducted many steps and using
a machine learning algorithm, Support Vector
Machine (SVM) to get the best accuracy results. The
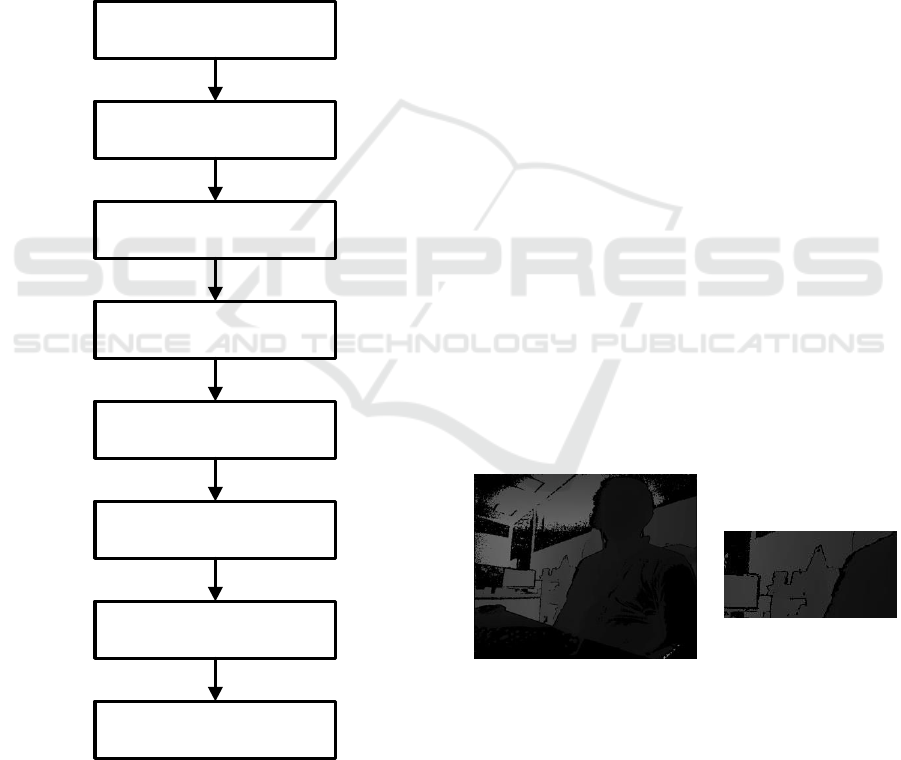
block diagram of this study is shown in figure 2.
Figure 2: Block diagram of this study.
2 MATERIALS AND METHODS
This research had many steps as mentioned previous
and conducted on four different subjects of the
human. After acquiring the data using Kinect, then
processing the time series waveforms into the
features. The clustering and classification steps were
conducted on R programming.
2.1 Acquisition of Depth Image and
Capturing Mean Depth Value
In this step, Kinect was utilized to capture the human
breathing activities. Kinect can capture depth images
at the resolution of 640 x 480 pixels a maximum of
30 fps using IR Receiver. Furthermore, it also can
capture color images using an infrared laser emitter
combined with a monochrome sensor. The
experiment was conducted indoor, and the subjects
were asked to sit at a distance of the depth camera
(Figure 3). In this research, we recorded four samples
three times for different breathing activities in front
of MS Kinect. The activities can be separated as
follows:
First 60 seconds, deep and fast breathing
Second 60 seconds, aloud reading the article in the
newspaper
Last 60 seconds, relaxing by listening deep
meditation music.
All the depth image data were captured and then
continued to calculate the mean depth value from the
Kinect to the subject especially at the Region of
Interest (ROI) on the thorax area. The calculation can
be depicted into the time series waveforms or time
series signal as pointed out in figure 4.
Figure 3: Kinect Depth Image (left) and ROI of Depth
Image (right).
Depth Image Acquisition of
Breathing Activities from Kinect
Capturing Mean Depth value
of ROI (Thorax area)
Time Series Signal of Breathing
Activities
Preprocessing (Segmented
Breathing Epochs)
Feature Extraction of Breathing
Epochs using FFT
Feature Reduction using PCA
Clustering into different
Breathing Activities Clusters
Classification using 10-fold
Cross-validation and SVM
Classifier
Clustering and Classification of Breathing Activities by Depth Image from Kinect
265
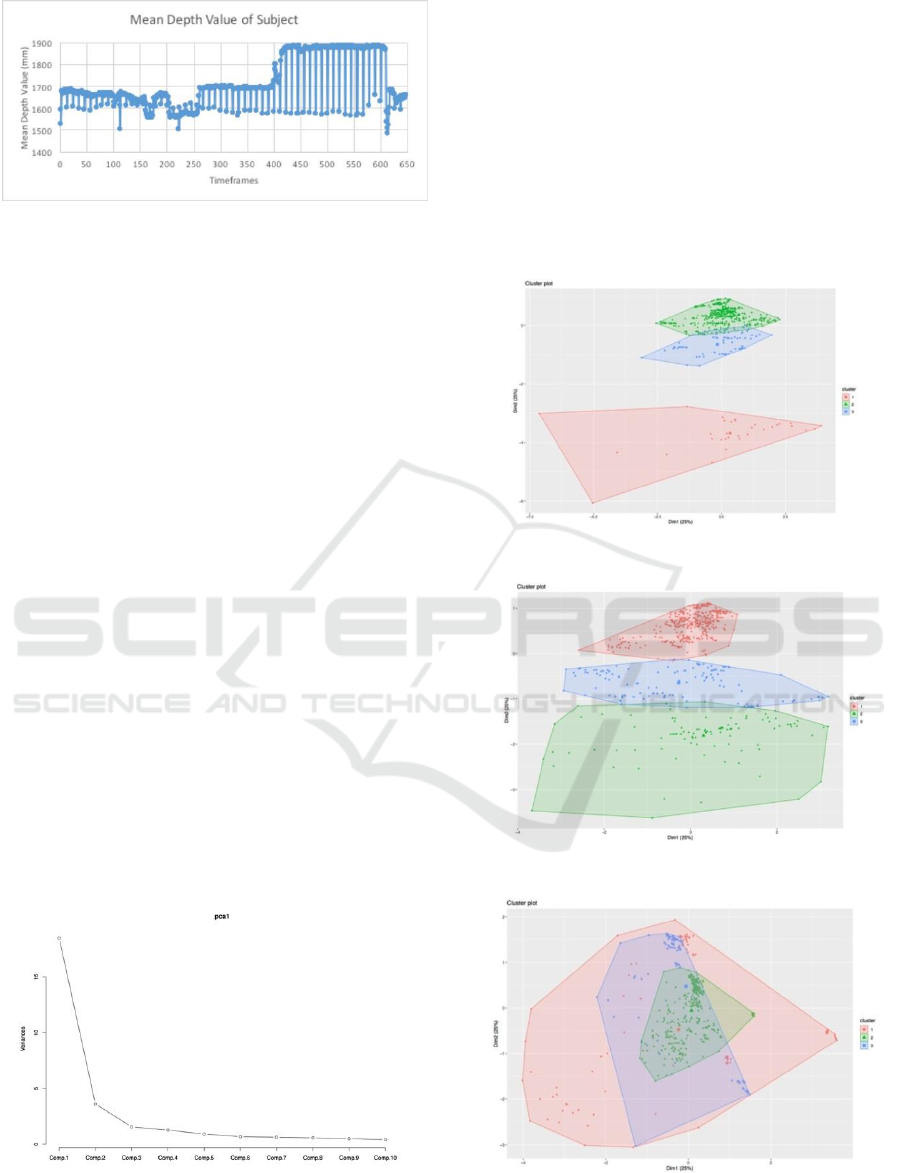
Figure 4: Calculation result of subject 1’s mean depth value
of ROI.
2.2 Feature Extraction and Feature
Reduction
Fast Fourier Transform (FFT) is one of the
recognized and useful tools for signal processing. To
decompose signals into segmented breathing
sequences, we used the equal time intervals called
epoch. For calculating, the length of each epoch was
set to every 30 timeframes. The epochs were then
processed using frequency analysis in which
frequency spectra were generated using FFT. We
used FFT to convert a signal from its original domain
to a representation in the frequency domain and vice
versa (Nussbaumer, 1982). The FFT analysis had
been completed for four samples from four subjects,
and the process continues to extract all of the
principal components (PCs) as the features from the
spectra through Principal Component Analysis
(Jolliffe, 2002). PCA is a dimensional reduction
technique that is commonly used in the time series
signal analysis. To measure breathing activities rate
and to process feature extraction and feature
reduction for each subject, we did separately for each
subject in order to validate the clustering and
classification algorithm. Figure 5 shows the PCA
result from one of the subject.
Figure 5: Example of PCA value one of the subject.
2.3 Clustering
After feature reduction, then applies non-parametric
density-based clustering to the features to detect
clusters in order to validate the annotation of the class
label or labeling events on specific breathing
activities for every timeframe (Azzalini and Torelli,
2007). The clustering algorithm applied a density-
based spatial clustering of Applications with Noise
(DBSCAN). Figure 6 until 9 exhibit the clustering
result in two dimensional from the subjects.
Figure 6: Clustering result of the subject 1.
Figure 7: Clustering result of the subject 2.
Figure 8: Clustering result of the subject 3.
BIOINFORMATICS 2019 - 10th International Conference on Bioinformatics Models, Methods and Algorithms
266
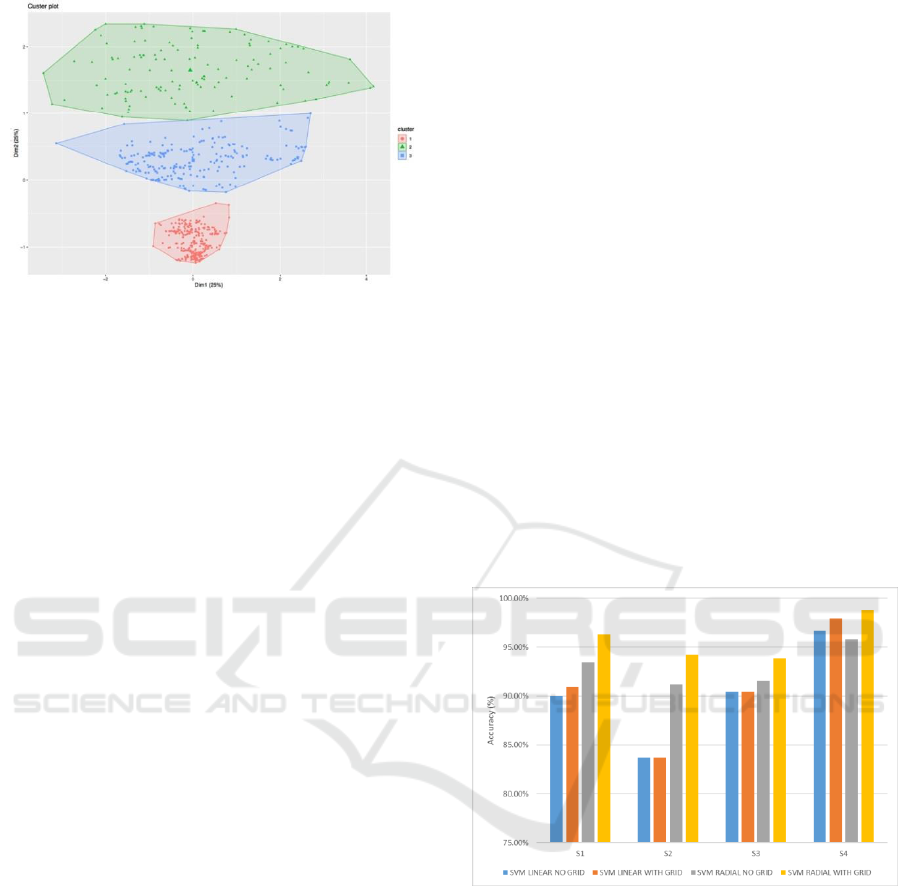
Figure 9: Clustering result of the subject 4.
2.4 Classification
In addition, the data from the subjects were used to be
the dataset. Throughout the experiments, all data were
divided into a training set and a test set. The
classification step was completed with the 10-fold
cross-validation. We trained each fold in order to
have a better estimation of the true error rate of each
set.
The classification was performed using Support
Vector Machine (SVM), a supervised machine
learning method with having good accuracy as well
as being used for Protein Sequence Classification
(Faisal et al., 2018). In this part, an overview of the
method used in this research was explained. The
SVM is a classifier which separates the data in a
different class on a maximal-margin hyperplane. A
hyperplane is a line that splits the input variable
space. SVM changes the information into a higher
dimensional space with the goal that the nonlinear
separable problem in the first example space can be
changed to a linear separable problem. SVM
algorithm implements an implicit mapping of the
input data into a high dimensional feature space as a
kernel function turning the inner product of (x),
(x
i
) between the images of two data points x, x
i
in the
feature space. The data points only appear inside dot
products with other points and the process took place
in the feature space and called The “kernel trick”
which introduced by Scholkopf and Smola (2002).
More precisely, if a projection : XH is used, the
dot product (x), (x
i
) can be represented by a
kernel function k.
k(x,x
i
) = [ (x), (x
i
)]
(1)
which is computationally simpler than explicitly
projecting x and xi into the feature space H
(Karatzoglou et al., 2006).
The caret package was used to execute this
algorithm on R programming. SVM function has a
model using linear kernel and non-linear kernel like
radial basis function; those were realized to get which
one better accuracy in this research. Customization on
SVM function by selecting C value (cost) in linear
classifier by inputting values in grid search. This step
will increase the accuracy result. The results from
classifying the Breathing activities data captured by
MS Kinect v2 for four subjects with 10-fold cross-
validation and SVM classifiers are presented in
Figure 10 and 11. In this paper, we try to use all the
PCs and without using the PCs for feature reduction
in order to get the highest accuracy of the
classification. The classifier was used with SVM
linear and radial basis function with grid or no grid in
R programming. Based on the results, SVM radial
with grid basis function seemed to be a good choice
of classifier among SVM function. Moreover, non-
parametric density can be implemented to execute
clustering of the breathing activities by using depth
image from Kinect v2.
Figure 10: Performance comparison of four subjects using
10-fold cross-validation and SVM classifier with all
components of PCA.
From figure 10 and 11, we had seen that the
accuracy got better value when we did not use PCA
for feature reduction. The performance reached over
95 % for all subjects using SVM radial with the grid
as the classifier. For example, on subject 4, when all
components on PCA was used for feature reduction,
the accuracy reached 98.80%. Hence, PCA was not
used, the accuracy up to 99.5%.
Clustering and Classification of Breathing Activities by Depth Image from Kinect
267
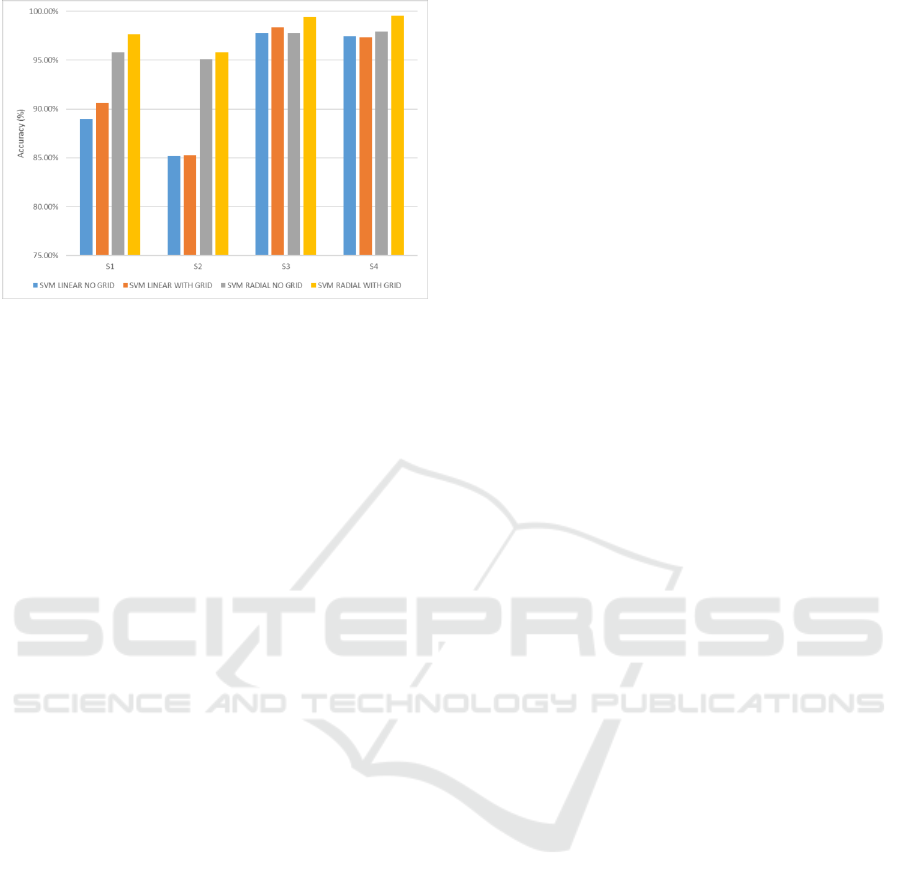
Figure 11: Performance comparison of four subjects using
10-fold cross-validation and SVM classifier without using
components from PCA.
3 CONCLUSIONS
This paper has presented the method of capturing on
breathing activities data from image depth of
Microsoft Kinect v2. This method is the noninvasive
mechanism to estimate the activities of the subject
from breathing activities monitoring. Those data were
used to calculate the mean depth value on Thorax area
and were displayed on time series signal. FFT had
been applied to do the feature extraction from time
series into numeric values. PCA is optionally used for
feature reduction on this classification, but the result
exposed that the highest accuracy was achieved
without using PCA components. As a result, we have
seen that, feature reduction using PCA is not effective
on time series signal in our study. Besides, the process
had carried out the clustering using non-parametric
density estimation, and the supervised machine
learning, classification, the algorithm had been
implemented by doing 10-fold cross-validation and
using SVM classifier for all four subjects. It has been
shown the SVM radial with the grid is the most
efficient classifier with the highest accuracy for all
the subjects over 99%. The result obtained is
promising to predict activities from breathing.
However, further work is required, especially for
feature selection in order to get better classification
results for a larger dataset.
ACKNOWLEDGEMENTS
The first author would like to gratefully acknowledge
the Indonesian Endowment Fund for Education
(LPDP) and The Directorate General of Higher Edu-
cation (DIKTI) for providing BUDI-LN scholarship.
In this research, the super-computing resource
was provided by Human Genome Center, the Institute
of Medical Science, the University of Tokyo.
Additional computation time was provided by the
super computer system in Research Organization of
Information and Systems (ROIS), National Institute
of Genetics (NIG). This work was supported by JSPS
KAKENHI Grant Number JP18K11525.
REFERENCES
Al-Khalidi, F.Q, R., Saatchi, D., Burke, Elphick., Tan, S.,
2011. Respiration Rate Monitoring Methods: A
Review. In International Journal of Pediatric
Pulmonolog.
Aliverti, A., Dellaca, R.L., Pelosi, R., Chiumello, D.,
Pedotti, A. and Gatinoni, L., 2000. Opto-Electronic
Plethysmography in Intensive Care Patients. In
American Journal of Respiratory and Critical Care
Medicine.
Aoki, H., Koshiji, K., Nakamura, H., Takemura, Y. and
Nakajima, M., 2005. Study On Respiration Monitoring
Method Using Near-Infrared Multipleslit-Lights
Projection. In Proceeding of IEEE International
Symposium on Micro-NanoMechatronics and Human
Science.
Azzalini, A. and Torelli, N., 2007. Clustering via
Nonparametric Density Estimation. In Statistics and
Computing.
Cala, S.J., Kenyon, C.M. and Ferrigno, G., 1996. Chest
Wall and Lung Volume Estimation by Optical
Reflectance Motion Analysis. In Journal of Applied
Physiology.
Corbishley, P., Rodriguez-Villegas, E., 2008. Breathing
Detection: Towards a Miniaturized, Wearable, Battery-
Operated Monitoring System. In IEEE Transactions on
Biomedical Engineering.
Devis, D., Gilberto, G., Guido, L., Massimiliano, P., Carlo,
A., Sergio, B., Gianna, C., Walter, C., Massimo, M. and
Juri, L.D., 2009. Non-Contact Detection of Breathing
Using a Microwave Sensor. In Sensors.
Faisal, M.R., Abapihi, B., Nguyen, N.G., Purnama, B.,
Delimayanti, M.K., Phan, D., Lumbanraja, F.R., Kubo,
M., Satou, K., 2018. Improving Protein Sequence
Classification Performance Using Adjacend and
Overlapped Segments on Existing Protein Descriptors.
In Journal Biomedical Science and Engineering.
Groote, A.D., Verbandt, Y., Paiva, Mand Mathys, P., 2000.
Measurement of Thoracoabdominal Asynchrony:
Importance of Sensor Sensitivity To Cross-Section
Deformations. In Journal of Applied Physiology.
Harper, V.P., Pasterkamp, H., Kiyokawa, H. and Wodicka,
G.R., 2003. Modeling and Measurement of Flow
Effects On Tracheal Sounds. In IEEE Transactions on
Biomedical Engineering.
BIOINFORMATICS 2019 - 10th International Conference on Bioinformatics Models, Methods and Algorithms
268

Houtveen, J.H., Groot,P.F. and Geus,E.J., 2006. Validation
of The Thoracic Impedance Derived Respiratory Signal
Using Multilevel Analysis. In International Journal of
Psychophysiology.
Jolliffe, I.T., 2002. Principal Component Analysis. 2
nd
Edition. Springer.
Karatzoglou, A., Meyer, D., Hornik, K., 2006. Support
Vector Machines in R. In Journal of Statistical
Software.
Microsoft, 2018. Kinect for Windows V2. Available from:
https://support.xbox.com/en-US/xbox-on
windows/accessories/kinect-for-windows-v2-info
[accessed November 10th, 2019].
Kolb, A., Barth, E., Koch, R. and Larsen, R., 2009. Time-
Of-Flight Sensors in Computer Graphics. In
Proceedings of Eurographics (State-of-the-Art Report).
Levine, S., Silage, D., Henson, D., Wang, J.Y., Krieg, J.,
LaManca, J. and Levy, S., 1991. Use of a Triaxial
Magnetometer for Respiratory Measurements. In
Journal of Applied Physiology.
Moody, G.B., Mark, R.G., Zoccola, A. and Mantero, S.,
1985. Derivation of Respiratory Signals from Multi-
lead ECGs. In Computers in Cardiology.
Nussbaumer, H.J., 1982. Fast Fourier Transform and
Convolution Algorithm. Springer.
Retory, Y., Niedzialkowski, P., de Picciotto, C., Bonay, M.,
Petitjean, M., 2016. New Respiratory Inductive
Plethysmography (RIP) Method for Evaluating
Ventilatory Adaptation during Mild Physical Activities.
In PLoS One.
Singh, A., Lubecke, V. and Boric-Lubecke, O., 2011. Pulse
Pressure Monitoring Through Non-Contact Cardiac
Motion Detection Using 2.45 GHz Microwave Doppler
Radar. In Proceeding of Engineering in Medicine and
Biology Society.
Seppa,V.P., Viik, J. and Hyttinen, J., 2010. Assessment of
Pulmonary Flow Using Impedance Pneumography. In
IEEE Transactions of Biomedical Engineering.
Scholkopf, B. and Smola, A., 2002. Learning with Kernels:
Support Vector Machines, Regularization,
Optimization, and Beyond. MIT Press.
Clustering and Classification of Breathing Activities by Depth Image from Kinect
269
