
A Novel Approach for Development of Neural Network based Electrical
Machine Models for HEV System-level Design Optimization
Christian Gletter
1
, Andre Mayer
1
, Josef Kallo
2
, Thomas Winsel
3
and Oliver Nelles
4
1
Daimler AG, Stuttgart, Germany
2
Faculty of Engineering, Computer Sciences and Psychology, Ulm University, Germany
3
Department of Mechanical Engineering, Kempten University of Applied Sciences, Germany
4
Department of Mechanical Engineering, University of Siegen, Germany
Keywords:
Neural Networks, Scalable Component Model, Electrical Machine, Hybrid Electric Vehicles, System-level
Design, Multilayer Perceptron.
Abstract:
To find the optimal system-level design of hybrid electric vehicles (HEVs), component models are used in
simulations to evaluate a large number of different designs within a high dimensional design space. As the
electrical machine (EM) represents a key component of the HEV powertrain in terms of energy consumption,
models require scalability and sufficient accuracy with manageable computational effort. This paper presents
a novel approach for the development of scalable EM models based on Neural Networks (NN). The models
are trained with data derived by a Finite Element Analysis (FEA) based scaling procedure and capable to rep-
resent the characteristics of a wide range of EM designs without the incorporation of further details. Once a
model is trained, it can be directly used in system-level design optimization. The practicality of the model is
proven within an exemplary simulation study and its goodness of fit to the training data is validated by a sta-
tistical analysis. This approach can help to reduce the computational effort of EM efficiency maps calculation,
since only a small number of time-consuming FEA based scaling simulations must be performed prior to the
optimization.
1 INTRODUCTION
Since the system-level design of HEVs considers dif-
ferent topologies, technologies and component sizes
as well as control strategies, the optimization of such
systems becomes a challenging task. Therefore, re-
search has been done on optimal control strategies
(Wirasingha and Emadi, 2011), component sizing
(Gao and Porandla, 2005) and topology optimization
(Hofman et al., 2012). Within the latest publications,
optimization-based frameworks are being developed
to consider two or more system levels within the op-
timization problem (Silvas et al., 2016). Thus, the
number of design variables and therefore the number
of evaluations for HEV designs increases. Since sim-
ulation models are used for the evaluation of different
HEV designs, appropriate component models, e.g.,
the electrical machine as a key component of HEV
powertrain, must be scalable with corresponding de-
sign variables while satisfying accuracy and compu-
tational effort requirements.
In system-level design optimization the axial and
radial dimensions and/or the number of turns per coil
are often used for sizing the EM. Therefore, so called
scaling laws are suitable to describe the functional re-
lationship between a change in the design variable
and its effect on the EM characteristics within spe-
cific limitations (e.g., same basic construction). In
(Buecherl et al., 2010) analytical models based on
equivalent circuits of different types of EMs are de-
veloped. The axial and radial scaling is expressed
by scalar factors, which are applied within scaling
laws to represent the influence on the equivalent cir-
cuit’s elements such as resistances (losses) and induc-
tances and thus the EM characteristics. Analytical
scaling laws are also applied in the method presented
in (Stipetic and Goss, 2016), where a saturated flux-
linkage model and loss model are used to determine
the characteristics of a reference electrical machine.
Here, the winding is considered as additional design
variable and incorporated by a specific scaling factor.
Another approach is the use of existing efficiency
maps as baseline models and applying scaling meth-
ods to adapt the characteristics of the component
Gletter, C., Mayer, A., Kallo, J., Winsel, T. and Nelles, O.
A Novel Approach for Development of Neural Network based Electrical Machine Models for HEV System-level Design Optimization.
DOI: 10.5220/0007570300170024
In Proceedings of the 5th International Conference on Vehicle Technology and Intelligent Transport Systems (VEHITS 2019), pages 17-24
ISBN: 978-989-758-374-2
Copyright
c
2019 by SCITEPRESS – Science and Technology Publications, Lda. All rights reserved
17
within an appropriate design range. The baseline
efficiency maps are obtained by measurement data
or highly accurate but time-consuming modeling ap-
proaches such as Finite Element Analysis (FEA). In
(Zhou et al., 2015), a database which represents basic
EM characteristics over a wide design range, is ob-
tained by FEA. The baseline design is then scaled by
means of dimensional quantities and the number of
turns per coil to generate new EM designs. A simi-
lar approach is presented in (Domingues et al., 2016),
where a database represents EMs separated by the cat-
egories constant power speed range (CPSR) and outer
radius. The efficiency maps of new machine designs
are then calculated by applying a linear axial scaling
law to specific electrical machine losses.
(Vaillant, 2016) proposes an interesting scaling
method based on data representing combined effi-
ciency maps of EM and power electronics (PE) and
thus the EM system. The baseline designs are catego-
rized into classes of EM systems with different axial
dimensions and therefore different power levels. In
order to calculate new efficiency maps, a regression
function is fitted to a data set consisting of one nor-
malized speed-torque combination for each baseline
map within one class. Repeating this step for each
speed-torque combination allows one to scale the ef-
ficiency maps by varying the power of the EM system.
In order to allow the development of data based
efficiency models without explicit consideration of
scaling laws and presorting different machine designs
into specific classes, a powerful nonlinear regression
method is required. Since specific types of Neu-
ral Networks are known as universal approximators
(Hornik et al., 1989) and thus are capable of mod-
eling complex nonlinear system behavior, this paper
presents a novel approach for the development of scal-
able efficiency models based on NNs for the use in
system-level design optimization.
2 NEURAL NETWORKS
The idea of NN is originally motivated by the repli-
cation of powerful structure of biological neural net-
works for tasks such as information processing, learn-
ing and adaptation (Nelles, 2001). Thus, NNs are well
suited to learn and adapt system behavior from data of
the process within the system i.e the functional rela-
tionship between the input and output variables.
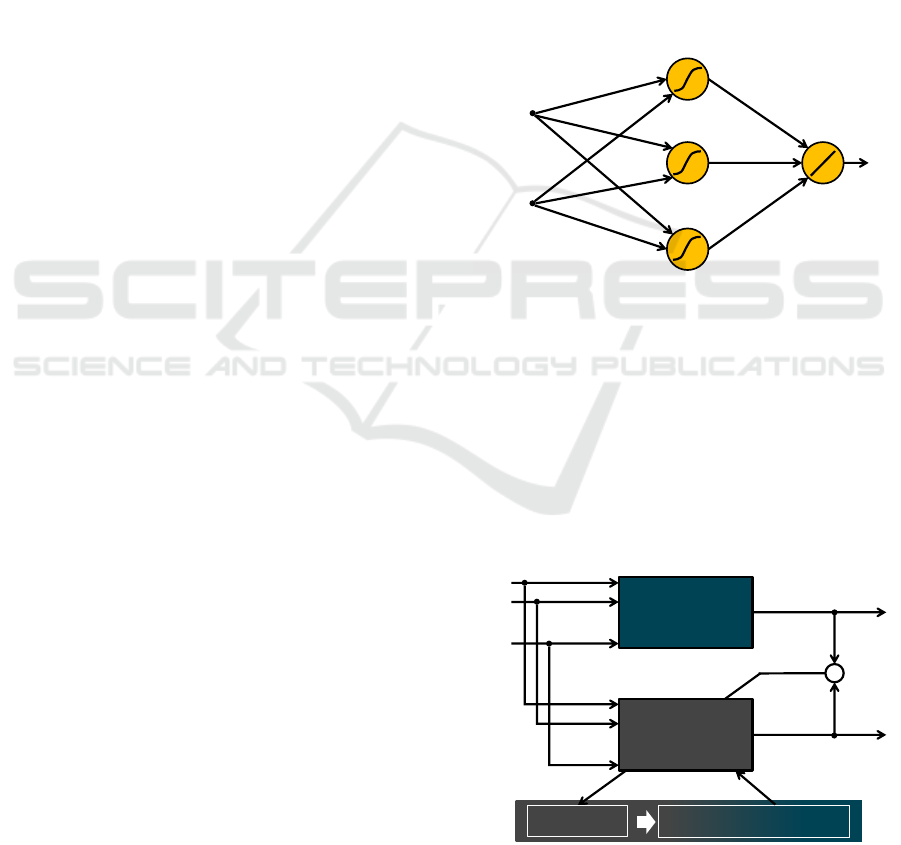
2.1 Multilayer Perceptron
The exemplary network structure of a multilayer per-
ceptron (MLP) is shown in Figure 1 since this type of
NN is used in this work. It consists of one input layer,
one hidden layer and one output layer, and therefore
represents a three layer network. The mathematical
expression for this single output network is given by
ˆy = b
(2)
+
N
n
∑
i=1
w
(2)
i
σ
"
b
(1)
i
+
N
u
∑
j=1
w
(1)
i, j
u
j
#
, (1)
where N
n
denotes the total number of neurons i within
the hidden layer and N
u
the number of inputs u
j
. The
weights and biases, which are optimized by a train-
ing algorithm, are denoted by w and b, respectively.
The superscripts (1) and (2) refer to the correspond-
ing layer (hidden and output layer).
⋮
⋮
Input
Layer
Hidden
Layer
Output
Layer
𝑦
𝑢
1
𝑢
𝑃
Figure 1: Structure of a three layer perceptron.
The nonlinear nature of the MLP arises through
one-dimensional so-called activation functions σ. A
common choice of activation function is the hyper-
bolic tangent (tanh), which is also used in this work.
2.2 Training of Multilayer Perceptrons
In general, the adaption of a model in order to repre-
sent a process behavior is known as system identifica-
tion (Nelles, 2001).
Process /
Simulation
Model
Evaluation
Strategy:
Figure 2: Schematic of system identification process, mod-
ified (Nelles, 2001).
VEHITS 2019 - 5th International Conference on Vehicle Technology and Intelligent Transport Systems
18
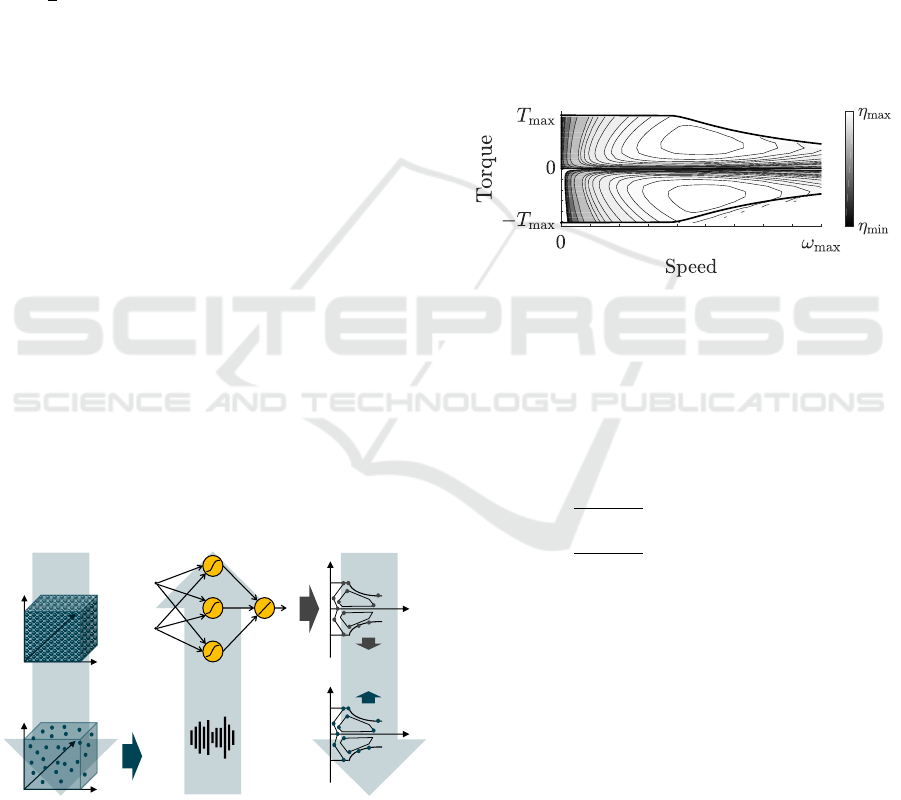
Figure 2 illustrates the system identification
schematically. An optimization procedure varies the
biases and the weights of the MLP in both layers,
while the model is fed with the same inputs as the pro-
cess. The optimization goal is to minimize the model
error e given by the difference of the process output
y and the model output ˆy. The block diagram in the
figure suggests an online optimization procedure. In
this work, the training for the MLP is carried out of-
fline and thus is based on a data set consisting of pre-
viously gathered data points within the design space,
i.e different combinations of values of the input vari-
ables u = [u
1
, u
2
, . . . , u
N
u
]
T
, and its corresponding out-
put values y. The values y for each input combination
u may be drawn either from measurements of the real
process or from complex simulation models. In the
literature, different algorithms have been used for the
training of MLPs, where the most common one is the
backpropagation algorithm. Since this paper focuses
on a novel approach for the application of MLPs in the
development of scalable efficiency models of electri-
cal machines, the well-known training algorithms will
not be discussed in detail. However, for further details
on backpropagation algorithm the reader may refer to
(Rumelhart et al., 1986).
3 METHODICAL APPROACH
Based on the theoretical background of Multilayer
Perceptrons and model training, the methodical ap-
proach for the development MLP-based scalable EM
models (SEMMs) is explained within this section. An
overview of the approach is shown schematically in
Figure 3.
Database Modeling Validation
Design
of
Experiments
FEA
Models
Design
Space
MLP´s
Model
Error
MLP
Training
Training
Data
Figure 3: Schematic of the methodical approach for devel-
opment of MLP-based scalable EM models.
Starting from the left top, a wide range of different
electrical machines are described within the design
space. The term design describes a specific electri-
cal machine characterized by its corresponding design
variables. In order to reduce the computational effort,
a design of experiments (DoE) approach is applied,
which leads to the corresponding training data for the
MLP training illustrated in the middle of the figure.
Subsequent to the training procedure, the accuracy
of the MLP-based scalable EM model is assessed by
comparison with highly accurate FEA based models.
In the following, the elements of the methodical ap-
proach will be described in detail.
3.1 Efficiency Maps of Electrical
Machines
In HEV system-level design optimization, electrical
machines are usually modeled as efficiency maps of
the form η
EM
(T
EM
, ω
EM
), as it is plotted in Figure 4.
Figure 4: Example of an EM efficiency map.
In this diagram, the torque limitations are repre-
sented by the bold lines for motoring T
EM,max
and gen-
erating −T
EM,max
. The efficiencies are given by the
isolines within the maximum torque curves and cal-
culated as the ratio of the mechanical power output
P
EM,mech
and the electrical power input P
EM,el
:
η
EM
=
P
EM,mech
P
EM,el
for P
EM,mech
> 0 (mot.)
P
EM,el
P
EM,mech
for P
EM,mech
< 0 (gen.)
(2)
As it can be seen from the formulation above, the
calculation of the efficiency maps differs for motor-
ing and generating. In this work, P
EM,el
describes the
power either drawn from or supplied to the battery of
the HEV. The approximation of the efficiency behav-
ior can become a challenging task especially in areas
close to the origin axes, since the efficiency is not de-
fined within this regions. Thus, a pragmatic approach
is to carry out first the approximation of the electri-
cal power map P
EM,el
(T
EM
, ω
EM
) and then second the
calculation of η
EM
by the definition given in (2).
3.2 Database and Design Space
The models in this approach consider all losses within
the electrical and mechanical path, e.g., the EM’s iron
A Novel Approach for Development of Neural Network based Electrical Machine Models for HEV System-level Design Optimization
19
losses, copper losses and friction losses, as well as
losses caused by power electronics (PE) and thus rep-
resent the whole EM system.
3.2.1 FEA Model Database
In order to allow the consideration of possible EM
system designs over a wide design range with suit-
able accuracy, the training data is based on highly ac-
curate simulation models. In this work, an analyti-
cal scaling procedure is applied to a set of FEA mod-
els, where each FEA model represents an EM with a
specific active diameter d
EM
. The analytical scaling
along the design dimensions length l
EM
and number
of turns per coil TC
EM
allows one to consider EMs
spread over the whole design space within the train-
ing data. In this work, only permanent magnet syn-
chronous motors (PMSM) are considered. Further-
more, the technology of these machines is identical in
terms of e.g., magnet layout, winding diagram etc to
represent an unbiased data set. The design space to be
covered by the MLP-based SEMM is defined by the
continuous geometrical EM parameters active diame-
ter and length as well as the discrete number of turns
per coil. Each design within the database refers to an
efficiency optimized EM system including the elec-
trical machine and its corresponding PE and is char-
acterized by its specific efficiency map (see (2)) and
its maximum torque curves. Due to the definition of
continuous design variables, the theoretical number of
possible EM designs is infinite.
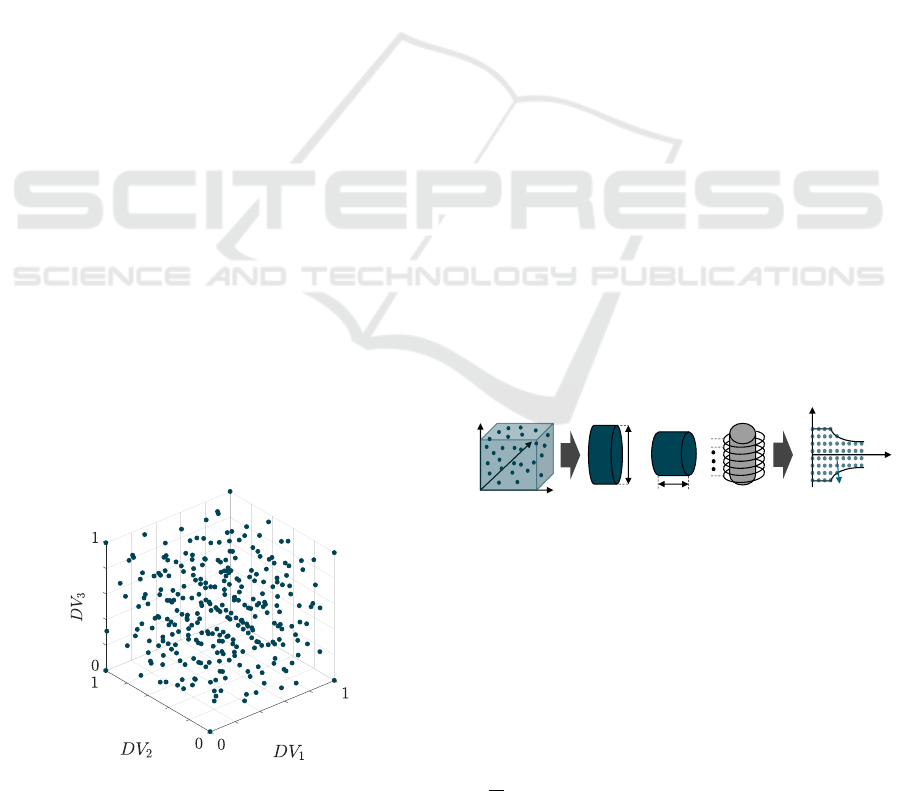
3.2.2 Design of Experiments
Since the efficiency maps of each machine design are
based on a large number of torque and speed combi-
nations, the computational effort of the training pro-
cess increases with the number of considered machine
designs.
Figure 5: Illustration of a Sobol design with three design
variables and 300 electrical machine designs.
Furthermore, the more designs are considered, the
more time-consuming simulations are required for
the generation of the training data. Due to the high
computational effort of the FEA simulations based
data generation and in order to realize a practica-
ble methodology for the development of scalable EM
models, a DoE approach is applied to reduce the num-
ber of considered designs while maintaining a suffi-
cient amount of data for the MLP training. Therefore,
a Sobol distributed spacefilling design (cf. (Sant-
ner et al., 2003)) is used for the choice of a suitable
amount of informative training data within the design
space. For clarity, Figure 5 illustrates a Sobol de-
sign with three design variables (DV
i
) defined on the
normalized interval [0, 1]. Within this work, the vari-
ables d
EM
, l
EM
and TC
EM
span a 3 dimensional design
space over specific variable ranges.
3.3 Scalable Electrical Machine Model
The characteristics of single EM design are defined by
their efficiency maps and the maximum torque curves
and therefore, the two separated models ˆy
Con
and ˆy
Lim
are used for the approximation of the electrical power
consumption map and the torque limitations respec-
tively. The scalability of the models is given by the
consideration of different EM designs an the interpo-
lation capability of the MLP.
3.3.1 Training Data
The training data is based on 300 EM designs defined
by the design parameters d
EM
, l
EM
and TC
EM
where
each design refers to a torque-speed-grid with several
thousand sample points.
EM Designs Design Parameters Sampling Points
𝑇
𝜔
𝑙
EM
𝑑
EM
𝑇𝐶
EM
𝑃
EM,el
(𝑇, 𝜔)
Figure 6: Schematic of the training data composition.
Figure 6 illustrates schematically the generation
and composition of the training data for the training
process. The target y
Con
for the training process of
ˆy
Con
is defined by the electrical power P
EM,el
of the
EM systems at each sample point of the torque-speed-
grids. Thus, the input training data of a single ma-
chine design is represented by the matrix
U
Con,i
=
d
EM,i
d
EM,i
. . . d
EM,i
l
EM,i
l
EM,i
. . . l
EM,i
TC
EM,i
TC
EM,i
. . . TC
EM,i
T
EM,i,1
T
EM,i,2
. . . T
EM,i,N
C
ω
EM,i,1
ω
EM,i,2
. . . ω
EM,i,N
C
, (3)
VEHITS 2019 - 5th International Conference on Vehicle Technology and Intelligent Transport Systems
20

where N
C
denotes the number of torque-speed-
combinations of a single EM. Thus, the entire training
data set for M machine designs is given by:
U
Con
= [U
Con,1
U
Con,2
. . . U
Con,M
] (4)
According to the schematic in Figure 6 and in analogy
to the formulations of (3) and (4) the target data of a
single machine design is given by the vector
y
Con,i
= [P
EM,el,i,1
P
EM,el,i,2
. . . P
EM,el,i,N
C
], (5)
and the entire target data is represented by:
y
Con
= [y
Con,1
, y
Con,2
, . . . , y
Con,M
] (6)
Furthermore, the respective vectors of speed val-
ues ω
EM,i
= [ω
EM,i,1
ω
EM,i,2
. . . ω
EM,i,N
S
] and the
corresponding vectors of maximum torque values
T
EM,max,i
= [T
EM,max,i,1
T
EM,max,i,2
. . . T
EM,max,i,N
S
]
with N
S
elements are used for the training of the scal-
able torque limitation model ˆy
Lim
:
U
Lim
= [U
Lim,1
U
Lim,2
. . . U
Lim,M
] (7)
y
Lim
= [T
EM,max,1
T
EM,max,2
. . . T
EM,max,M
] (8)
In analogy to 3, the first three rows of the matrices
U
lim,i
in 7 are the corresponding values of the design
variables of the i-th machine design.
3.3.2 Training Process
In this work, a nonlinear optimization of the weights
and biases is carried out by the Levenberg-Marquard
algorithm (Marquardt, 1963) to minimize the sum
squared errors of the two models. The used optimiza-
tion technique speeds up the training convergence
compared to the standard gradient descend backprop-
agation algorithm (Hagan and Menhaj, 1994). Fur-
thermore, the training convergence depends on a suit-
able initialization of weights and biases. Thus, a
widely accepted approach based on statistical analysis
for controlled activation weight initialization (Drago
and Ridella, 1992) is applied within this paper. The
attributes of the utilized MLPs are shown in Table 1:
Table 1: Attributes of the utilized models.
Model Structure σ Objective
ˆy
Con
5-80-1 tanh SSE
ˆy
Lim
4-12-12-1 tanh SSE
Both models use hyperbolic tangent (tanh) as ac-
tivation function and are trained by the minimization
of the sum-squared-error
SSE
U
=
N
tr
∑
m=1
(y(m) − ˆy(m))
2
, (9)
where N
tr
denotes the length of the respective training
data set. The model structure is given by a structure
code, where the first number refers to the number of
inputs, the last number refers to the number of out-
puts and the remaining numbers refer to the respec-
tive number of hidden layer neurons. The structure
of the MLPs in this work is found by iteratively in-
creasing the number of hidden layer neurons until the
model accuracy requirements are met (bias-variance
tradeoff, see (Winsel, 2002)). In case the potential
of accuracy improvement is exhausted prior the re-
quirements are met, an additional hidden layer is used
and the procedure is repeated. Thus, the consumption
model ˆy
Con
was found as a three layer network with 5
inputs, one hidden layer with 80 neurons and 1 output.
For an accurate approximation of the constant torque
characteristics, 2 hidden layers have shown a better
performance and thus are used in this work within the
limitation model ˆy
Lim
.
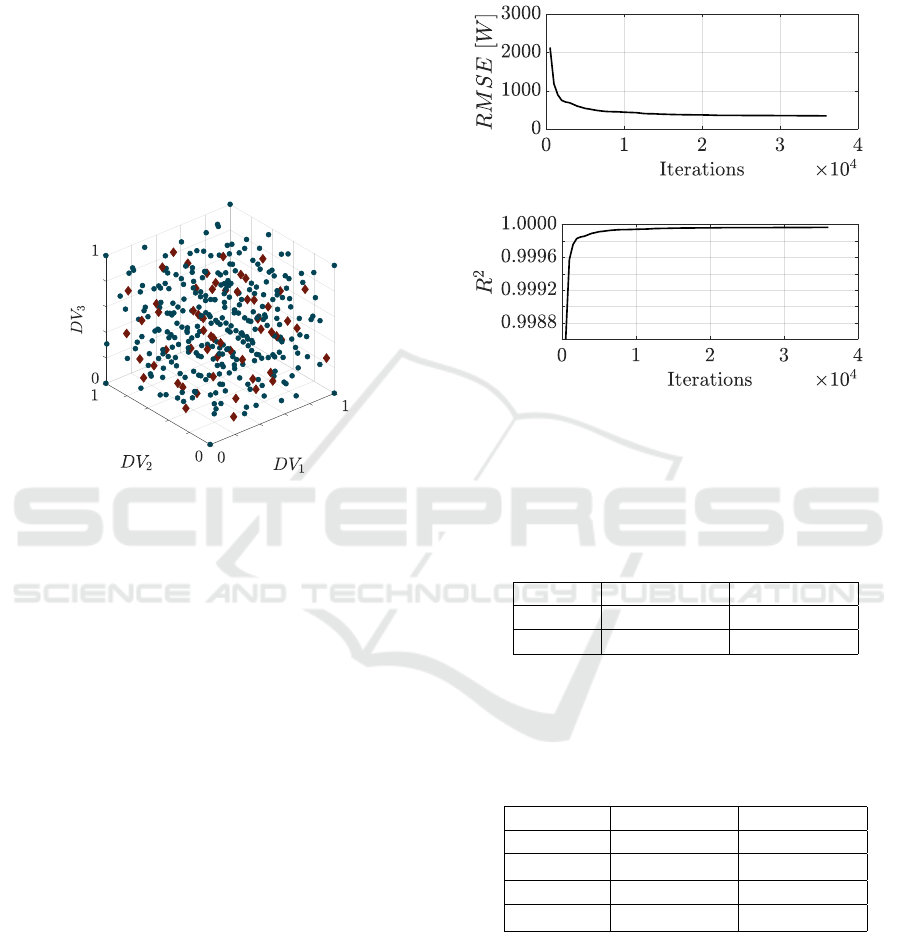
3.4 Model Validation
The validation of the models is split into two steps
and illustrated schematically in Figure 7. The first
step is carried out during the training process by di-
viding the data set into a training set and a validation
set consisting of speed-torque combinations and the
corresponding electrical power values.
Model Training
DoE Data Set
Extended Data Set
1st Step Validation 2nd Step Validation
Validation
Data
Training
Data
Validation
Data
Figure 7: Schematic illustration of the model validation.
Thus, an amount of 20 % of the data points is used
to validate the model performance within the electri-
cal power maps of each EM existent in the training
data by applying the statistics RMSE
val
given by
RMSE
val
=
r
1
N
val
SSE
val
, (10)
and coefficient of determination R
2
val
R
2
val
= 1 −
SSE
val
N
val
∑
m=1
(y(m) − ¯y)
2
, (11)
A Novel Approach for Development of Neural Network based Electrical Machine Models for HEV System-level Design Optimization
21
as a measure of the goodness of the model fit (Magee,
1990), where ¯y denotes the mean of the output values.
These statistics are also used within the second step
of model validation. Therefore, an additional data
set consisting of EM designs not included within the
training data is used for the validation of the interpo-
lation behavior of the scalable models. In this con-
text, the goodness of interpolation behavior is defined
by the extent of overfitting or underfitting within the
model. Figure 8 shows the distribution of 60 EM de-
signs as they are used for the second step of model
validation.
Figure 8: Distribution of additional EM designs for model
validation.
The EM designs for the validation (red diamonds)
are given by an extension of the original Sobol distri-
bution and the data is generated by following the data
generation procedure described in Section 3.2 for the
additional designs.
4 RESULTS
In this section, the introduced methodology is applied
on the defined FEA simulation based training data set
and verified by an exemplary analysis of the training
convergence and the resulting model error of the con-
sumption model ˆy
Con
. With respect to the application
field in HEV system-level design, a simulation study
is carried out to prove the model performance within
a practical context.
4.1 Model Analysis
The verification of the model performance is carried
out during the model training and shown in Figure
9. In diagram a), the minimization progress of the
RMSE is plotted against the number of iterations.
Considering R
2
on its defined co-domain [0, 1], val-
ues close to 1 represent a good model fit if the train-
ing data is not affected with measurement uncertainty.
Since the progress of R
2
converges to 1, the trained
model achieves the required performance.
(a) RMSE
(b) Coefficient of determination R
2
Figure 9: Training convergence and model verification.
The success of the training is summarized for the
consumption model ˆy
Con
and the limitation model
ˆy
Lim
by the resulting statistics given in Table 2:
Table 2: Resulting tranining statistics.
Statistic ˆy
Con
ˆy
Lim
RMSE 344 W 2.85 Nm
R
2
0.999963479 0.999593949
Furthermore, the validation confirms the goodness
of the model fit with similar statistics as achieved dur-
ing the verification process. These measures are given
for both models and two validation steps in Table 3
Table 3: Resulting validation statistics.
Statistic ˆy
Con
ˆy
Lim
RMSE
val,1
345 W 2.85 Nm
R
2
val,1
0.999963305 0.999597185
RMSE
val,2
324 W 2.87 Nm
R
2
val,2
0.999967438 0.999569435
Due to the application field in HEV system-level
design, the scalable EM models require rather high
values of R
2
than in other modeling tasks since small
deviations in electrical power maps can lead to signi-
ficant differences within the evaluation of energy con-
sumption. For example an model error of 10 W does
not significantly affect the evaluation of energy con-
sumption at high loads e.g., 100 kW, but does in areas
of small loads as it is present in typical driving cycles.
VEHITS 2019 - 5th International Conference on Vehicle Technology and Intelligent Transport Systems
22
4.2 Simulation Study
In order to prove the practicality of the developed
MLP-based scalable EM models, an exemplary sim-
ulation study is carried out. Thereby, the operat-
ing points of the EM in electric drive mode for spe-
cific HEV topologies are used for the evaluation of
the electrical energy consumption. These operating
points are drawn from a hybrid vehicle simulation
model and refer to the Worldwide Harmonized Light
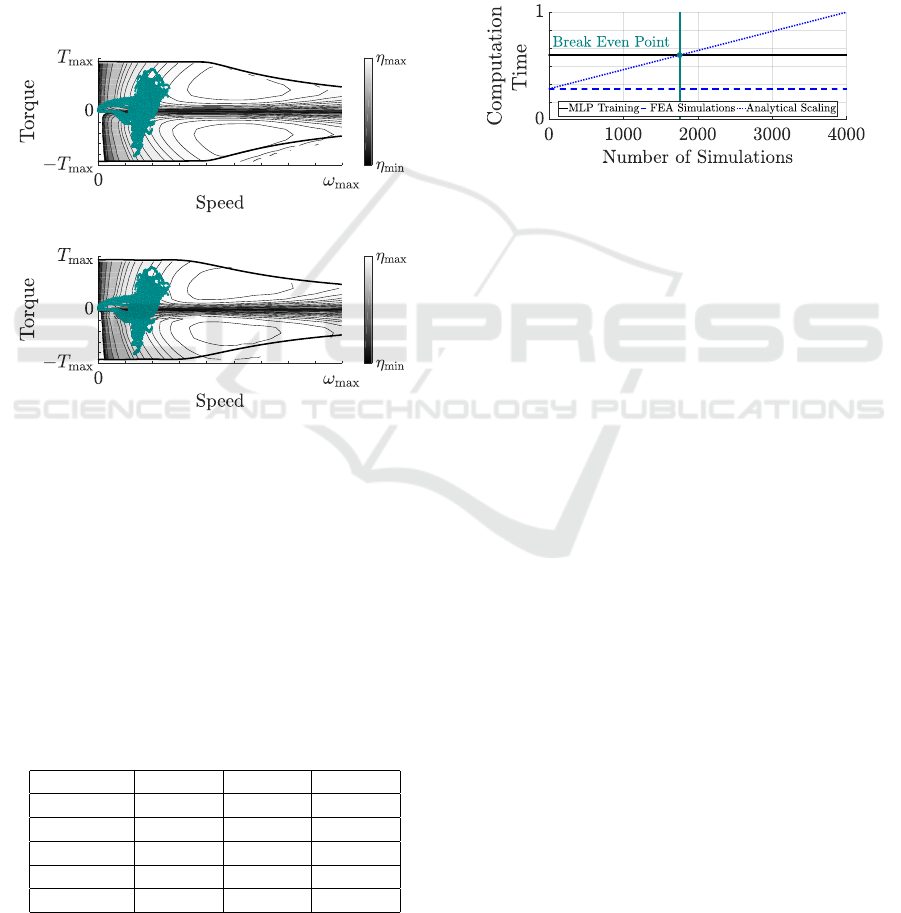
Vehicles Test Procedure (WLTP). Figure 10 illustrates
the operating points plotted into the efficiency maps
of an exemplary FEA based model a) and the corre-
sponding MLP model b) for a specific EM design.
(a) FEA based Model
(b) MLP Model
Figure 10: Efficiency maps with WLPT operating points.
The qualitative comparison of the map character-
istics shows notably deviations in areas close to zero
torque and close to the torque limitation curves. This
behavior was observed for a wide range within the
considered design space. In order to quantitatively
asses the deviations significance in means of energy
consumption evaluation, 5 EM designs (including de-
signs not represented within the training data) are var-
ied within 3 different HEV topologies and thus are
evaluated at different operating points.
Table 4: Relative deviations of energy consumption.
Variations Top 1 Top 2 Top 3
EM
1
0.131 % 0.691 % 0.867 %
EM
2
0.387 % 1.048 % 0.143 %
EM
3
2.662 % 2.202 % 1.480 %
EM
4
0.404 % 1.004 % 0.226 %
EM
5
1.153 % 0.553 % 0.169 %
The relative deviations of the MLP models elec-
trical energy consumptions are given in Table 4. The
investigated electrical machine EM
3
is conspicuous
because of a rather high relative deviation compared
to the remaining values. In this case, EM
3
is charac-
terized by a high maximum torque and thus oversized
with respect to the WLTP operating points. Keeping
this fact in mind, significant deviation can be over-
come by an adequate setting of the design variable
limits. Since the deviations of the remaining EM de-
signs mostly show values smaller than 1 %, the scal-
able EM models possesses sufficient accuracy and
saving potential in terms of computation time if more
than 1800 simulations are carried out (see Fig. 11).
Figure 11: Break even point of simulation numbers.
The diagram shown above can be adapted to ar-
bitrary data generation procedures to assess the effi-
ciency of the proposed modelling approach.
5 CONCLUSIONS
The main focus of this research is a methodical ap-
proach using the strength of Neural Networks in non-
linear function approximation for the development of
scalable EM models. This work is motivated by typ-
ical requirements in HEV system-level design opti-
mization in terms of component modeling, namely
scalability and the achievement of sufficient accuracy
with practicable computational effort.
The MLP-based scalable EM models developed
in this paper are capable to represent the characteris-
tics of each EM design within the given design space.
Thus, once the model is trained, it can be directly im-
plemented and used within typical HEV system-level
design simulation studies, e.g., component sizing, by
varying the specified design variables. Since only a
small number of FEA simulations and analytical scal-
ing procedures must be performed uniquely, the intro-
duced approach benefits from high saving potential in
terms of computational effort. The MLP model’s per-
formance is validated by a statistical analysis and its
practicality is proven within an application example.
Future work will include research on different opti-
mization targets, e.g., single losses of the EM system,
and network structures to further increase the model
performance.
A Novel Approach for Development of Neural Network based Electrical Machine Models for HEV System-level Design Optimization
23

REFERENCES
Buecherl, D., Bertram, C., Thanheiser, A., and Herzog,
H.-G. (2010). Scalability as a degree of freedom in
electric drive train simulation. In 2010 IEEE Vehicle
Power and Propulsion Conference. IEEE.
Domingues, G., Reinap, A., and Alakula, M. (2016). De-
sign and cost optimization of electrified automotive
powertrain. In 2016 International Conference on
Electrical Systems for Aircraft, Railway, Ship Propul-
sion and Road Vehicles & International Transporta-
tion Electrification Conference (ESARS-ITEC). IEEE.
Drago, G. and Ridella, S. (1992). Statistically controlled ac-
tivation weight initialization (SCAWI). IEEE Trans-
actions on Neural Networks, 3(4):627–631.
Gao, W. and Porandla, S. (2005). Design optimization of
a parallel hybrid electric powertrain. In 2005 IEEE
Vehicle Power and Propulsion Conference. IEEE.
Hagan, M. and Menhaj, M. (1994). Training feedforward
networks with the marquardt algorithm. IEEE Trans-
actions on Neural Networks, 5(6):989–993.
Hofman, T., Ebbesen, S., and Guzzella, L. (2012). Topol-
ogy optimization for hybrid electric vehicles with au-
tomated transmissions. IEEE Transactions on Vehicu-
lar Technology, 61(6):2442–2451.
Hornik, K., Stinchcombe, M., and White, H. (1989). Multi-
layer feedforward networks are universal approxima-
tors. Neural Networks, 2(5):359–366.
Magee, L. (1990). R2measures based on wald and like-
lihood ratio joint significance tests. The American
Statistician, 44(3):250–253.
Marquardt, D. W. (1963). An algorithm for least-squares
estimation of nonlinear parameters. Journal of
the Society for Industrial and Applied Mathematics,
11(2):431–441.
Nelles, O. (2001). Nonlinear System Identification.
Springer Berlin Heidelberg.
Rumelhart, D. E., Hinton, G. E., and Williams, R. J. (1986).
Learning representations by back-propagating errors.
Nature, 323(6088):533–536.
Santner, T. J., Williams, B. J., and Notz, W. I. (2003).
The Design and Analysis of Computer Experiments.
Springer New York.
Silvas, E., Hofman, T., Murgovski, N., Etman, P., and Stein-
buch, M. (2016). Review of optimization strategies for
system-level design in hybrid electric vehicles. IEEE
Transactions on Vehicular Technology, pages 1–1.
Stipetic, S. and Goss, J. (2016). Calculation of efficiency
maps using scalable saturated flux-linkage and loss
model of a synchronous motor. In 2016 XXII Inter-
national Conference on Electrical Machines (ICEM).
IEEE.
Vaillant, M. (2016). Design Space Exploration zur
multikriteriellen Optimierung elektrischer Sport-
wagenantriebsstr
¨
ange: Variation von Topologie
und Komponenteneigenschaften zur Steigerung von
Fahrleistungen und Tank-to-Wheel Wirkungsgrad.
PhD thesis, KIT Karlsruhe.
Winsel, T. (2002). Stabile neuronale Prozessmodelle - au-
tomatisierte Generierung echtzeitfhiger Modelle zur
Nachbildung des dynamischen Verhaltens von Ver-
brennungsmotoren. VDI-Verlag, Dsseldorf.
Wirasingha, S. G. and Emadi, A. (2011). Classification and
review of control strategies for plug-in hybrid electric
vehicles. IEEE Transactions on Vehicular Technology,
60(1):111–122.
Zhou, K., Ivanco, A., Filipi, Z., and Hofmann, H. (2015).
Finite-element-based computationally efficient scal-
able electric machine model suitable for electrified
powertrain simulation and optimization. IEEE Trans-
actions on Industry Applications, 51(6):4435–4445.
VEHITS 2019 - 5th International Conference on Vehicle Technology and Intelligent Transport Systems
24
