
Detection of Honeybee Disease: Varrosis using a Semiconductor Gas
Sensor Array
Andrzej Szczurek
1
, Monika Maciejewska
1
, Beata Bąk
2
, Jakub Wilk
2
, Jerzy Wilde
2
and Maciej Siuda
2
1
Wroclaw University of Science and Technology, Wybrzeże Wyspiańskiego 27, 50-370 Wrocław, Poland
2
Apiculture Department, Warmia and Mazury University in Olsztyn, Sloneczna 48, 10-957 Olsztyn, Poland
Keywords: Semiconductor Gas Sensor, Indoor Air, Detection, Classification, Honeybee, Disease.
Abstract: The presented study was focussed on the detection of Varroa destructor infestation of honeybee colonies,
based on gas sensor measurements of beehive air. The detection consisted in determination whether the colony
infestation rate was 0% or different. An array of partially selective gas sensors was used in measurements. It
included the following semiconductor gas sensors: TGS832, TGS2602, TGS823, TGS826, TGS2603 and
TGS2600. The sensors were exposed in dynamic conditions. The infestation detection problem was solved
using a classification approach. The basis for classification were feature vectors. They were composed of
responses of sensors, elements of the gas sensor array. The utilised responses were associated with various
parts of the sensor signal recorded during dynamic exposure and regeneration. As a reference, we used the V.
destructor infestation rate of bee colonies estimated using a flotation method. The smallest misclassification
error was 17% and it was achieved with the k-NN classifier. The experimental study was performed in field
conditions. It included honeybee colonies of various kinds, settled in beehives made of various materials,
differently located, examined in various atmospheric conditions, at different times of the day. Taking this into
consideration, the detection error at the level of 17 % is a promising result. It demonstrates the possibility to
detect varroosis using an array of partially selective sensors.
1 INTRODUCTION
Honeybees (Apis mellifera) are one of the most
recognizable domesticated insects in the world. They
are best known for their production of honey and
products, like wax, bee pollen, propolis, royal jelly,
bee venom, apilarnil, etc. However, the greatest value
of honeybees is in their service as pollinators, which
far outweigh their value as honey producers. The
honeybee is well adapted for pollination. Their sense
of smell, eyes, mouthparts and numerous branched
body hairs are ideally suited for finding food sources,
sipping nectar, and collecting and distributing pollen.
These characteristics make honeybees a most
valuable agent for cross-pollinating crops. The EU
parliament noted in 2008 (resolution T6-0579/2008)
that 79% of human food depends on honeybee
pollination. The pollination industry represents a
market of 153 billion € per year (Gallai et al., 2009).
To protect food supply, honeybee populations need to
be maintained in an optimal state of health and
afforded opportunities to grow.
Currently, honeybee populations are decreasing
due to colony collapse disorder (CCD). Bees and
beekeeping are suffering a global crisis. CCD has
been reported from many regions of the world
(Barron, 2015).
Honeybee declines are a serious threat to global
agricultural security and productivity. The CCD is
caused by multiple stressors, both abiotic and biotic
(Cox-Foster et al., 2007; Johnson et al., 2009;
Goulson et al. 2015), e.g. the use of pesticides in
agriculture, the presence of pollutants in
environment, mite infections (i.e. Varroa destructor),
fungal diseases (i.e. Nosema ceranae), viruses (i.e.
Deformed Wing Virus or Acute Bee Paralysis Virus),
climate changes, malnutrition and starvation linked to
environmental degradation. Among these, parasites
are a key driver. Disease problems in honeybees have
intensified in recent years, despite increasing
attention to address them.
Varroa destructor (Varroa mites) are the most
serious threat to honeybees (Martin, 2001; Boecking,
and Genersch, 2008). Varroa were previously known
by the species name Varroa jacobsoni. It is an
58
Szczurek, A., Maciejewska, M., B ˛ak, B., Wilk, J., Wilde, J. and Siuda, M.
Detection of Honeybee Disease: Varrosis using a Semiconductor Gas Sensor Array.
DOI: 10.5220/0007575600580066
In Proceedings of the 8th International Conference on Sensor Networks (SENSORNETS 2019), pages 58-66
ISBN: 978-989-758-355-1
Copyright
c
2019 by SCITEPRESS – Science and Technology Publications, Lda. All rights reserved

external parasitic mite that attacks the honeybees Apis
cerana and Apis mellifera. The disease caused by the
mites is called varroosis. Varroa mites (V. destructor
and V. jacobsoni) are tiny red-brown external
parasites of honeybees. Although Varroa mites can
feed and live on adult honeybees, they mainly feed
and reproduce on larvae and pupae in the developing
brood. They cause physical damage, weaken bees and
transmit a variety of pathogens, particularly viruses.
If the Varroa mites are left untreated, the commercial
honeybee colonies will normally die within three to
five years. V. destructor is considered to be one of
multiple stress factors with the most pronounced
economic impact on the beekeeping industry,
contributing to the higher levels of bee losses around
the world. According to the USDA, 42 percent of
commercial hives in the U.S. were infested in summer
2017, and 40 percent of beekeepers said the parasite
seriously harmed their colonies (Pomeroy, 2018). By
comparison, only 13 percent reported harm from
pesticides.
V. destructor mites pose an increasing global
threat to the apicultural industry and agricultural
ecology. For that reason, it remains very important to
be able to diagnose and detect mite infection
(Ontarion.ca, 2016).
Different methods can be used to realize this task
(Bak et al., 2009, Randy, 2011). The traditional
approach is based on visual observation and manual
annotation. This method is available to bee specialists
and beekeepers. The Varroa mites, because of
characteristic features, can be found on the body
surface of adults, larvae, and pupae. All stages of the
mite are difficult to detect. In slightly infested
colonies they are mostly found in sealed brood cells.
The mites may be seen on drone and worker pupae in
sealed brood cells. It is first necessary to uncap these
cells and remove the pupae for examination. The
shriveled wings, which are frequently seen in
emerging or old bees and patchy brood patterns allow
to distinguish infected honeybees, but the effects of
mite infection are not always observable. The other
common methods used to diagnose mite infection
involve calculating the number of mites dropped onto
the bottom board of bee hives or calculating the
number of mites in a certain number of honeybees.
The visual inspection provide evidence for the level
of mite infection. Close inspection of brood,
especially drone brood, will provide the great chance
of detecting Varroa mite infections early. This
approach presents also serious shortcomings, e.g.:
it is a very time consuming and expensive
(beekeepers need to spend a certain amount of
time, labor and money);
requires long periods of observation and
sometimes specific expertise in order to be
meaningful;
the beekeeper must visit apiary and hives on a
regular basis (the location for apiary may be far
from the permanent residence of beekeepers);
leads to delays in the prevention and treatment of
infection (it results in the loss of both individual
bees and entire colonies);
the reproduction of female mites in capped brood
cells interferes with the probability of detection
and subsequent treatment.
Detection of mite infection in honeybees based on
visual inspection causes that most beekeepers treat
honeybee colonies, after they find mites or notice
abnormal appearances in honeybees using previous
experience. It is usually too late to control the mites,
when they are found in honeybee colonies. The
beekeeper has to make the necessary intervention at
the right time. Hence, it is important to diagnose and
detect mite infection before parasites have a chance
to spread rapidly and widely.
The disadvantages of visual inspection of
honeybee colonies cause that new methods are
strongly needed. They should be based on real time,
online, continuous measurements of parameters
characterizing state of a bee colony. Additionally, the
non-intrusive access to hives is required in order to
avoid modifying the bees’ work conditions. The
additional stress or unproductive activities of bees is
reflected in data. The progress in sensor and
information technology offers a chance to perform
this task (Zacepins and Karasha, 2013; Meikle and
Holst, 2015; Sánchez et al., 2015; Zacepins et al.,
2016; Gámiz-López and Luna-Rodríguez, 2017).
Practical experiments were done with:
continuous measurement of temperature (Becher
and Moritz, 2009; Stalidzans and Berzonis 2013;
Zacepnis et al. 2016);
infrared imaging (Chen et al., 2012);
air humidity (Gao, 2002);
gas content (Edwards-Murphy et al., 2016);
sound (Eskov and Toboev, 2011);
vibration of hive (Bencsik et al., 2015);
counting of outgoing and incoming bees
(Spangler, 1969);
video observation (Elizondo et al., 2003)
radio frequency identification (RFID)
(Schneider et al., 2012);
weighing of the colony (Meikle et al., 2008).
On basis of such measurements, the beekeeper can
obtain information about: swarming/pre-swarming
state, extreme nectar flow, queenless state, broodless
Detection of Honeybee Disease: Varrosis using a Semiconductor Gas Sensor Array
59
state, dead colony, starving, and first cleaning flight
in spring, diseases, including CCD (Ferrari et al.,
2008).
Nowadays, measurement systems based on
sensors and information technology are not widely
used in the apiculture, despite the importance of
honeybees for both the environment and humans.
These instrumentation is still a challenge for
researchers and various other specialists.
The aim of this study is a measurement system for
the detection of varroosis. The V. destructor mites
affect different parameters of honeybee colony (Hou
et al., 2016; Schurischuster et al., 2016). In our work,
it was assumed that varroosis is reflected in the
quality of the indoor air of a beehive. Based on this
assumption, we want to show that gas sensor array
measurements of the beehive air allow to detect the V.
destructor mite infestation of honeybee colony. In
order to extract the relevant information from the
measurement data, classification methods were used.
Based on the review of the available literature, our
work is the first attempt of applying partially selective
gas sensors to detect varroosis, based on beehive air
measurements.
2 EXPERIMENTAL PART
2.1 The Honeybee Colonies
The studied bee species was A.m. carnica. The
analysis presented in this paper was based on the
statistical sample of 44 colonies of A.m. carnica.
These honeybee colonies occupied beehives located
in four different apiaries, in one geographic region.
Beehives had various constructions and they were
made either of wood or Styrofoam.
Beehives air was examined using gas sensor
measurements and honey bee colonies were
characterised using traditional beekeeping
techniques.
In order to provide a reference for gas sensor
measurements, honeybee colonies were examined in
respect of Varroa destructor infestation rate in a
traditional manner. It was required that the time slot
between the gas sensor measurements and sampling
for V. destructor level assessment was no greater than
three days.
Several methods of Varroa destructor infestation
rate assessment are available (Dietemann et al. 2013).
In this study, a method called flotation was applied
(Fries et al. 1991). It involves collecting a sample of
bees from the honeycombs with brood and placing
them in the jar with the mixture of water and soap.
The jar should be shaken for 20 s to separate the mites
from the adult honeybees. The content of the jar
should be poured over a first sieve (aperture: 3-4 mm)
to collect all bees and let through a second sieve
(aperture < 0.5 mm), located underneath the first, to
collect the mites. The bees and mites should be
flushed with large amounts of warm water. The mites
remaining on the second sieve and the bees in the
sample should be counted. The level of infestation
with Varroa destructor is the number of mites divided
by the number of bees and multiplied by 100.
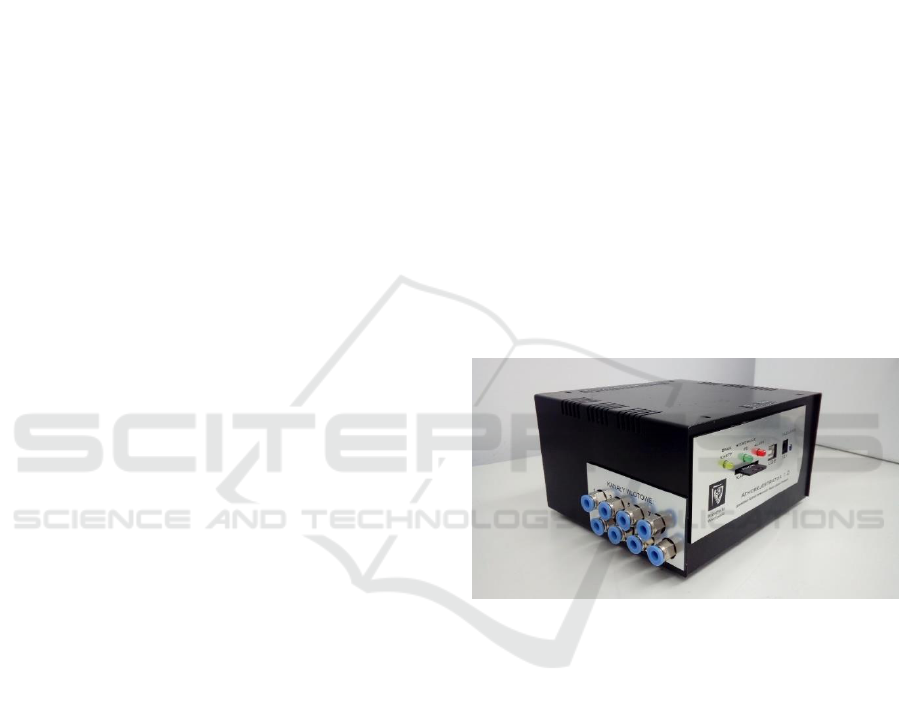
2.2 Gas Sensor Device
In order to examine the gaseous atmospheres of
beehives the measurement device based on gas
sensors was used. It was a portable, programmable,
multichannel instrument, dedicated to the continuous
recording of gas sensor signals, see Figure 1. The
construction was developed in the Laboratory of
Sensor Technique and Indoor Air Quality Studies at
Wroclaw University of Science and Technology,
Poland.
Figure 1: Gas sensor device.
Semiconductor gas sensors were installed in the
device. The commercially available products, offered
by Figaro Engineering, Japan were chosen for this
application. The following Taguchi Gas Sensors were
used: TGS832, TGS2602, TGS823, TGS826,
TGS2603 and TGS2600. The basic characteristics of
sensors is presented in Table 1.
The applied semiconductor gas sensors were
partially selective. Based on data sheets (Figaro
Engineering Inc.) they were sensitive to a wide range
of chemical substances. As shown in Table 1, the
individual sensors differed regarding the kind of the
compounds they could detect as well as in respect of
the detection range. These differences justified the
use of sensor array, which consisted of several gas
sensors. The data utilised in this study was from the
sensor array measurement.
SENSORNETS 2019 - 8th International Conference on Sensor Networks
60

Table 1: Gas sensors applied in the measurement device and
their detection ranges (Figaro Engineering Inc.).
Sensor
Detection range
TGS 823
50 ppm – 5,000 ppm Ethanol, n-Hexane,
Benzene, Acetone
TGS 826
30 ppm – 300 ppm Ethanol, Ammonia,
Isobutane
TGS 832
10 ppm – 600 ppm ethanol, R-407c, R-
134a, R-410a, R-404a, R-22
TGS 2600
1 ppm – 100 ppm Ethanol, Isobutane
TGS 2602
1 ppm – 30 ppm Ethanol, Ammonia,
Toluene
TGS 2603
1 ppm – 30 ppm Ethanol
0.1 ppm – 3 ppm Trimethyl amine,
0.3 ppm – 2 ppm Methyl mercaptan
Regarding sensor device construction, the
individual sensors were placed in their own flow-
through type chambers, inside the instrument. This
arrangement was aimed at minimizing cross-
interferences between sensors, during measurements.
The compartments were made of aluminium. The use
of this material allowed for an efficient heat
exchange, which is important for attaining constant
temperature in the direct vicinity of sensing elements.
Semiconductor gas sensors require heating. Each
sensor was connected to a voltage supplier and to a
measuring unit.
An important element of the device was a pump.
It was necessary for evoking and maintaining the gas
flow through sensors chambers. The device had eight
inlet ports and one gas outlet. The set of valves
allowed for the intermittent connection of the selected
inlet ports to all sensors chambers. The elements of
the gas sensor device, which were in contact with gas
samples, were made of chemically resistant materials.
The device was programmable. Although a
number of operating parameters could be controlled,
the most important for this study was programming
the sequence and timing of gas inlet ports connection
to sensors chambers.
The instrument was dedicated for continuous
recording of gas sensors signals with the predefined
temporal resolution of 1 s. The measurement data was
collected on the SD card. The device runs off mains
supply 230V.
2.3 Gas Sensor Measurements
Dynamic conditions of exposure are one of means of
increasing the information content of gas sensor
signal. For this reason, during beehives air
measurements sensors were exposed in dynamic
conditions.
A single measurement performed with gas sensor
device consisted of two phases: 1. gas sensors
exposure to the test gas, and 2. gas sensors
regeneration. In phase one, gas sensors were exposed
to the air drawn from a beehive. This gas was
delivered to sensors chambers using Teflon tubing.
The gas flow rate was constant. In phase two, gas
sensors were exposed to the ambient air. It was
delivered to sensors chambers at the constant flow
rate, which was the same as the flow rate of beehive
air. The exposure phase was 15 minutes long and the
regeneration phase was 15 minutes long, as well. This
duration was chosen arbitrarily, based on previous
experience with sensor measurements of
multicomponent gas mixtures.
Multiple measurements of individual honeybee
colonies were made. Depending on the colony, the
number measurements varied between 3 and 10. The
successive measurements of the particular honeybee
colony were separated by the time span. The length
of the time span (from 30 min to 3h) was determined
by the number of colonies which were monitored in
sequence with one gas sensor device. The longest
period of the measurement data collection for an
individual honeybee colony was about three days.
It should be emphasized that measurements were
performed in field conditions. The measurements and
characterization of honeybee colonies took place in
late spring, summer and early autumn 2018 (May till
September).
3 METHOD OF DATA ANALYSIS
The problem of detection of honeybee colonies
infestation with V. destructor was represented by a
problem of classification of gas sensor measurements.
Two classes were defined. Class 1 – ‘not infested’
included gas sensor measurements of air in beehives
occupied by honeybee colonies featured by the V.
destructor infestation rate equal zero. At the same
time it should be noted that the term 'not infested' was
adopted conventionally. The honeybee colonies that
are parasite free, are difficult to find in practice. The
infestation ratio of zero means, that infestation was
below the limit of quantification of the method. Class
2 – ‘infested’ included gas sensor measurements of
air in beehives occupied by honeybee colonies
featured by nonzero infestation rate.
3.1 Feature Vector
The result of gas sensor measurement was the sensor
signal. The signal was composed of two parts. The
Detection of Honeybee Disease: Varrosis using a Semiconductor Gas Sensor Array
61

first part was recorded during sensor exposure to the
beehive air. The second part was recorded during
sensor regeneration with ambient air (see Section
2.3). The signal
of the c
th
sensor, where ,
could be represented as the time series of gas sensor
responses,
.
(1)
The single response
was associated with the
time point, . The complete set of time points was
, where was the number of time points
during gas sensor exposure phase and was the
number of time points during sensor regeneration
phase. One time point was 1 s long.
Gas sensor signal was subject to pre-processing.
In our case, the pre-processing stage was constrained
to sensor signal baseline correction. Differential
correction was applied in order to eliminate the shift
of sensor baseline in the period of measurements. The
sensor response after baseline correction was
(2)
where
was the last sensor response during the
regeneration phase, which preceded the
measurement.
In this work, two facts were important for the
classification:
sensor array was used; It was composed of
several sensors, which could differently
contribute to pattern recognition;
sensor signals contain the analytical information,
therefore dynamic conditions of exposure were
chosen.
These facts caused that multiple feature vectors were
considered as the basis of classifciation.
An individual feature vector was composed of
vectors of selected responses of individual sensors,
. Responses after baseline correction were used for
this purpose.
(3)
As shown, signals of all sensors, were
utilised while constructing the feature vector.
A sequence of responses of single sensor formed
the vector
. The first elemet in the sequence,
had the time coordinate
. The coorrdinate could be
any value from the set
s.
where s and
. Therefore, the first
element of the sequence could be associated with
different parts of gas sensor signal.
Seven sequences were considered, which had the
same first element. The sequences were:
…
(4)
As shown, the individual vector
contained
between 1 (as
) and 7 (as
) gas sensor
responses. These responses included in one vector
were separated by the time interval of s. Gas
sensor response changed vividly during 5 s. The
vector
spanned over 1s and the vector
spanned over 30 s of gas sensor signal
The individual feature vector was composed of
six vectors
, or six vectors
, etc. In other
words, for the particular feature vector
and were
fixed. Multiple feature vectors were obtained, by
using different combinations of
and .
The individual feature vector was the basis for the
classification of honey bee colonies based on gas
sensor measurement of beehive air, using a classifier.
3.2 Classifier
Two kinds of classification algorithms were applied:
Linear discriminant analysis (LDA) and K-nearest
neighbors (k-NN) algorithm. Their choice was guided
by the intention of comparing the performance of a
linear and nonlinear classifier. The additional
requirement was to apply relatively simple and
computationally effective algorithms, which could be
easily embedded in the data processing unit of the
measurement device, in the future.
3.2.1 Linear Discriminant Analysis
LDA (Jain et al., 2000; Hierlemann and Gutierrez-
Osuna, 2008) is a technique of linear discrimination
between groups of data vectors. It looks for linear
combinations of variables, which best explain the
data.
In course of the analysis discriminant functions
are calculated, also called canonical variables. These
are weighted sums of the original variables, which
contribute to between group variation. Discriminant
functions are optimal combination of variables in a
sense that that the first function provides the most
overall discrimination between groups, second
provides less discrimination, and so on. Discriminant
functions are orthogonal, which means their
contributions to the discrimination between groups do
not overlap. The maximum number of functions is
SENSORNETS 2019 - 8th International Conference on Sensor Networks
62
equal to the number of groups minus one, or the
number of variables in the analysis, whichever
smaller.
Original data vectors transformed into the space
of canonical variables produce scores. The scores plot
may be used to see how discriminant functions
discriminate the data set.
Next to discriminant functions, classification
functions are calculated. The number of classification
functions equals the number of groups in the data set.
With those functions, classification scores can be
computed for each data vector and for each group.
The highest score obtained for a considered data
vector indicates which group the vector belongs to.
3.2.2 K-nearest Neighbors (k-NN)
Algorithm
K-nearest neighbors (k-NN) algorithm (Jain et al.,
2000; Hierlemann and Gutierrez-Osuna, 2008) is a
well-known classifier, willingly applied for pattern
recognition tasks of various kinds. K-NN is a non-
parametric, nonlinear, distance based method. The
non-parametric classifiers do not require assumptions
regarding the distribution of the input data. This
feature is advantageous, because in many
classification problems, in particular when the
amount of data is limited, the actual data distribution
remains unknown. K-NN is a minimum distance
classifier. The data vector assignment to the class is
based on the distance between this vector and training
vectors. The vector is assigned to the class, which
most frequently occurs among k training vectors,
nearest to it. Highly nonlinear decision boundaries
may be represented using this technique. None
classification functions have to be computed based on
the data. Training vectors are retained in the memory
and called each time the new vector is classified. K is
the only parameter of the method. It is usually chosen
by trial and error method, which allows to avoid the
lengthy process of classifier optimization. We
arbitrarily chose the k = 3.
3.3 Classification Performance
Assessment
10-fold cross-validation was chosen to examine the
performance of the classification algorithms. The
performance of classifiers was measured with
misclassification error. It was defined as the
proportion of misclassified observations averaged for
the complete run of cross-validation procedure.
4 RESULTS
The sample of examined bee colonies consisted of 15
(34%) not infested colonies and 29 (66%) infested
colonies. Considering gas sensor measurements, 111
(38%) measurements represented the class ‘not
infested’ and 181 (62%) measurements belonged to
the class ‘infested’. With such proportions the
measurement data set was slightly imbalanced in
favour of the observations of the infested honeybee
colonies.
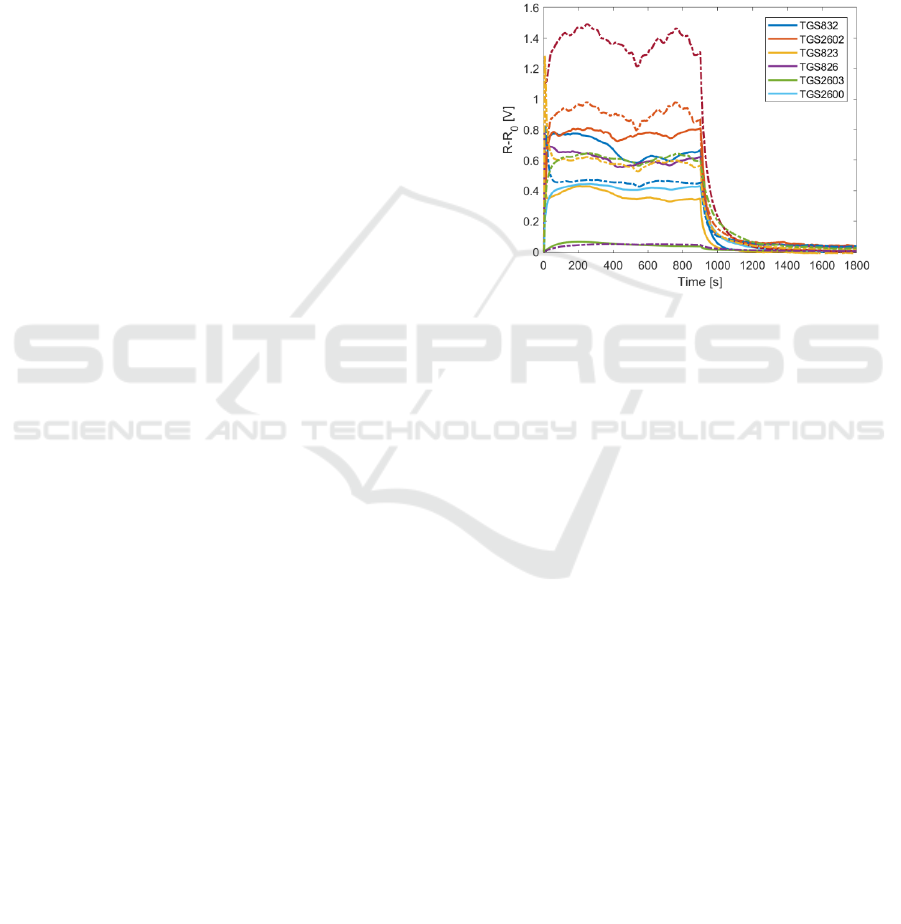
Figure 2: The exemplary signals recorded during gas sensor
measurements of the honeybee colony featured by V.
destructor infestation rate 0% (solid lines) and the
honeybee colony featured by V. destructor infestation rate
2.47% (dashed lines). The horizontal axis provides the
reference to distinguish between the gas sensor exposure
phase (0-900 s) and the regeneration phase (901-1800 s).
Figure 2 shows the exemplary signals recorded
during gas sensor measurements of two beehives. In
one of them, the bee colony was infested with V.
destructor (infestation rate 2.46 %). The other bee
colony was not infested (infestation rate 0%). Based
on Figure 2, in the case of the infested honeybee
colony, the responses of sensors to the beehive air
were higher as compared with the not infested
honeybee colony.
The results of classification of gas sensor
measurements are shown in figures from Figure 3 to
Figure 6. The results achieved when using LDA
algorithm are presented in Figure 3 and Figure 4. The
results obtained with k-NN algorithm are presented in
Figure 5 and Figure 6. The respective plots present
misclassification errors for the training set (Figure 3
and Figure 5) and for the test set (Figure 4 and Figure
6) when applying 10-fold cross validation. The errors
were displayed as a function of time in the time frame
of a single measurement. This allows to observe the
dependency between the misclassification error and
sensor responses included in the feature vector, more
Detection of Honeybee Disease: Varrosis using a Semiconductor Gas Sensor Array
63
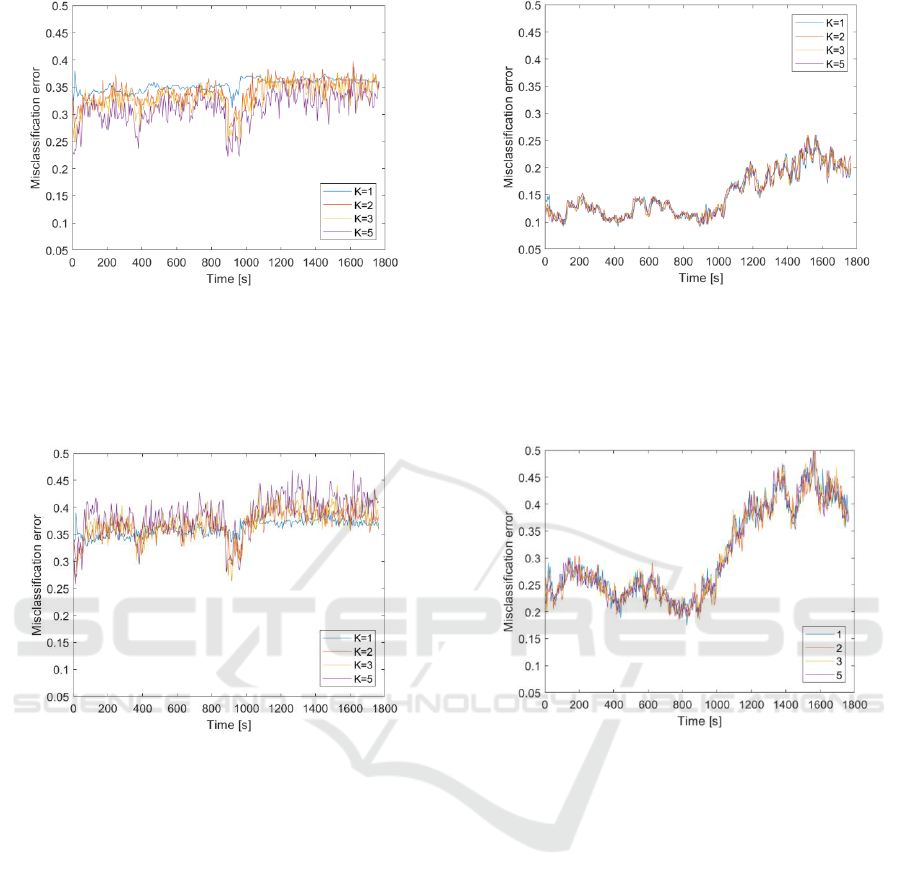
Figure 3: Misclassification error for the training set when
using LDA as the classifier. The horizontal axis provides
the reference to distinguish between the gas sensor
exposure phase (0-900 s) and regeneration phase (901-1800
s), as the sources of gas sensor responses included in the
feature vector.
Figure 4: Misclassification error for the test set when using
LDA as the classifier (10-fold cross validation). The
horizontal axis provides the reference to distinguish
between the gas sensor exposure phase (0-900 s) and
regeneration phase (901-1800 s), as the sources of gas
sensor responses included in the feature vector.
precisely, their location in gas sensor signal. The
misclassification error associated with the particular
time point in time axes of Figure 3 to Figure 6 was
attained when using feature vectors, which ‘start’ at
this time point.
As shown in figures from Figure 3 to Figure 6, the
classification results obtained with LDA and k-NN
algorithms were different. In case of LDA the lowest
misclassification error for the training set was 0.16
and for the test set it was 0.26. In case of k-NN the
lowest misclassification error for the training set was
0.09 and for the test set it was 0.17. The error values
show that k-NN algorithm performed better. On
average, k-NN algorithm allowed to attain
misclassification errors smaller by 10%, as compared
with LDA.
Figure 5: Misclassification error for the training set when
using k-NN as the classifier. The horizontal axis provides
the reference to distinguish between the gas sensor
exposure phase (0-900 s) and regeneration phase (901-1800
s), as the sources of gas sensor responses included in the
feature vector.
Figure 6: Misclassification error for the test set when using
k-NN as the classifier (10-fold cross validation). The
horizontal axis provides the reference to distinguish
between the gas sensor exposure phase (0-900 s) and
regeneration phase (901-1800 s), as the sources of gas
sensor responses included in the feature vector.
The number of elements in the feature vector
differently influenced the misclassification error of
LDA and k-NN algorithms. In case of LDA, the
biggest errors were observed when the feature vector
consisted of responses of sensors collected at one
time point (k=1). The increasing dimensionality of
feature vector caused the decrease of
misclassification error for the training set (see Figure
3). In case of the test set, generally the positive
influence of dimensionality increase was not
observed. As shown in Figure 5 and in Figure 6, the
results of classification with k-NN algorithm, were
not influenced by the size of the feature vector in a
meaningful manner.
Based on figures from Figure 3 to Figure 6, the
location of sensor responses, included in feature
SENSORNETS 2019 - 8th International Conference on Sensor Networks
64

vector, in the sensor signal had an influence on the
misclassification error. Smaller errors were achieved
when responses belonged to the part of sensor signal
associated with gas sensor exposure to the beehive
air. The misclassification errors were bigger when
features belonged to the part of sensor signal
associated with gas sensor regeneration. The results
of classification obtained when using LDA draw
attention to one additional fact. In Figure 3 and in
Figure 4 there could be noticed two zones of small
values of misclassification error. The small errors
were obtained when feature vectors included gas
sensor responses collected at the beginning of the
exposure phase, and at the breakthrough between the
exposure and regeneration phase.
5 CONCLUSIONS
There was presented a study on the detection of
Varroa destructor infestation of honeybee colonies,
based on beehive air measurements using partially
selective gas sensors.
The detection consisted in determination whether
the measurement data represented the colony featured
by the infestation rate 0% or different.
The study included 44 colonies; 29 were infested
and 15 were not infested with V. destructor. Their
characterization by beekeepers and gas sensor
measurements were performed in field conditions, no
more than 2 days apart.
The gas sensor device used for measurements was
equipped with an array of semiconductor gas sensors,
including TGS832, TGS2602, TGS823, TGS826,
TGS2603 and TGS2600. Sensors were exposed in
dynamic conditions.
The V. destructor infestation detection problem
was solved using a classification approach. The basis
for classification were feature vectors composed of
responses of gas sensor array.
Based on the performed analysis, the lowest
misclassification error was 17% and it was achieved
with a k-NN classifier.
The experimental study was performed in field
conditions, it included beehives of various kinds,
made of various materials, settled in different
locations, which were examined in various
atmospheric conditions and at different times of the
day. Taking this into consideration, the detection
error at the level of 17% is a very good result.
The obtained result demonstrates the possibility to
detect varroosis using an array of partially selective
sensors. Our further work will focus on the
improvement of the detection method. It is planned to
consider other features of sensor signal as well as
different classifiers. We also think or redefining the
classification problem itself.
ACKNOWLEDGEMENTS
This work was supported by the National Centre for
Research and Development under the grant nr
BIOSTRATEG3/343779/10/NCBR/2017 “Developing
innovative, intelligent tools to monitoring the
occurrence of malignant foulbrood and elevated
levels of infestation with Varroa destructor in
honeybee colonies.”
REFERENCES
Bak, B., Wilde, J., Siuda, M., Kobylińska, M. 2009.
Comparison of two methods of monitoring honeybee
infestation with Varroa destructor mite. Annals of
Warsaw University of Life Sciences – SGGW, Animal
Science 46, 33–38.
Barron, A.B. 2015. Death of the bee hive: understanding the
failure of an insect society. Current Opinion in Insect
Science 10, no. Supplement C, 45–50.
Becher, M.A., Moritz, R.F.A. 2009. A new device for
continuous temperature measurement in brood cells of
honeybees (Apis mellifera), Apidologie 40 577–584.
Bencsik, M., Le Conte, Y., Reyes, M., Pioz, M., Whittaker,
D., Crauser, D., Delso, N.S., Newton, M.I. 2015.
Honeybee Colony Vibrational Measurements to
Highlight the Brood Cycle. PLoS One 10(11),
e0141926
Boecking, O., Genersch, E. 2008. Varroosis - the ongoing
crisis in bee keeping. Journal of Consumer Protection
and Food Safety 3, 221–228.
Chen, C., Yang, E., Jiang, J., Lin, T. 2012. An imaging
system for monitoring the in-and-out activity of
honeybees. Comput. Electron. Agric. 89, 100–109.
Cox-Foster, D.L, Conlan, S, Holmes. E.C, Palacios G., et
al. 2007. A metagenomic survey of microbes in
honeybee colony collapse disorder. Science 318, 283-
287.
Dietemann, V., Nazzi, F.,J Martin, S.J. , Anderson, D.L.,
Locke, B.,Delaplane, K.S ,Wauquiez, Q., Tannahill, C.,
Frey, E., Ziegelmann, B., Rosenkranz, P.D., Ellis, J.D.
2013. Standard methods for Varroa research. J. of
Apicult. Res. 52(1), 1-54, DOI
10.3896/IBRA.1.52.1.09
Edwards-Murphy, F., Magno, M., Whelan, P.M.,
O’Halloran, J., Popovici, E.M. 2016. b+WSN: Smart
beehive with preliminary decision tree analysis for
agriculture and honeybee health monitoring.
Computers and Electronics in Agriculture 124, 211-
219.
Detection of Honeybee Disease: Varrosis using a Semiconductor Gas Sensor Array
65

Elizondo, V.A., Bricerio, M.T., Travieso, C.M. Alonso,
B.A. 2013. Video Monitoring of a mite in honeybee
cells. Adv. Mat. Res. 2, 1107-1113.
Eskov, E.K., Toboev, V.A. 2011. Changes in the structure
of sounds generated by bee colonies during sociotomy.
Entomol. Rev. 91, 347–353.
Ferrari, S., Silva, M., Guarino, M., Berckmans, D. 2008.
Monitoring of swarming sounds in bee hives for early
detection of the swarming period. Computers and
Electronics in Agriculture 64(1), 72-77.
Figaro Engineering Inc. https://www.figaro.co.jp/en/
Fries, I., Aarhus, A., Hansen, H., Korpela, S. 1991.
Comparisons of diagnostic methods for detection of
Varroa jacobsoni in honeybee (Apis mellifera) colonies
at low infestation levels. Exp. Appl. Acarol. 10, 279-
287.
Gallai, N., Salles, J-M, Settele, J, Vaissière, B.E. 2009.
Economic valuation of the vulnerability of world
agriculture confronted with pollinator decline.
Ecological Economics 68, 810–821.
Gao, S. 2002. The effect of temperature and humidity of bee
hive on the Varroa mite. Chin. J. Anim. Husb. Vet.
Med. 4, 46-47.
Gámiz-López, V., Luna-Rodríguez, J.J. 2017. Honeybee
Colonies Remote Monitoring System, Sensors (Basel)
17(1), 55.
Goulson, D., Nicholls, E., Botías, C., Rotheray, E.L. 2015.
Bee declines driven by combined stress from parasites,
pesticides, and lack of flowers. Science 347,1255957.
Hierlemann, A., Gutierrez-Osuna, R. 2008 Higher-order
chemical sensing, Chemical Review 108, 563-613.
Hou, C.S., Li, B.B., Deng, S., Diao, Q.Y. 2016. Effects of
Varroa destructor on temperature and humidity
conditions and expression of energy metabolism genes
in infested honeybee colonies, Genetics and molecular
research: GMR 15(3), 1-13.
Jain, A.K., Dunin, R.P.W., Mao, J. 2000, Statistical pattern
recognition: A review., IEEE Transactions on Pattern
Analysis and Machine Intelligence 2(1), 4-37.
Johnson, R.M., Evans, J.D., Robinson, G.E., Berenbaum
M.R. 2009. Changes in transcript abundance relating to
colony collapse disorder in honeybees (Apis mellifera).
Proc. Natl. Acad. Sci. 35, 14790-14796.
Martin, S. J. 2001. The role of Varroa and viral pathogens
in the collapse of honeybee colonies: a modelling
approach. Journal of Applied Ecology 38(5), 1082–
1093.
Meikle, W.G, Holst, N. 2015. Application of continuous
monitoring of honeybee colonies. Apidologie 46, 10-
22.
Meikle, W., Rector, B., Mercadier, G., Holst, N. 2008.
Within-day variation in continuous hive weight data as
a measure of honeybee colony activity, Apidologie
694-707.
Ontarion.ca. 2016. Varroa Mite - Sampling and Monitoring
Infestation Levels,
http://www.omafra.gov.on.ca/english/food/inspection/
bees/Varroa-sampling.htm
Pomeroy, R. 2018. Accidental Discovery Could Save Bees
From Their Greatest Threat, Real Clear Science.
https://www.realclearscience.com/quick_and_clear_sci
ence/2018/01/15/accidental_discovery_could_save_be
es_from_their_greatest_threat.html
Randy, O., 2011. Sick Bees – Part 11: Mite Monitoring
Methods, ScientificBeekeeping.com.
Sánchez, V., Gil, S., Flores, J.M., Quiles, F.J., Ortiz, M.A.,
Luna, J. 2015. Implementation of an electronic system
to monitor the thermoregulatory capacity of honeybee
colonies in hives with open-screened bottom boards.
Comput. Electron. Agric. 119, 209–216.
Schneider, C.W., Tautz, J., Grünewald, B., Fuchs, S. 2012.
RFID tracking of sublethal effects of two neonicotinoid
insecticides on the foraging behavior of Apis mellifera.
PLoS One 7: e30023.
Spangler, H. 1969. Photoelectrical counting of outgoing
and incoming honeybee, Journal of Economic
Entomology 62, 1183-1184.
Stalidzans, E., Berzonis, A. 2013. Temperature changes
above the upper hive body reveal the annual
development periods of honeybee colonies. Comput.
Electron. Agric. 90, 1–6.
Schurischuster, S., Zambanini, S., Kampel, M., Lamp, B.
2016 Sensor Study for Monitoring Varroa Mites on
Honeybees (Apis mellifera). In Proceedings of the
Visual observation and analysis of Vertebrate And
Insect Behavior (VAIB) Workshop. Cancun/Mexico.
December 2016
Zacepins, A., Karasha, T. 2013. Application of temperature
measurements for bee colony monitoring: a review.
Eng. Rural Dev. 23, 126–131, Jelgava, Latvia.
Zacepins, A., Kviesis, A., Stalidzans, E., Liepniece, M.
Meitalovs J. 2016. Remote detection of the swarming
of honeybee colonies by single-point temperature
monitoring”, Biosystems Engineering 148, 76-80.
SENSORNETS 2019 - 8th International Conference on Sensor Networks
66
