
NEMESIS (NEtwork MEdicine analySIS): Towards Visual Exploration
of Network Medicine Data
Marco Angelini, Graziano Blasilli, Lorenzo Farina, Simone Lenti and Giuseppe Santucci
DIAG, Department of Computer, Control, and Management Engineering Antonio Ruberti,
Sapienza University of Rome, Italy
Keywords:
Network Medicine, Visual Analytics, Interactome.
Abstract:
The emerging Network Medicine domain is causing a shift between diagnosis based on the conventional
reductionist approach, arguing that biological factors work in a simple linear way, and the analysis of per-
turbations within the comprehensive network map of molecular components and their interactions, i.e., the
”Interactome”. As a consequence, clinicians are investigating more than 140,000 interactions between more
than 13,000 genes and their connections with drugs and diseases, along a sequence of ”networks”. Making
sense of this complex structure is a challenging activity and the visual analytics application NEMESIS tries to
attack such a problem allowing for interactively exploring this large body of knowledge, focusing on subsets of
data and investigating their relationships with other relevant dimensions, pursuing the main goal of facilitating
hypothesis formulation and validation.
1 INTRODUCTION
Until recently, the investigation of disease etiology,
diagnosis and treatment, has been based on a con-
ventional reductionist approach. This tenet argues
that critical biological factors work in a simple linear
mechanism to control disease pathobiology. Rather,
they are nearly always the result of multiple pathobi-
ological pathways that interact through an intercon-
nected network: a disease is rarely a direct conse-
quence of an abnormality in a single gene or molec-
ular component (see, e.g., (Chan and Loscalzo, 2012;
Gustafsson et al., 2014)). For example, complex dis-
eases like cancers of different types, have extraor-
dinary complex biological phenomena that underlie
them. Today, big data, genomics, and quantitative in
silico methodologies integration have the potential to
push forward the frontiers of medicine in an unprece-
dented way.
Clinicians, diagnosticians and therapists have long
strived to determine single molecular traits that lead
to diseases. What they had in mind was the idea
that a single golden bullet drug might provide a cure.
However, this reductionist approach largely ignored
the essential complexity of human diseases. Indeed,
a large body of evidence that is now emerging from
new genomic technologies, points out directly to the
cause of disease as perturbations within the interac-
tome, i.e., the comprehensive network map of molec-
ular components and their interactions. Precisely,
the human interactome is composed of direct physi-
cal, regulatory (transcription factors binding), binary,
metabolic enzyme-coupled, protein complexes and
kinase/substrate interactions. Such network is largely
incomplete as well as the connections between genes
and disease. Currently, more than 140,000 interac-
tions between more than 13,000 proteins/genes are
known (see, e.g.,(Korcsmaros et al., 2017; Gustafs-
son et al., 2014)). Consequently, a paradigm shift
is needed towards the development of temporal and
spatial multi-level models, from molecular machiner-
ies to single cells, whole organism and individuals,
including the environment, to reveal the underlying
links among components. This new type of medical
paradigm is called Network Medicine.
The gap between the biological and the informa-
tional mindset can be daunting and might impair from
the beginning the development of shared concepts.
However, the network medicine visualization setting
will certainly also facilitate communications across
disciplines given the immediate and intuitive under-
standing of the network concept and representation, a
visual metaphor that can be used by molecular biolo-
gists to visualize their knowledge in a structured way
ready to be translated into an algorithm on the avail-
able data, as medical or biological goals are defined.
322
Angelini, M., Blasilli, G., Farina, L., Lenti, S. and Santucci, G.
NEMESIS (NEtwork MEdicine analySIS): Towards Visual Exploration of Network Medicine Data.
DOI: 10.5220/0007577003220329
In Proceedings of the 14th International Joint Conference on Computer Vision, Imaging and Computer Graphics Theory and Applications (VISIGRAPP 2019), pages 322-329
ISBN: 978-989-758-354-4
Copyright
c
2019 by SCITEPRESS – Science and Technology Publications, Lda. All rights reserved

Most of the available proposals have the goal of
visualizing the structure of the relationships existing
among genes, diseases, drugs, and biological process,
showing them as networks (see, e.g., (Sharma et al.,
2015; Gladilin, 2017)) offering, in most cases, only
navigational means to traverse their complex struc-
ture. This paper tries to proceed further in this direc-
tion designing a visual analytics solution that allow
for interacting with such networks in order to steer
analysis patterns. Moreover, taking into account that
exploring a single layer is not enough, the proposed
system, NEMESIS, aims at providing an integrated
vision of both information coming from a single ref-
erence network and new derived data coming from the
analysis of one ore more additional networks.
Summarizing, the contribution of the paper is a
novel visual analytics solution encompassing the fol-
lowing main characteristics:
• the integrated visualization of a single network
with multidimensional data derived from the anal-
ysis of the other connected networks;
• the possibility of focusing the analysis on rele-
vant subsets of data (e.g., subsets of diseases) to
steer the explorations and formulate and validate
hypothesis;
• the availability of complex and long lasting pre-
computed analytics that can be used either for
identifying specific subsets of data (e.g., similar
diseases) or presenting multidimensional aggre-
gation of one or more networks to provide sum-
mary information.
The paper is structured as follows: Section 2 de-
scribes the Network Medicine application domain,
Section 3 deals with related proposals, Section 4 de-
scribes the system implementation, and Section 5 de-
scribes the results of an informal user study, con-
cludes the paper and outlines future activities.
2 APPLICATION DOMAIN
The human genome sequencing using high-
throughput next-generation devices is being deeply
affecting current visions of biomedical and clinical
research. More recently, entering the era of per-
sonal whole-genome sequencing, 38 million genetic
variants have been discovered, some of which are
rare mutations and thus may be associated with
large size effect. How to use this large amount of
data to generate better understanding of disease and
find appropriate drug targets? Looking at networks
without a specific biomedical bias in mind and let
the data speak by themselves, so to formulate new
hypothesis to be further validated by experimentalist
and so on, moving within a virtuous circle of shared
knowledge. The unifying framework of visual
explorative data analysis perfectly fits the need
for integrated network-based algorithms in order
to reconcile biological network representation and
large-scale data integration. Networks can, in fact,
be obtained from any sort of information: known
genes-genes interactions, gene expression profiles,
functional annotation, etc. Recently, it has been
shown that the genes associated with a disease are
localized in specific neighborhoods, or ’disease mod-
ules’, within such an interaction network called the
interactome (Vidal et al., 2011) (Khler et al., 2008).
The overall ambition of researchers working in this
field is to both developing a global understanding
of how interactome perturbations result in disease
traits, and to translate computational insights into
concrete clinical applications, such as new drugs and
therapies, diagnostic tools or prognostic/predictive
markers.
According to this, the paper investigates novel
mechanisms for exploring the different network lay-
ers that constitute the complex information network
medicine has to deal with, i.e., the gene-gene network,
drugs-genes network, diseases-genes network, etc.,
with the main goal of supporting explorative analy-
sis, in order to generate and validate hypothesis. Ac-
cording to this goal, the NEMESIS system allows for
focusing on a subset of data, showing its structure and
relationships on both a reference network and on inte-
grated analysis of the other networks, see Fig. 1. Suit-
able coordinated visualizations and analytics, detailed
on Section 4, provide additional support to the inter-
active analysis.
3 RELATED WORK
Information Visualization and Visual Analytics are
long recognized fields that provided benefits for med-
ical data analysis, like stated in (Chittaro, 2001)
(Shneiderman et al., 2013). In particular, the field of
network medicine is becoming prominent in the last
decade, with several research contributions focused
on applying principles of network analysis to the med-
ical field.
Several contributions focused on the visualiza-
tion of interactome ((Chaurasia et al., 2009) (Lu
et al., 2004)), disease module and gene pathways
((Cerami et al., 2010) (Mlecnik et al., 2005)), Elec-
tronic Health Records ((Wang et al., 2011)), phe-
notypes ((Bottomly et al., 2016)) and most of them
use the well-known node-link diagram representation
NEMESIS (NEtwork MEdicine analySIS): Towards Visual Exploration of Network Medicine Data
323
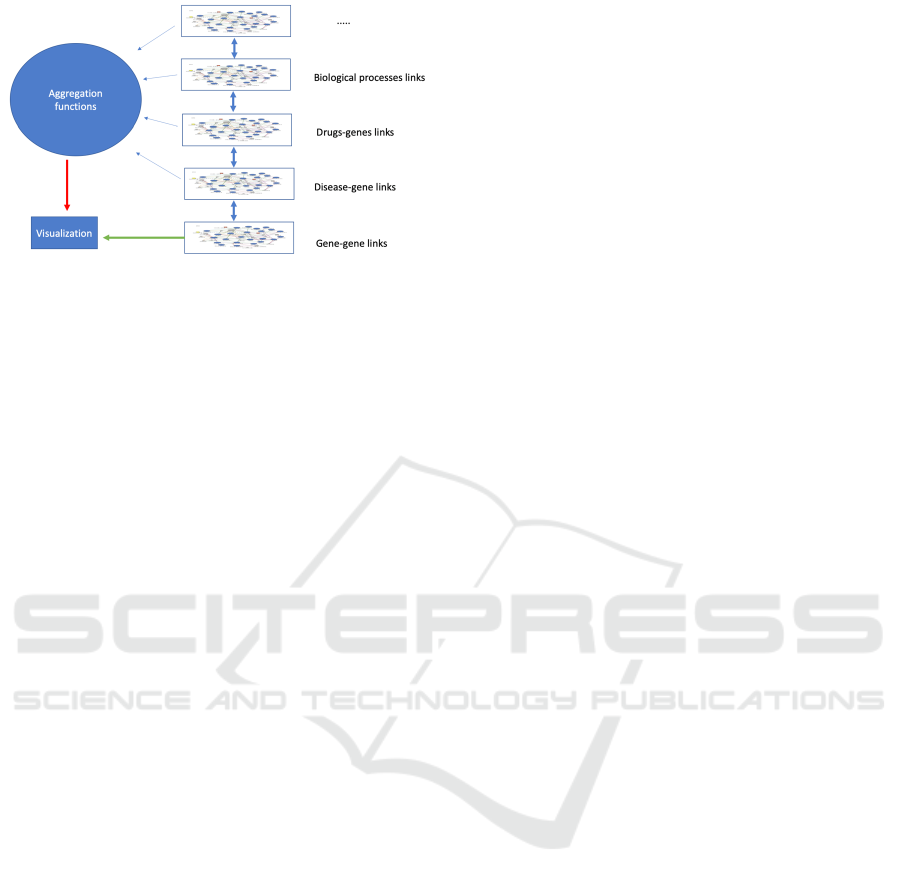
Figure 1: NEMESIS exploration of the different network
layers. The user selects one reference network (e.g.,the
gene-gene links network) that is represented in the visual-
ization using topological pieces of information of the refer-
ence network (e.g.,distance among nodes) together with de-
rived data computed through a generic aggregation function
that uses the other networks (e.g., the number of diseases
that a pair of genes have in common).
for explaining results and analysis outcomes((Sharma
et al., 2015),(Gladilin, 2017)). However, typically
they do not provide any control or only very basic vi-
sual interactions for dealing with the visual environ-
ment. Moreover, general purpose framework exist,
in the form of environments or libraries, that allow
to visualize large biological networks like Cytoscape
((Smoot et al., 2011)), NetBioV (Tripathi et al., 2014)
or HitWalker 2 (Bottomly et al., 2016). The work in
(Merico et al., 2010) proposes a technique for gene set
enrichment visualization; this technique finds func-
tionally coherent gene-sets, such as pathways, that are
statistically over-represented in a given gene list. Ide-
ally, the number of resulting sets is smaller than the
number of genes in the list, thus simplifying interpre-
tation. Differently from our approach no interaction
is provided to analyze the results of the application of
the technique, limiting the analysis capabilities. For
what regards visual analytics solutions, Gerasch et al.
(Gerasch et al., 2014) propose a system for visually
analyzing high-throughput omics data in the context
of networks, in particular for the differential analy-
sis and the analysis of time series data. Perer and
Sun (Perer and Sun, 2012) and Basole et al. (Ba-
sole et al., 2015) propose visual analytics solutions
that analyze clinical patients data: the former takes
clinical patients data as event sequences, constructs
time-evolving networks and visualizes them as a tem-
poral flow of matrices; the latter allows for exploring
data about pediatric asthma care processes. Differ-
ently from our approach they only consider patients
data, effectively focusing only on one plane of anal-
ysis and do not include any multidimensional anal-
ysis and or interactome data. The work in (Huan
et al., 2008) presents PRoteoLEns, a JAVA-based vi-
sual analytics tool for creating, annotating, and ex-
ploring multi-scale biological networks. Nonetheless,
the tool seems very proficient in exploring subparts
of a biological network while does not seems good in
communicating an overview. Finally, inspired by the
visual encoding proposed in (Dietzsch et al., 2009),
NEMESIS relies on easy-relatable visual paradigms
for medical and bioinformatics people, that are not
computer scientist and could not necessarily relate to
more abstract visual representations.
4 THE NEMESIS SYSTEM
This section presents NEMESIS (NEtwork MEdicine
analySIS), a visual analytics solution that allows for
exploring groups of similar diseases, studying the
associated genes, their interactions through the in-
teractome, and the relations that could exist among
them, focusing on single dimensions of analysis or
considering multidimensional properties. NEME-
SIS has been developed in collaboration with med-
ical and bioinformatics personnel through an iter-
ative development cycle that produced 3 different
versions, of which the last is the one presented in
this paper. A working prototype is available at:
http://awareserver.dis.uniroma1.it/nemesis/. Actually
the prototype uses the OMIM dataset [2] of diseases
genes characteristics, composed by:
• 13.401 genes;
• 70 diseases, 20-60 genes per disease (avg: 40);
• 138.405 direct interactions between genes (path of
length 1);
• 5.230.666 computed indirect interactions (derived
data, computing path of length 2).
The NEMESIS environment is visible in Figure 2;
it is composed of 3 main panes: the Interactions Ma-
trix pane that shows data about the relations and path-
ways of interest, the Genes scatter-plot pane, that vi-
sualizes characteristics specific to genes, and the Dis-
eases Analysis pane, that shows data about the con-
sidered diseases. Each of them is described in the fol-
lowing sections.
4.1 Diseases Analysis Pane
This pane allows to select the list of diseases the anal-
ysis will concentrate on. It reports the set of all dis-
eases under analysis, i.e., cancer diseases, whose se-
lection affects all the other linked visualizations. Each
disease is selectable/deselectable through the associ-
ated check-box, with the environment reconfiguring
IVAPP 2019 - 10th International Conference on Information Visualization Theory and Applications
324
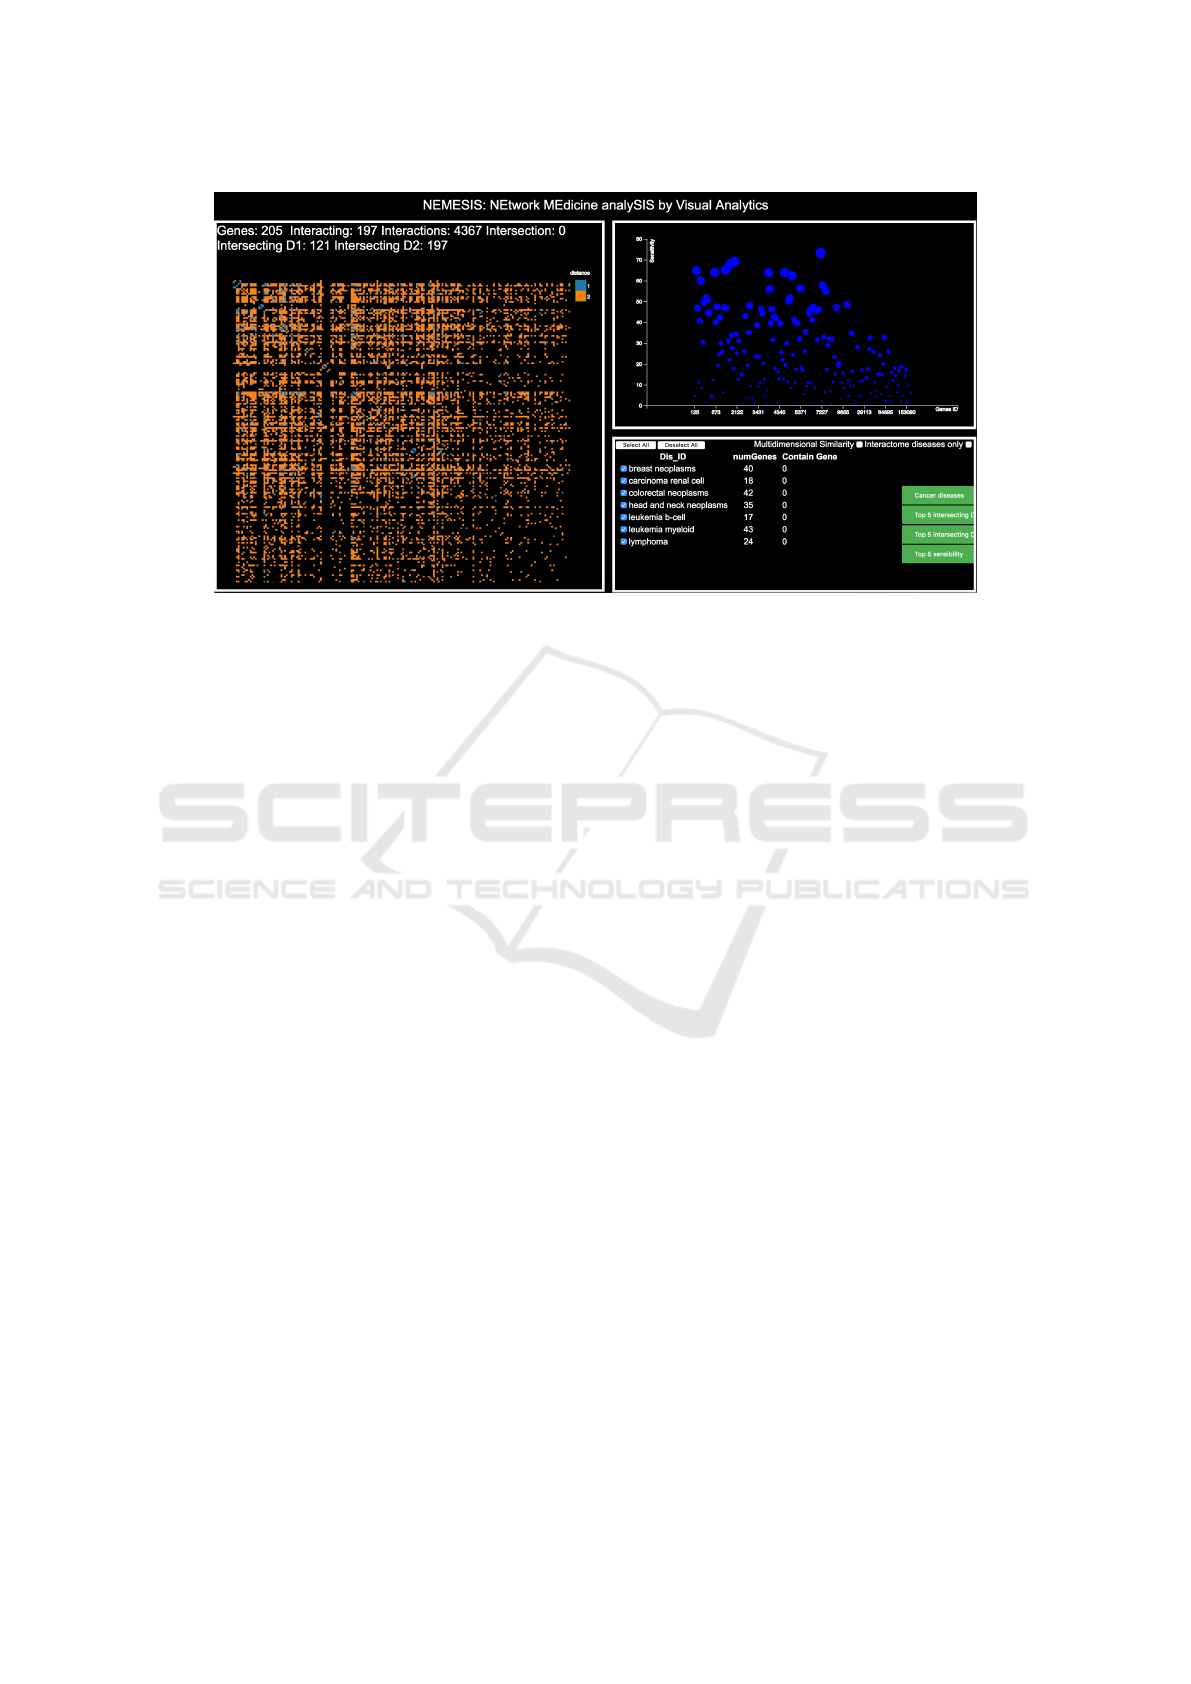
Figure 2: The NEMESIS user interface. The left side contains the Interactions matrix pane, representing interactions among
genes using an enriched matrix representation; the top-right contains the Genes scatter-plot, allowing for inspecting charac-
teristics of specific genes or subsets of them; finally, the bottom-right part contains the interactive diseases list that allows the
analyst to steer the analysis and activate analytics.
accordingly. For each disease, the number of associ-
ated genes and the number of genes involved by the
actual analysis workflow are reported. For obtaining
rapid steering of the analysis, accelerators are present
in the form of “Select All/Deselect All” buttons. In
this way the analyst can choose to inspect genes com-
ing from a starting set of diseases, refining the anal-
ysis on smaller subsets, or even inspecting the genes
belonging to a single disease. An example of these
three cases is visible in Figure 3.
Selecting a subset of diseases will influence the
data presented in the Genes scatter-plot and Interac-
tions Matrix panes, and so it is possible by mouse-
hovering on a disease to see the corresponding genes
highlighted in the Genes scatter-plot (in red), with the
capability to incrementally select more diseases and
explore their intersection by clicking on the name of
the disease. The fixed disease are represented with a
red background, as visible in Figure 4.
Additionally, while computing interactions among
disease genes it is possible to compute paths of length
2 either using only diseases genes or considering all
the interactome genes (by deselecting the “interac-
tome disease only” flag).
An important feature of the NEMESIS system is
the capability to drive the analysis using complex an-
alytics, obtained computing from million to hundreds
of millions of combinations. These functionalities are
labeled as “Biomarkers”, and allow to compute the
Top 5 intersecting diseases considering only the direct
interactions (maximizing intersection at distance=1),
the Top 5 intersecting diseases considering both direct
and indirect interactions (maximizing intersection up
to distance=2), and the Top 5 diseases that maximize
the genes sensitivity. In Figure 8 is visible an ex-
ample in which is computed the Top 5 of diseases
that maximizes intersection considering direct inter-
actions. The highlighting of regular patterns in the
matrix and the strong reduction in cardinality of data
to process make the use of biomarkers very helpful in
conducting analysis.
4.2 Interactions Matrix Pane
This pane contains an enriched interactive visualiza-
tion of the interactome data of interest. Differently
from many contributions that focus on representing
the genes interactions as a node-link diagram, we used
the well-known matrix visual paradigm for represent-
ing the interctome in order to exploit its better read-
ability properties (Ghoniem et al., 2004) and to repre-
sent paths of any length. Indeed, it represents three
types of interactions between genes; genes that do
not have any interactions are represented with a black
square, genes that are directly interacting (connected
through a single link in the interactome) are repre-
sented as a blue square and genes that are indirectly
interacting (a pathway of length 2 exists in the in-
teractome connecting them) are represented as an or-
ange square. In this way the analyst can inspect the
overview of the existing relations among genes that
belongs to the inspected set of diseases, spotting ar-
eas with high number of interactions (likely deserv-
ing further investigations) or low number of interac-
NEMESIS (NEtwork MEdicine analySIS): Towards Visual Exploration of Network Medicine Data
325
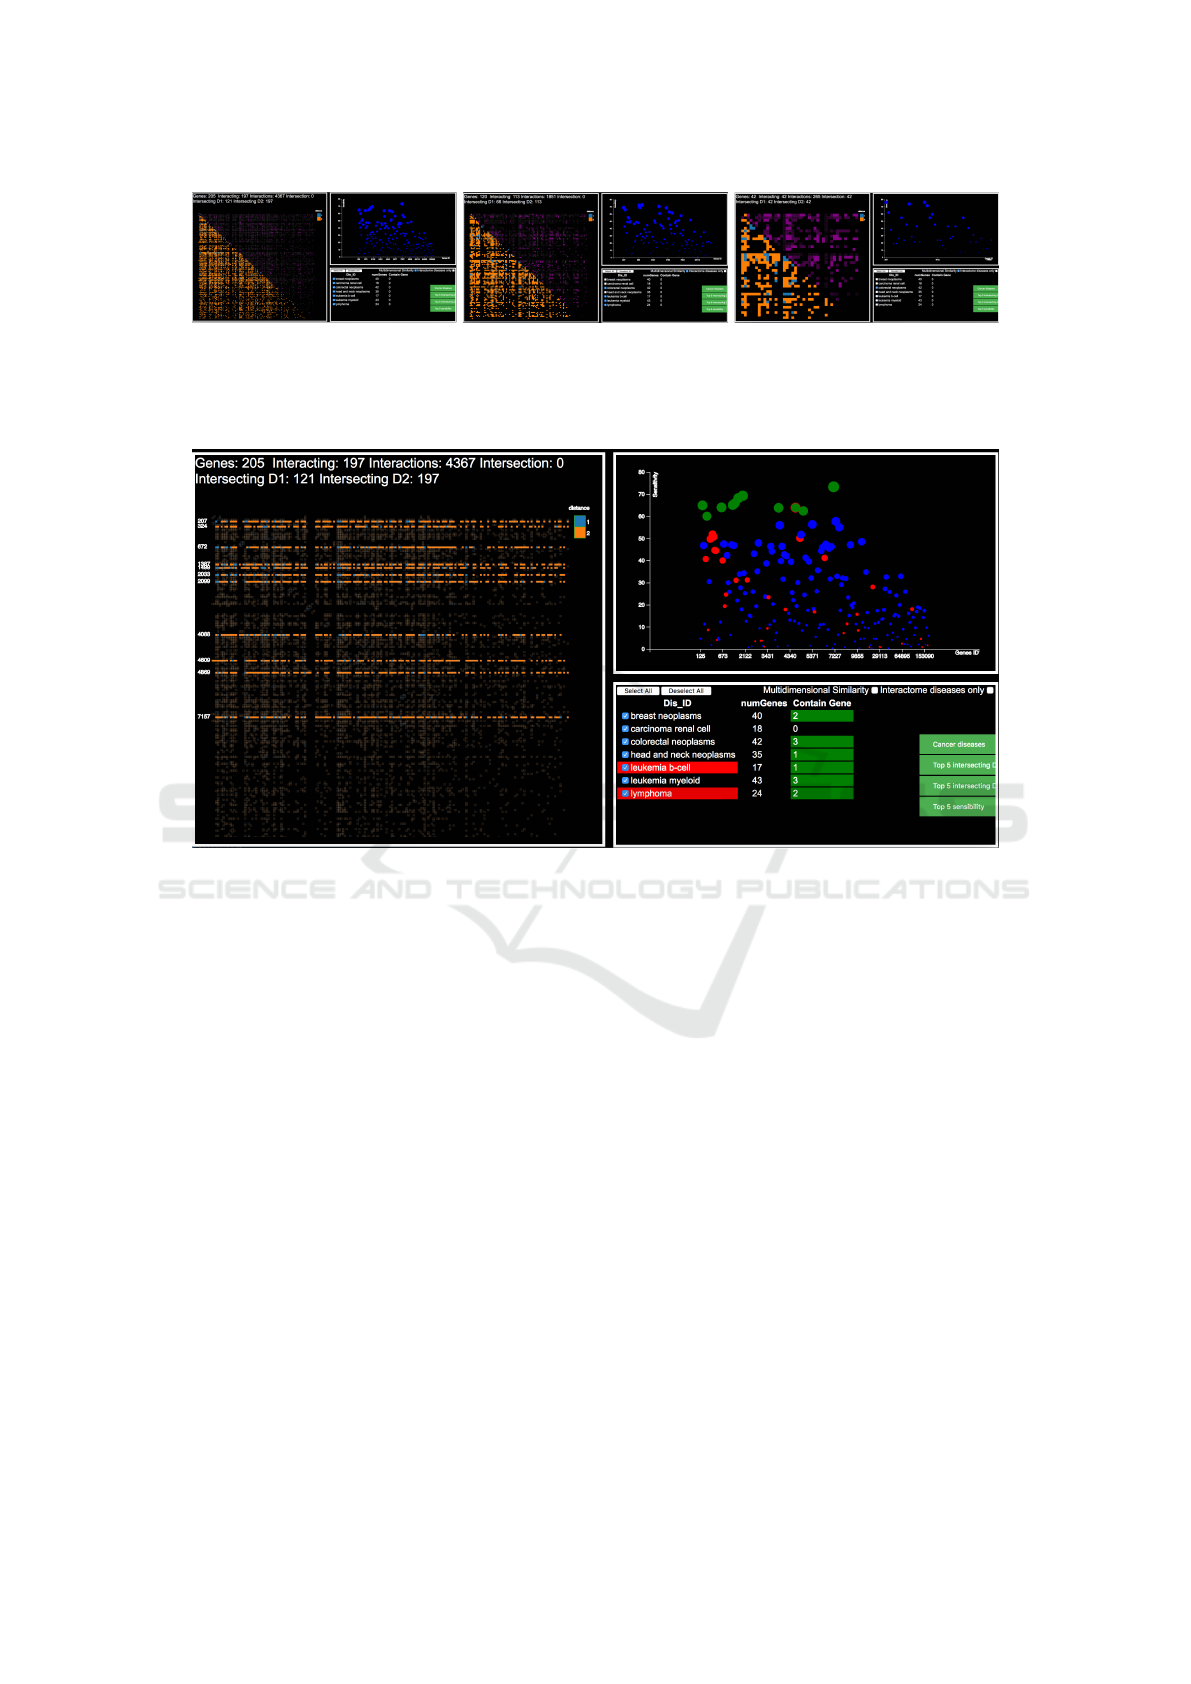
Figure 3: The figure shows three different configurations of the NEMESIS system, obtained by different selections of diseases.
On the left is visible the environment configured to analyze all the available diseases; in the center the analyst has selected a
subset of diseases, deselecting the ones she is not interested in, with both the Interactions matrix and the Genes scatter-plot
reconfiguring accordingly; on the right the analyst has chosen to analyze a single disease, effectively lowering the cardinality
of genes and interactions to analyze.
Figure 4: The analyst selects the lynphoma and leukemia b-cell diseases, blocking the first and hovering the second for
comparing modules. The analysis, superimposed on the previous steps (selection of high sensitivity genes), highlights that in
the modules of these diseases is present only one gene with an high sensitivity, filled in green with a red border.
tions (likely to be discarded). In order to help the
analyst in her work a set of metadata is represented
atop the matrix, showing the number of considered
genes, number of interacting genes, total number of
interactions, number of genes common to the cho-
sen set of diseases expanding the set of genes asso-
ciated to a disease considering only direct interaction
(Intersecting D1) or even indirect interactions (Inter-
secting D2). The analyst can choose to show only
a specific type of interactions (length 1, length 2, or
both) by acting on the interactive legend present at the
right side of the matrix; this mechanism helps in re-
ducing the cardinality of elements to explore starting
by no particular preconditions; the analyst can at any
time explore single interactions obtaining an informa-
tive tooltip containing the IDs of the two interacting
genes, their distance in the interactome and the path
that connects them. An example is visible in Figure 5.
By mouse-hovering on one element of the matrix
the interacting genes are represented using blinking
animation in the Genes scatter-plot pane in order to
identify their derived characteristics. Finally, it is pos-
sible, by clicking on the “Multidimensional similar-
ity” flag in the Diseases analysis pane, to switch be-
tween this mono-dimensional view, considering only
the interactions, and a multi-dimensional one consid-
ering all the dimensions that are tied to a pair of genes
and that are considered to define a similarity measure
between interacting genes. The resulting encoding
shows all the previous data regarding interactions in
the inferior triangular matrix, while the superior tri-
angular matrix is used to map the multidimensional
similarity measure. For this encoding we get inspired
by the work done in (Berger et al., 2008). The simi-
larity measure is normalized in the range [0,1] and as-
sociated with a linear color-scale ranging from black
to purple. An example of its use is visible in Figure 6.
4.3 Genes Scatter-plot Pane
The matrix representation is very effective in present-
ing an overview of the interactions and similarities
and, in order to complement it with information about
other genes characteristics, NEMESIS includes a vi-
IVAPP 2019 - 10th International Conference on Information Visualization Theory and Applications
326
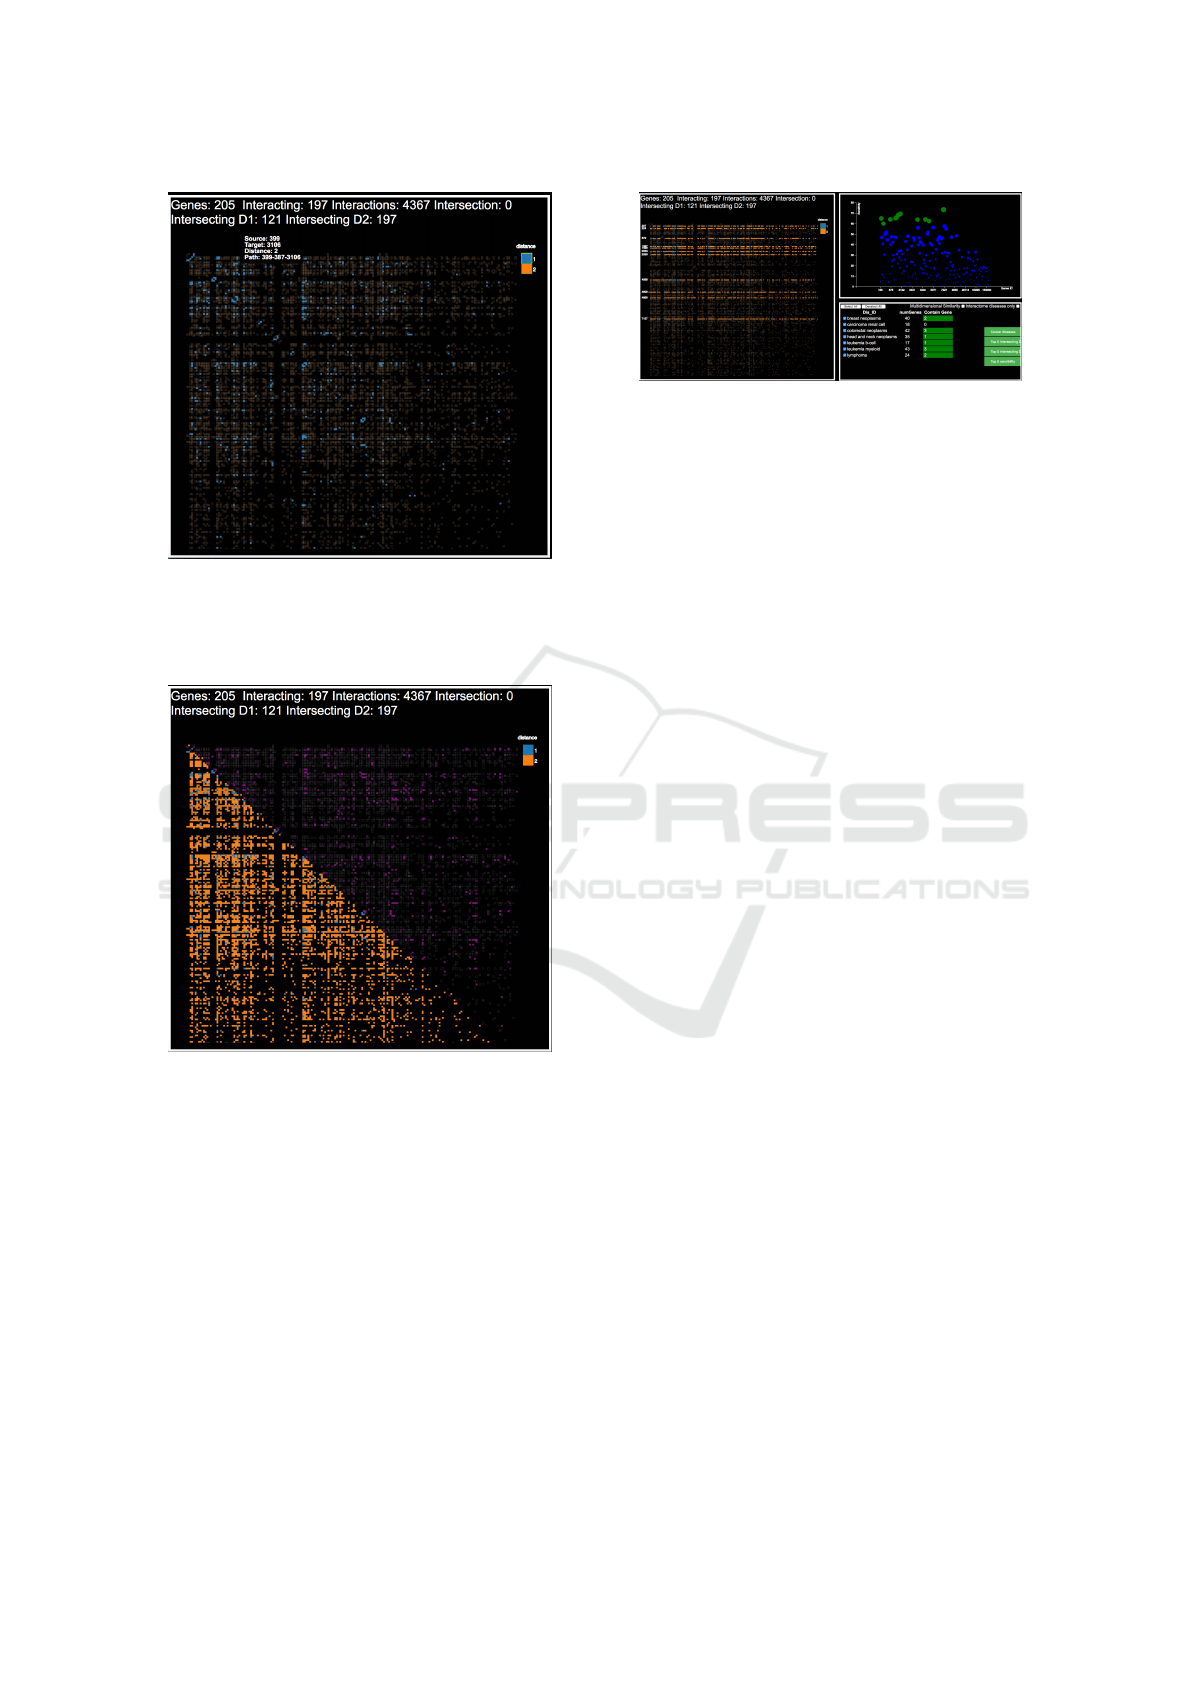
Figure 5: The figure shows a detail of the Interactions ma-
trix pane. The analyst has selected to show only direct inter-
actions, producing a visualization that shows different den-
sities of direct interactions, higher in the top-left part. An
informative tooltip shows, on demand, detailed information.
Figure 6: Having selected the multidimensional similarity
check-box, the analyst is presented with the view in fig-
ure. The inferior triangular matrix represents the interac-
tions among genes, while the superior triangular matrix rep-
resents their similarity (w.r.t., the number of diseases that
are associated with both of them). The analyst can spot
similarity between interactions, and check whether genes
interact through the interactome and/or are similar.
sual environment called Genes scatter-plot pane that
relies on the classic scatter-plot visual paradigm to
represent other genes properties. The visual encod-
ing is the following: the x-axis is associated with the
ID of the genes (allowing to manage and identify the
genes available for analysis), the y-axis encodes the
genes sensitivity, the size encodes the genes degree,
and a color-coding is used to communicate the pres-
ence or not of the gene in the current selected set of
Figure 7: The figure shows an example of selection of in-
teresting part of the interactome. The analyst selects all the
gens with an high sensitivity (represented in green) by click-
ing them, and obtain the subselection of the Interactions
matrix with all the genes interacting with the selected ones.
Additionally, the Diseases Analysis pane reports in green
the part of the selected genes that belong to each disease.
diseases. The sensitivity of a gene is a derived charac-
teristic and represents the weight that a gene has in a
disease, in terms of all the genes associated with that
disease. As an example, let assume that we are focus-
ing on genes G1 and G2, and considering a set of only
2 diseases (d1 and d2), with their modules expressed
in the form:
• d
1
= [c
(1,1)
G1,c
(2,1)
G2,c
(3,1)
G3,c
(4,1)
G4,c
(5,1)
G5]
• d
2
= [c
(1,2)
G1,c
(9,2)
G9]
Assuming c
(i, j)
= 1/|d
j
|:
• sensitivity
d1
(G1) = 1/5 = 20%
• sensitivity
d2
(G1) = 1/2 = 50%
Mouse-hovering on a gene allows the analyst to
inspect a tooltip presenting additional characteristics
of the gene, like its ID and degree, the percentage of
diseases in which it appears (out of all the 70 classi-
fied diseases), and the diseases to which it belongs to.
Additionally, the mouse-hover will highlight in the In-
teractions matrix pane the row of all the genes that in-
teract with the selected one and in the Diseases Anal-
ysis pane all the diseases it belongs to. The analyst
can even lock this gene by clicking on it, effectively
allowing to select a subset of genes and resulting ma-
trix rows to be inspected. This interaction allows for
selecting additional sub-areas of interest in the matrix,
by leading the analyst choosing either genes with high
sensitivity (and/or percentage,degree) or by selecting
genes belonging to specific diseases (highlighted in
the Diseases analysis pane). Figure 7 presents an ex-
ample of this behavior.
4.4 Workflow
The NEMESIS system provides the analyst with
several ways of conducting her analyses: choosing
the starting point considering the genes interactions
NEMESIS (NEtwork MEdicine analySIS): Towards Visual Exploration of Network Medicine Data
327

Figure 8: The figure shows the selection of the first
biomarker (top 5 intersecting D1); the cardinality of inter-
actions to consider is strongly reduced to 384, showing evi-
dent regular patterns of interaction among genes.
overview, or starting from the set of diseases to fo-
cus the analysis on, or starting from specific genes
characteristics and identifying the set of diseases that
have them in common. Independently from the start-
ing point of analysis, the available interaction means
and the interconnection among the 3 visual panes al-
low the analyst to progressively refine the analysis
results, identifying specific areas of interest and pro-
jecting them in the other panes to focus on different
dimensions. The result is a fast way to reduce the
cardinality of elements to consider facilitating the de-
cision on where to lead the analysis next. Finally, the
capability to relate the state of the analysis with the
multidimensional similarity, expand the analysis to-
wards the parts of the interactome not directly con-
nected to the considered diseases, allowing the ana-
lyst to conduct the analysis beyond initial hypothesis
and to better understand the characteristics of the un-
derlying models and to formulate/validate hypothesis.
4.5 Analytics
The actual version of NEMESIS encompasses several
analytics that support the exploration activities:
Off line analytics. We have computed useful de-
rived data that is available during the explorative anal-
ysis. As an example, in order to create relevant
analysis entry points on diseases, we have precom-
puted all the top 5 diseases (more than 12 millions
of combinations, two months of running time on a
server with 32 cores and 96 GB of ram) in order to
select those that maximize relevant objective func-
tions, like those that maximize the number of shared
genes, or those that maximize the average sensitiv-
ity of the associated genes. Moreover we have pre-
computed interactome paths of increasing length to
quickly switch between direct and indirect interac-
tions. We are currently computing summary infor-
mation associated with such paths, information that
comes from other “networks”, e.g., we have precom-
puted for each pair of genes connected by a path on
the interactome the number of shared diseases (used
to drive the actual NEMESIS multidimensional sim-
ilarity analysis). Summary information coming from
multiple networks can be combined to produce mul-
tidimensional information that feeds the aggregation
functions depicted on Figure 6.
On line analytics. While the user is exploring the
data, it is possible to derive information starting from
the current selection, like gene sensitivity, or expand-
ing the set of genes associated with a selected disease
with all genes reachable through the interactome, us-
ing paths of length one and two.
5 CONCLUSION & FUTURE
WORK
NEMESIS has been informally evaluated both during
its development and during two meetings with medi-
cal personnel coming from the oncology department
of Sapienza Medical School and specialists in the net-
work medicine fields. The prototype has been well re-
ceived and the support to exploratory analysis in par-
ticular has been found very useful for identifying ar-
eas of uncertainty in the interactome and or hypothe-
sizing possible interactions between genes and/or be-
tween disease modules. Suggestions for integrating
clinical images related to particular diseases and capa-
bility to annotate and share analysis results have been
made and we are considering their implementation in
the next version.
In conclusion this paper presented NEMESIS, a
novel visual analytics solution aiming at fostering the
interactive visual exploration of the complex network
medicine data. The proposed solution provides means
for interactively exploring different facets of the com-
plex body of data, inspecting both the data associ-
ated to topological properties of a single network and
summary multidimensional information coming from
other relevant networks. The summary information
relies on several off line analytics. The prototype has
been informally evaluated with oncology doctors, get-
ting positive feedback on the used visualizations and
high interest for the explorative visual analytics ap-
proach that has been perceived as a novelty in the
field. Concerning short term future work we are cur-
rently working on the usability of the system and in-
corporating the suggestions raised during the informal
evaluation. As a more ambitious objective we are de-
signing and experimenting more comprehensive defi-
nition of similarity with the goal of producing a more
informative and useful summary overview, combining
the information coming from a larger set of relevant
networks. Moreover, being the actual implementation
IVAPP 2019 - 10th International Conference on Information Visualization Theory and Applications
328

based on several off line analytics we are studying
how to modify the analytical workflow adopting the
solutions coming from the emerging field of Progres-
sive Visual Analytics (see, e.g., (Schulz et al., 2016)).
REFERENCES
Basole, R. C., Braunstein, M. L., Kumar, V., Park, H.,
Kahng, M., Chau, D. H. P., Tamersoy, A., Hirsh,
D. A., Serban, N., Bost, J., Lesnick, B., Schissel,
B. L., and Thompson, M. (2015). Understanding
variations in pediatric asthma care processes in the
emergency department using visual analytics. Jour-
nal of the American Medical Informatics Association,
22(2):318–323.
Berger, P., Chegini, M., Schumann, H., and Tominski, C.
(2008). Integrated visualization of structure and at-
tribute similarity of multivariate graphs.
Bottomly, D., McWeeney, S. K., and Wilmot, B. (2016).
Hitwalker2: visual analytics for precision medicine
and beyond. Bioinformatics, 32(8):1253–1255.
Cerami, E., Demir, E., Schultz, N., Taylor, B. S., and
Sander, C. (2010). Automated network analysis
identifies core pathways in glioblastoma. PloS one,
5(2):e8918.
Chan, S. Y. and Loscalzo, J. (2012). The emerging
paradigm of network medicine in the study of human
disease. Circulation research, 111(3):359–374.
Chaurasia, G., Malhotra, S., Russ, J., Schnoegl, S., Hnig,
C., Wanker, E. E., and Futschik, M. E. (2009). Unihi
4: new tools for query, analysis and visualization of
the human proteinprotein interactome. Nucleic Acids
Research, 37(suppl1):D657–D660.
Chittaro, L. (2001). Information visualization and its appli-
cation to medicine. Artificial intelligence in medicine,
22(2):81–88.
Dietzsch, J., Heinrich, J., Nieselt, K., and Bartz, D. (2009).
Spray: A visual analytics approach for gene expres-
sion data. In 2009 IEEE Symposium on Visual Analyt-
ics Science and Technology, pages 179–186.
Gerasch, A., Faber, D., K
¨
untzer, J., Niermann, P.,
Kohlbacher, O., Lenhof, H.-P., and Kaufmann, M.
(2014). Bina: a visual analytics tool for biological
network data. PloS one, 9(2):e87397.
Ghoniem, M., Fekete, J.-D., and Castagliola, P. (2004). A
comparison of the readability of graphs using node-
link and matrix-based representations. In INFOVIS
2004. IEEE Symposium on, pages 17–24. Ieee.
Gladilin, E. (2017). Graph-theoretical model of global
human interactome reveals enhanced long-range
communicability in cancer networks. PloS one,
12(1):e0170953.
Gustafsson, M., Nestor, C. E., Zhang, H., Barab
´
asi, A.-
L., Baranzini, S., Brunak, S., Chung, K. F., Federoff,
H. J., Gavin, A.-C., Meehan, R. R., et al. (2014). Mod-
ules, networks and systems medicine for understand-
ing disease and aiding diagnosis. Genome medicine,
6(10):82.
Huan, T., Sivachenko, A. Y., Harrison, S. H., and Chen, J. Y.
(2008). Proteolens: a visual analytic tool for multi-
scale database-driven biological network data mining.
BMC Bioinformatics, 9(9):S5.
Khler, S., Bauer, S., Horn, D., and Robinson, P. N. (2008).
Walking the interactome for prioritization of candi-
date disease genes. The American Journal of Human
Genetics, 82(4):949 – 958.
Korcsmaros, T., Schneider, M. V., and Superti-Furga, G.
(2017). Next generation of network medicine: inter-
disciplinary signaling approaches. Integrative Biol-
ogy, 9(2):97–108.
Lu, H., Zhu, X., Liu, H., Skogerb, G., Zhang, J., Zhang, Y.,
Cai, L., Zhao, Y., Sun, S., Xu, J., Bu, D., and Chen, R.
(2004). The interactome as a treean attempt to visu-
alize the proteinprotein interaction network in yeast.
Nucleic Acids Research, 32(16):4804–4811.
Merico, D., Isserlin, R., Stueker, O., Emili, A., and Bader,
G. D. (2010). Enrichment map: a network-based
method for gene-set enrichment visualization and in-
terpretation. PloS one, 5(11):e13984.
Mlecnik, B., Scheideler, M., Hackl, H., Hartler, J., Sanchez-
Cabo, F., and Trajanoski, Z. (2005). Pathwayexplorer:
web service for visualizing high-throughput expres-
sion data on biological pathways. Nucleic Acids Re-
search, 33(suppl2):W633–W637.
Perer, A. and Sun, J. (2012). Matrixflow: temporal net-
work visual analytics to track symptom evolution dur-
ing disease progression. In AMIA annual symposium
proceedings, volume 2012, page 716. American Med-
ical Informatics Association.
Schulz, H.-J., Angelini, M., Santucci, G., and Schumann,
H. (2016). An enhanced visualization process model
for incremental visualization. IEEE transactions
on visualization and computer graphics, 22(7):1830–
1842.
Sharma, A., Menche, J., Huang, C. C., Ort, T., Zhou, X.,
Kitsak, M., Sahni, N., Thibault, D., Voung, L., Guo,
F., et al. (2015). A disease module in the interactome
explains disease heterogeneity, drug response and cap-
tures novel pathways and genes in asthma. Human
molecular genetics, 24(11):3005–3020.
Shneiderman, B., Plaisant, C., and Hesse, B. W. (2013).
Improving healthcare with interactive visualization.
Computer, 46(5):58–66.
Smoot, M. E., Ono, K., Ruscheinski, J., Wang, P.-L., and
Ideker, T. (2011). Cytoscape 2.8: new features for data
integration and network visualization. Bioinformatics,
27(3):431–432.
Tripathi, S., Dehmer, M., and Emmert-Streib, F. (2014).
Netbiov: an r package for visualizing large net-
work data in biology and medicine. Bioinformatics,
30(19):2834–2836.
Vidal, M., Cusick, M., and Barabsi, A.-L. (2011). Interac-
tome networks and human disease. Cell, 144(6):986 –
998.
Wang, T. D., Wongsuphasawat, K., Plaisant, C., and Shnei-
derman, B. (2011). Extracting insights from electronic
health records: Case studies, a visual analytics process
model, and design recommendations. Journal of Med-
ical Systems, 35(5):1135–1152.
NEMESIS (NEtwork MEdicine analySIS): Towards Visual Exploration of Network Medicine Data
329
