
Evaluation of a Virtual Reality System for Ship Handling Simulations
Chiara Bassano
1
, Manuela Chessa
1
, Luca Fengone
2
Luca Isgr
`
o
2
, Fabio Solari
1
,
Giovanni Spallarossa
2
, Davide Tozzi
2
and Aldo Zini
2
1
University of Genoa, Dept. of Informatics, Bioengineering, Robotics, and Systems Engineering, Italy
2
CETENA S.p.A., Italy
{luca.fengone, luca.isgro, giovanni.spallarossa, davide.tozzi, aldo.zini}@cetena.it
Keywords:
Sense of Presence, Immersivity, Cybersickness, User Experience, Navigation Performance, Ship Simulator,
Task Performance.
Abstract:
The assessment of virtual reality ship handling simulators is extremely important to guide the research in the
field, since the prolonged use can affect both the performance and the experience of users. Here, we evaluate
a ship simulator based on two different visualization setups: a non-immersive system based on standard moni-
tors, and an immersive system that uses a virtual reality head mounted display. We did an experimental session
of manoeuvring tasks performed by 20 volunteers, specifically students of a naval academy. To evaluate the
system, we analyzed three different aspects: performances, level of cybersickness and sense of presence. The
results show that: (i) expert users are able to follow the predefined path in a quite accurate manner; (ii) both
systems do not introduce anxiety, stress or particular undesired effects, and the use of immersive virtual reality
itself does not explain the increase of user malaise state; (iii) immersive virtual reality systems allow users to
feel more involved and present in the simulation scenario.
1 INTRODUCTION
Ship handling simulators have always taken advan-
tages from computer-based environments represen-
ting a replica of the real world, in which the ship is
operating. Such a kind of systems can be used for
both design assessment and for training purposes (Va-
rela et al., 2015; Varela and Soares, 2015; Benedict
et al., 2014). New technologies and, in particular, im-
mersive virtual reality (VR) head mounted displays
(HMDs) give the users the possibility of interacting in
synthetic environments for more realistic experiences,
which are a key aspect in the context of the Industry
4.0 and of the factories of the future.
The goal of the current study is the assessment of
a new VR technological system for ship handling si-
mulation, developed in the context of the project MIT
- Leadership Tecnologica
1
: the prolonged use of this
type of systems might produce on users different ne-
gative effects related both to a decrease of performan-
ces and an increase of sickness. The considered ship
handling simulator is a simulation framework desig-
1
The involved partners are the Company Cetena S.p.A.
and the Department DIBRIS of the University of Genoa,
Italy
ned with different targets on mind: training, virtual
prototyping and virtual test bed. Major strengths of
the framework are the high detailed real-time physi-
cal behavior reproduction of any type of ships (from
small boat to big ships) and a powerful visualization
system using up to date gaming technologies for the
best cost effective virtual reality environment availa-
ble nowadays.
In this article, we present the results of the asses-
sment of the described ship handling simulator: we
carried out an experimental session lead on students
of the Genoa naval academy, by testing how the ope-
rator can feel using different types of immersive expe-
rience during navigation activities. In particular, the
aim of this work is the evaluation and comparison of
different technological solutions and techniques for
the implementation of an interactive virtual reality sy-
stem: on the one hand, a traditional simulation sy-
stem, composed of a monitor for visualization; on the
other hand, a virtual reality system constituted by a
HMD for VR (the Oculus Rift). Interaction is done
through the physical reproduction of a ship command
panel, which, in the first case, is completely visible to
the user, while, in the second case, has to be substitu-
ted by a schematic virtual representation in the virtual
62
Bassano, C., Chessa, M., Fengone, L., Isgrò, L., Solari, F., Spallarossa, G., Tozzi, D. and Zini, A.
Evaluation of a Virtual Reality System for Ship Handling Simulations.
DOI: 10.5220/0007578900620073
In Proceedings of the 14th International Joint Conference on Computer Vision, Imaging and Computer Graphics Theory and Applications (VISIGRAPP 2019), pages 62-73
ISBN: 978-989-758-354-4
Copyright
c
2019 by SCITEPRESS – Science and Technology Publications, Lda. All rights reserved

environment and synchronized with it.
The paper is organized as follows: in Section 2
we briefly discuss the state of the art, in the field of
VR based simulation; in Section 3 we describe some
technical aspects of the considered setups and the ex-
perimental procedure we have followed. In Section
4 we present and discuss the obtained results, and in
Section 5 we conclude and discuss the further deve-
lopments and implication of our research.
2 STATE OF ART
In this Section, we will discuss the state-of-the art
concerning the main factors analyzed in the paper: cy-
bersickness and sense of presence.
In the last decade, virtual reality has had a wi-
despread success, especially after the release of cost
effective devices, such as the Oculus Rift, the Play-
station VR and the HTC Vive. The domains of ap-
plication are disparate but one of the most important
still remains training and education. However, cyber-
sickness, defined as a state of malaise and unpleasant
side effects associated to use of immersive simulati-
ons, is still a common problem, affecting 60-80 %
of the users, and it is a potential issue for the broa-
der adoption of these technologies, although its mi-
nor, short term health risk (Nesbitt et al., 2017). Ty-
pically cybersickness varies between individuals but
common symptoms are nausea, eyestrain, dizziness,
apathy, sleepiness, disorientation, fatigue and general
discomfort. It can occur immediately after training or
even up to 5-12 hours later (Munafo et al., 2017; Kim
et al., 2005). It is also worth noting that this state of
malaise can also cause cognitive impairment and ne-
gatively affect user’s performance while accomplis-
hing a task (Nesbitt et al., 2017).
Causes of cybersickness are still over debate, but
three prominent theories are: poison theory (Bou-
chard et al., 2011), postural instability theory (Ric-
cio and Stoffregen, 1991) and sensory conflict the-
ory (Reason and Brand, 1975)). In particular, the
latter thesis suggests that the mismatch of vestibu-
lar and visual sensory systems could cause sickness,
due to the absence of inertial displacement and
could explain why higher Visually Induced Motion
Sickness(VIMS) levels were reported in passive ex-
ploration compared to active exploration of virtual en-
vironment (Sharples et al., 2008).
Factors influencing cybersickness include indivi-
dual, device and task differences (McGill et al., 2017;
Nesbitt et al., 2017; Davis et al., 2015; Davis et al.,
2014).
Cybersickness can be quantify using both sub-
jective and objective measures, which were listed by
(Keshavarz and Hecht, 2011; Nesbitt et al., 2017).
Subjective scales of evaluation include susceptibility
questionnaires (Motion Sickness Susceptibility Ques-
tionnaire (Gianaros et al., 2001), Reason and Brands
Motion Sickness Susceptibility Questionnaire (Rea-
son and Brand, 1975)), online reports, usually com-
posed by a symptom or question that participants are
asked to rate multiple time during the simulation in
order to detect runtime onset, course, severity and
trend of VIMS (Fast MS Scale (Keshavarz and Hecht,
2011), Misery Scale Index (Bos et al., 2010), Short
Symptom Checklist (Nichols et al., 1997)) and stan-
dard questionnaires usually filled in before and after
the trial, where user is asked to rate the severity le-
vel of different symptoms (Simulator Sickness Ques-
tionnaire (Kennedy et al., 1993), Motion Sickness As-
sessment Questionnaire (Gianaros et al., 2001), Pen-
sacola Motion Sickness Questionnaire (Lawson and
Mead, 1998), Nausea Profile(Muth et al., 1996)). Ob-
jective measures, instead, include physiological me-
asurements, some of which have been proven to be
correlated with VIMS (Davis et al., 2015). (Nalivaiko
et al., 2015) studied the effect of motion sickness
on thermoregulation, using provocative visual stimuli
(immersion into the virtual reality simulating rides
on a rollercoaster). They found out that, during im-
mersion, there is an initial phase of vasoconstriction,
due to a defense response associated with arousing ef-
fects of the simulated ride, followed by a vasodilation,
related to cybersickness. Vasodilatation causes heat
loss through sweating, an increase of skin conduc-
tance, skin warming and tachycardia, which is rela-
ted to the activity of the sympathetic nervous system,
as a defensive reaction against the sensation of nau-
sea (Ohyama et al., 2007). An other study conducted
by (Kim et al., 2005) demonstrated a significant posi-
tive correlation of cybersickness severity with gastric
tachyarrhythmia, increase of eyeblink rate and EEG
delta wave and decrease of heart period. Finally, also
analysis of sway and center of pressure (COP) could
be informative (Munafo et al., 2017; Aldaba et al.,
2017). In fact body sway differs between participants
who report motion sickness and those who do not.
Another important aspect to be considered is sense
of presence or spatial presence, which is defined
as the psychological state where virtual experiences
and computer-generated environments feel authentic
rather than the actual physical locale, or, in other
words, the sense of ”being physically there” (Sheri-
dan, 1992). Unlike immersion, which depends es-
sentially on the type of technology used and can be
objectively described, sense of presence is primarily
subjective and is linked to the user experience. In
Evaluation of a Virtual Reality System for Ship Handling Simulations
63

particular, some theories asses that spatial presence
is determined by how efficiently we mentally process
the spatial relations within the environment (Wirth
et al., 2007). So, persons able to process spatial ar-
rangements effectively will find it easier to create a
”mental model” of the spatial environment, thus they
will experience a higher sense of presence. Authors in
(Coxon et al., 2016) proved that self-reports of ima-
gery are positively correlated with reports of spatial
presence, but spatial presence itself is not related to
performance.
Although, its subjective nature, however, other
factors influence spatial presence (Usoh et al., 2000):
the degree of interaction user has with the virtual en-
vironment, as the presence of the player in the vir-
tual world implicitly implies his ability to act in it
and interact with it; the proper implementation of an
action-effect loop; the high resolution of information
displayed, in a manner that it does not indicate the
existence of the display; the consistency of the dis-
played information across different sensory modali-
ties; the presence of a first person avatar, as a self-
representation of the user in the virtual world, which
should be similar in appearance or functionality to the
individuals body.
Standard questionnaire commonly used to mea-
sure sense of presence are the IGroup Presence Ques-
tionnaire (Regenbrecht and Schubert, 2002), the Pre-
sence Questionnaire (Witmer and Singer, 1998) and
the Slater, Usoh and Steed (SUS) Questionnaire (Sla-
ter et al., 1998; Usoh et al., 1999).
3 MATERIAL AND METHODS
Here, we describe how the software application has
been designed, the two different hardware solutions
taken into account and the parameters defined in order
to evaluate the two different setups.
3.1 Software
The simulation system is conceived as a gamification
of a ship handling experience. Gamification is a pro-
cess consisting in the introduction of techniques, met-
hods and strategies typical of entertainment world in
educational contexts, which, otherwise, would be de-
ficient in induced interactivity. This way, users are
encouraged to familiarize with a new experience by-
passing the specific physical interface and constraints,
due to a lack of knowledge or experience.
When the application starts, both with the monitor
and the VR setup, participant finds himself on a boat
(a) (b) (c)
Figure 1: (a) Scenario of the simulation. (b) Ellipse and (c)
Eight paths.
offshore, some kilometers far from the coast. Scena-
rio, shown in Figure 1a, is inspired to actually exis-
ting coastal areas, a surface of about 50 km x 50 km
around Genoa harbour, taken from a 3D graphics da-
tabase. Rendering is not detailed in order to avoid to
distract the user with an excess of visual information,
while maintaining a good level of involvement, deter-
mined by the recognition of familiar scenes.
User has to steer the ship following one of the pre-
defined paths: the Ellipse and the Eight path (see Fi-
gure 1b-c). The Ellipse path is the simplest one, in
fact it is composed of two curves and two long linear
parts. The Eight path, instead, is more complex be-
cause of the frequent changes in direction. This im-
plies a greater freedom of movement and a higher pro-
bability of losing the original route. Moreover, parti-
cipants are required to have a better spatial mapping
and control over the ship, being aware of its turning
rate, i.e. time and space required to veer.
The path is fixed and visible to the user as a route
just above the sea. Moreover, in order to improve spa-
tial awareness and spatial mapping, a canvas showing
the path with directional arrow and user tracked posi-
tion is shown on the top lateral portion of the display.
Weather conditions are an additional feature of the
system: in fact, in the Eight path simulation, sea is
calm and plain, while in the elliptic path simulation,
sea is more rough, in order to counterbalance the sim-
plicity of the route.
Finally, participants have to accomplish the task
with two different ships: a patrol boat and a coast-
guard, afterwards referred to as fast and slow boat,
respectively. The patrol boat is a small light vessel
(15 m long and 20 t of weight), that can reach 50 n
of speed. The coastguard, instead, is a larger ship (20
m long and 50 t of weight) that can reach a maximum
speed of 20 n. The aesthetics and the operating me-
chanisms of these two ships have been modeled and
implemented as faithfully as possible.
HUCAPP 2019 - 3rd International Conference on Human Computer Interaction Theory and Applications
64

3.2 Hardware
Two different setups have been designed and imple-
mented: a traditional simulation non-immersive vir-
tual reality system, based on 3 standard monitors, and
an immersive VR system, based on a HMD. In both
cases, interaction is done through the physical repro-
duction of a ship command panel, so people can drive
ships rolling a real rudder and moving the accelerator
knobs, one for the right engine and one for the left
engine. In the first case, the command panel is com-
pletely visible to the user, while, in the second case, it
has to be substituted by a schematic representation in
the virtual environment, a slider showing rudder rota-
tion, and synchronized with it.
In the monitor setup, three 27 inch monitors are
disposed vertically side by side, in order to mimic
the view from the ship command bridge. The user
is required to wear a safety helmet, with a HTC Vive
tracker attached on it, for the purpose of tracking his
position and rotation. In the VR setup, instead, moni-
tors are substituted with a HMD, the Oculus Rift. In
this case, there is no need for external tracking, as the
Oculus provides its own tracking system.
3.3 Parameters
As the goal of our work is evaluating the two diffe-
rent visualization solutions, we defined and measured
different parameters considering three main aspects:
participant performance; cybersickness and comfort
in general; sense of presence.
Performance. Performance is considered as the
ability of the user to follow the proposed paths, so
boat latitude and longitude are recorded during the ex-
perimental session.
Cybersickness and Comfort. Avoiding cyber-
sickness is a crucial point, as it can negatively affect
users performance or even generate repulsion towards
the system itself. For this reason we have decided
to quantify it by using both subjective valuations, i.e.
the Simulator Sickness Questionnaire (SSQ), and ob-
jective parameters, i.e. physiological measurements.
The SSQ is an instrument commonly used to quantify
this state of malaise. It is composed by 16 questi-
ons in a 4-points Likert scale evaluating three main
aspects: Nausea, Oculomotor disorders and Disorien-
tation. This questionnaire is usually submitted before
and after the exposure to a simulation system in order
to obtain a differential measure of induced discom-
fort.
Skin conductance, i.e. the continuous variations
of the electrical characteristics of the skin caused by
variations of the sweating, and heart rate are, instead,
physiological parameters strictly linked to the emoti-
onal and mental state of the user: variations of these
two parameters from the baseline could be a conse-
quence of stress, fatigue, excitement or cybersickness.
We decided to use the Mindfield eSense Skin Re-
sponse sensors, to measure skin conductance, and
Scosche Rhythm armband, for heart rate. The first
sensor is connected to a smartphone Galaxy S4 by
wire and uses a proprietary software to record and
send 5 samples/second, while the second sensor is
connected to the same phone via Bluetooth and ex-
ploits the BLE Heart Rate Monitor software in order
to memorize and send 1 sample/second.
Sense of Presence. In order to quantify sense of
presence we decided to use the Igroup Presence Que-
stionnaire (IPQ), which is one of the standard ques-
tionnaire currently available for measuring presence.
It is composed of 13 7-points Likert scale questions
evaluating three different aspects: the Spatial Pre-
sence, defined as the sense of being physically pre-
sent in the virtual environment; the Involvement, in-
tended both as attention during the interaction with
the virtual world and as perceived involvement; the
Experienced Realism, which measures the perceived
realism of the VR experience. An additional question
rates the sense of presence from the original definition
on (Slater et al., 1994).
Moreover, user rotation and position are recorded
during the test, in order to evaluate the tendency of
people to explore the surrounding environment and
interact with it in a natural way.
3.4 Procedure
In this work, we consider three different independent
variables: boat type, visualisaton modality and path
shape. Considering the two first variables we use a
repeated measure experimental design, as all partici-
pants accomplish the task both with the slow and fast
vessel with either the monitor and the HMD. While
considering the latter parameter, we adopt a between
group experimental design, half of the participant use
the Ellipse route and half the Eight one, in order to
understand the influence of the task on the choice of
the setup.
Experimental procedure has been defined after a
set of trial acquisitions, during which it has been no-
ticed that people could not accomplish the task when
they started with the immersive virtual reality simula-
tion. So the order of execution is fixed: participants
Evaluation of a Virtual Reality System for Ship Handling Simulations
65

start with the monitor simulation and the slow boat
(Monitor Slow), then the fast boat (Monitor Fast); af-
ter this, they wear the Oculus Rift and accomplish
the task in the immersive virtual environment with the
slow (HMD Slow) and fast (HMD Fast) vessel. Each
trial lasts 5 minutes.
A brief introductory tutorial phase precedes the
use of a new hardware setup. Guided by the expe-
rimenter, users start familiarizing with the interface
and visualization system and try driving the ship for 1
minute. In this phase, we do not acquire any data.
The procedure, therefore, is fixed and well defi-
ned. Prior to the experiment execution, the experi-
menter explains participant the modality and the pur-
pose of the test, the different tasks, the setup and the
instrumentation used. Then subjects have to sign a
written consent and the privacy policy. Participants
are told that they could interrupt the experiment whe-
never they wanted.
After this, they have to fill in an anonymous mo-
dule giving personal information, like their age, their
genre, if they have already participated in studies con-
cerning simulation and/or VR environments, if they
have ever used immersive virtual reality systems and
if they have ever driven a boat and which kind of boat.
Afterward, the experimenter attaches the different
sensors to the participant (Scosche Rhythm armband
and Mindfield eSense Skin Response sensors) and
give him an armband for the smartphone. Sensor
choice and position have been thought in order not
to interfere with participants movements or cause dis-
comfort, reducing sense of presence.
Next, participant is asked to fill in the first SSQ
(SSQ Pre) and, once finished, he accomplishes the
four tasks. After each trial, he has to complete a se-
parate SSQ, in order to monitor his state of malaise
from time to time.
Finally, volunteers are asked to fill in an IPQ for
each trial accomplished.
The experiment has a total duration of 45 minutes,
20 minutes of which for simulation.
3.5 Participants
Data recorded have been collected on a sample of 20
volunteer healthy male subjects aged between 20 and
24 years (21.8 ±1.1 years). They had normal or cor-
rected to normal vision. The majority of participants
were naive towards Virtual Reality (74 %), while 5
% had already took part to experiments involving VR
systems. All of them were expert boat drivers (see
Table 1), in fact they were students from the Genoa
naval academy, so they were familiar both with the
command panel and the task. On one side, we wanted
Table 1: Boats usually driven by participants.
Kind of boat Number of people
Fast smaller than 15 m 8
Fast longer than 15 m 2
Slow smaller than 40 m 3
Slow longer than 40 m 2
None 4
to evaluate the reaction of experts to specific stressors;
on the other hand, we wanted to understand their pr-
opensity to use VR technologies, which could be per-
ceived more as a game than a serious tool for learning.
4 RESULTS
In this section, we present results obtained from the
analysis of head rotations, trajectories and physiologi-
cal measurements (skin conductance and heart rate),
considered as quantitative parameters, and of the Si-
mulator Sickness and IGroup Presence Questionnaire,
referred to as qualitative parameters, as they highlight
users opinions and impressions. As stated before, par-
ticipants were expert boat drivers taught to be impas-
sible and not to move their head or body while dri-
ving. Data referred to head movements, though, are
not informative and have been excluded from further
analysis.
4.1 Analysis of Trajectories
The latitude and longitude of the virtual boat during
task execution have been recorded and organized ba-
sed on the ship velocity, the system used for simu-
lation and the path. In general, as shown in Figure
2, participants trajectories seems to be quiet accurate
and the original path shape is easily identifiable, es-
pecially concerning the Eight path data.
4.2 Skin Conductance
During the experimental session skin conductance
was recorded as a measure of change in participant
emotional state and well-being. Samples were analy-
zed firstly considering the kind of trial (Monitor Slow,
Monitor Fast, HMD Slow, HMD Fast) and secondly
taking into account both the kind of trial and the path
(Ellipse or Eight).
Results obtained from the first analysis are shown
in Figure 3. In the monitor case, in general, skin con-
ductance is stable and constant, even if slightly higher
in the trial with the faster ship, probably because of
the greater difficulty of the task; whereas in the HMD
case, it initially fast decreases and then settles around
HUCAPP 2019 - 3rd International Conference on Human Computer Interaction Theory and Applications
66
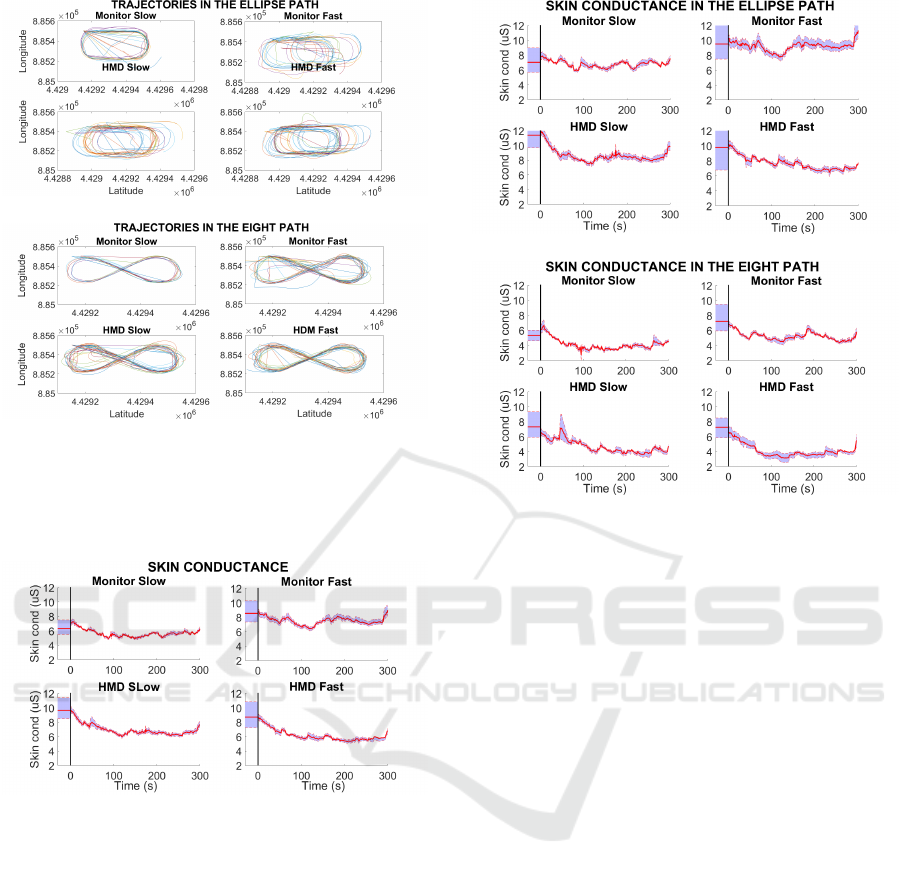
(a)
(b)
Figure 2: Trajectories of all participants who performed the
task with the Ellipse path (a) and Eight path (b). Results
are divided based on the simulator system used (monitor or
HMD) and boat velocity (slow and fast).
Figure 3: Average skin conductance based on the trial.
a stable value, similar to the one recorded during the
simulation with the monitor. This descending trend at
the beginning of the trial, can be associated to the fact
that the majority of subjects have never tried VR be-
fore, so they could be particularly anxious or excited
at first. However, when they realize that the task con-
sists in an activity they are used to, skin conductance
decreases.
Also the results obtained, considering the two
paths separately, confirm the trend highlighted above
(Figure 4). Moreover, skin conductance in the Moni-
tor Fast trial is in average the highest one in both ca-
ses, maybe because participants face for the first time
the fast task and still have little confidence with the
setup, hardware and software. This effect, however,
is attenuated in the following trials.
(a)
(b)
Figure 4: Average skin conductance considering the trial
and the path: Ellipse (a) or Eight (b).
4.3 Heart Rate
Heart rate is a physiological parameter strictly linked
to users’ emotional, mental and physical state, like
skin conductance. Heart rate was recorded during
each experimental session and samples were analy-
zed firstly considering the kind of trial and secondly
taking into account both the kind of trial and the path.
Figure 5 shows that heart rate is, in general, re-
gular and comparable in the four trials. Slightly hig-
her value in the fast trials, both with the monitor and
the HMD, are probably caused by the difficulty of the
task and can indicate a higher level of involvement.
So, both hardware systems do not introduce particular
emotional states that could compromise performances
and interfere with learning.
Also data organized accordingly to the path, con-
firm previous considerations. In particular, the ab-
sence of elevated heart rate values (around 100
beat/min) excludes the presence of cybersickness and
could indicate that participants have perceived the si-
mulations as natural experiences, comparable to real
life driving experiences.
4.4 Cybersickness Questionnaire
If physiological measurements can be considered ob-
jective quantitative parameters for the evaluation of
Evaluation of a Virtual Reality System for Ship Handling Simulations
67
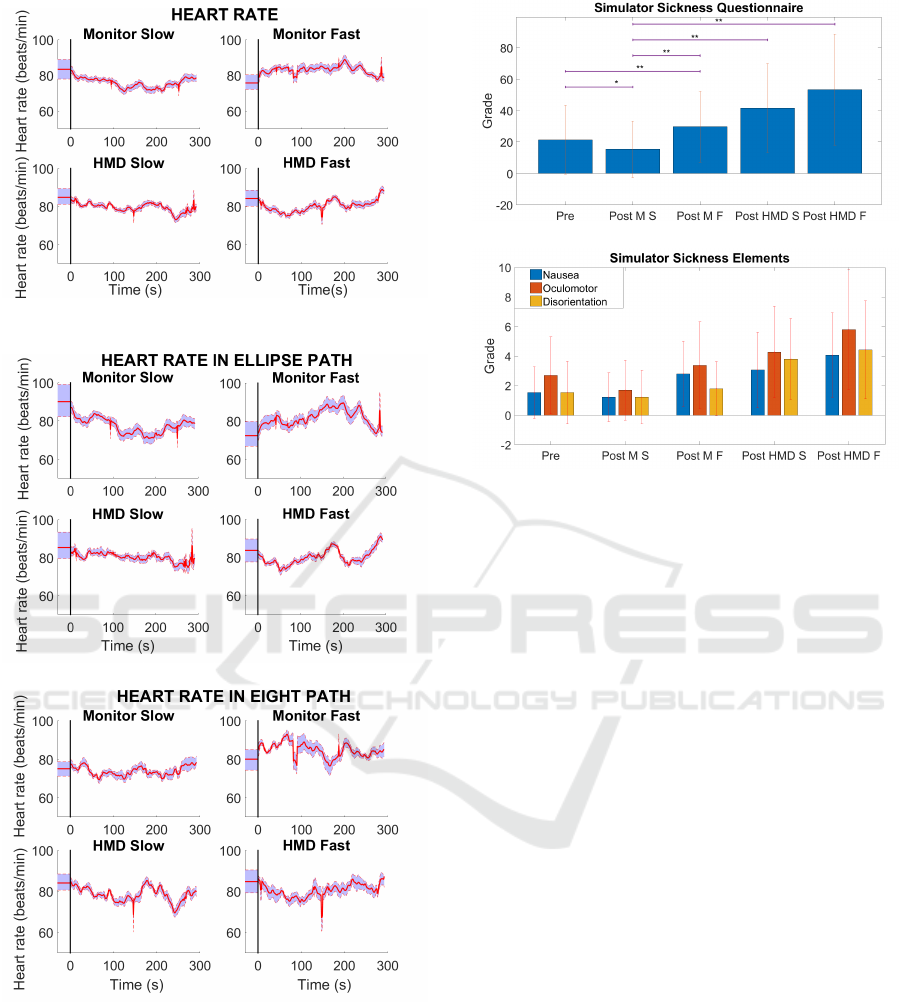
Figure 5: Average heart rate based on the trial.
(a)
(b)
Figure 6: Average heart rate considering the trial and the
path: Ellipse (a) or Eight (b).
the reaction of participants to different simulator sy-
stems, SSQ represents a more subjective and quali-
tative solution. Each participant submitted five que-
stionnaires, one at the beginning of the experimental
session and one after each trial. We collected answers
given by all the volunteer subjects and analyzed them,
firstly, considering the kind of trial and, secondly, ta-
(a)
(b)
Figure 7: SSQ results of the five questionnaires submitted.
(a) Total grade. (b) Results divided in the three subcatego-
ries of the SSQ (Nausea, Oculomotor and Disorientation).
M = monitor, HDM = head mounted display, S = slow, F =
fast. * p-value<0.05 e ** p-value<0.02.
king into account also the path.
Figure 7a shows an increase in the cybersickness
final values between consecutive trials. It is worth
noting, however, that trial had fix order of execution
(monitor first and HMD second), so the worst grade
in HMD trials could be due also to fatigue. We per-
formed a between group Wilcox test, in order to eva-
luate if the increment of cybersickness is statistically
significant. Figure 7a highlights that differences be-
tween results obtained in the Pre questionnaire and
in the two questionnaires referred to the monitor and
those referred to the Monitor Slow trial and all the fol-
lowing experiments are statistically significant. This
suggests that cybersickness can be caused either by
the hardware system and by the boat velocity.
If we consider separately the three major symp-
toms of cybersickness (Nausea, Oculomotor e Diso-
rientation), in general, they tend to increase during the
experimental session, in particular Oculomotor gra-
des, which is consistent with results found in the lite-
rature. Wilcox test performed between group, points
out that results obtained with the total grade can be
extended to the three subcategories (Table 2).
The analysis on SSQ questionnaire grades referred
to the Ellipse and Eight paths, shown in Figure 8, con-
firms results previously described. Cybersickness is
higher in the trial with elliptic path, probably because
HUCAPP 2019 - 3rd International Conference on Human Computer Interaction Theory and Applications
68
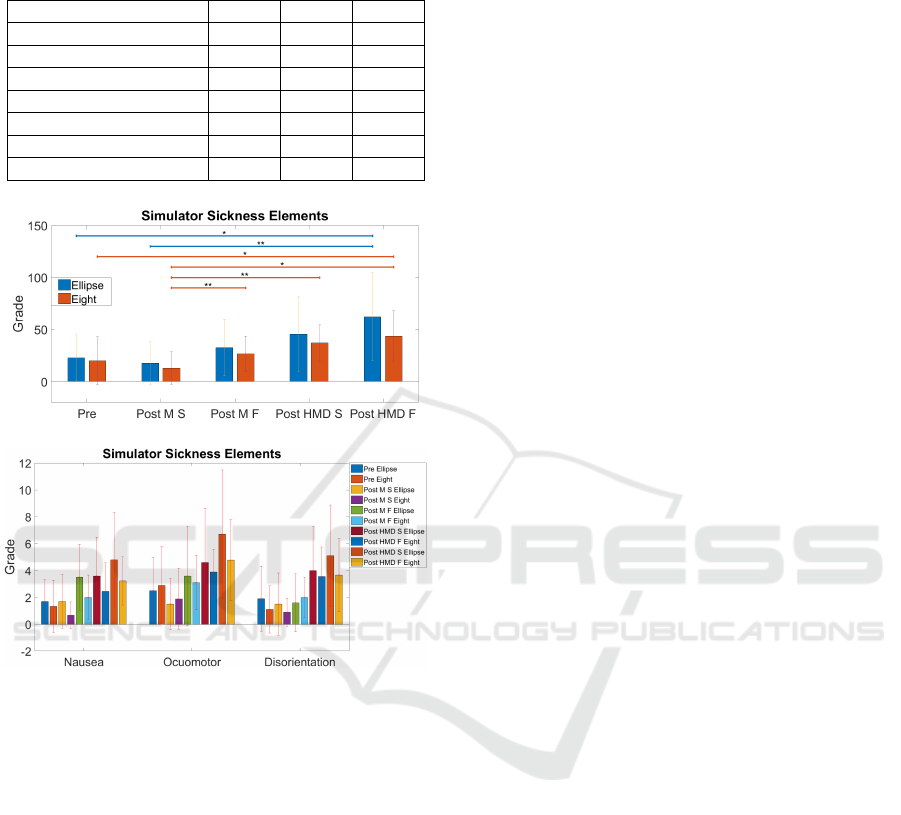
Table 2: P-value obtained making a between group Wilcox
test and comparing Nausea (N), Oculomotor (O) and Diso-
rientation (D) grades in the five questionnaires.
N O D
Pre-Post HMD S 0.0030
Pre-Post HMD F 0.0029 0.0119 0.0059
Post L S-Post M F 0.0111 0.0438
Post M S-Post HMD S 0.0123 0.0032 0.0004
Post M S-Post HMD F 0.0006 0.0009 0.0026
Post M F-Post HMD S 0.0147
Post M F-Post HMD F 0.0475 0.0124
(a)
(b)
Figure 8: SSQ results of the five questionnaires submitted
organized considering the path. (a) Total grade. (b) Results
divided in the three subcategory of the SSQ (Nausea, Ocu-
lomotor and Disorientation). M = monitor, HDM = head
mounted display, S = slow, F = fast. * p-value<0.05 e **
p-value<0.02.
the sea was more rough than in the simulation with the
Eight path. The worst sickness value, so, could de-
pend on a combined influence of sea conditions, kind
of hardware used (immersive or non-immersive) and
ship velocity. In other words, the use of the HMD al-
one does not explain the increase of malaise. For this
reasons further analysis are required.
A Wilcox test was performed in order to determine
the statistical significance of these results. In particu-
lar, in the between groups analysis the null hypothe-
sis was never rejected, while the within group analy-
sis revealed interesting correlations shown in Figure
8a. In the elliptic path case, the differences between
the total values of sickness in the Monitor Slow trial
and in the HMD Fast trial are statistically significant
(p<0.02), as the differences between the initial and
final total grades (p<0.05). While in the Eight path
case, only the results obtained in the first and final
questionnaire (p<0.05) and in the trial with the moni-
tor and the slow ship and the following tests are sta-
tistically significant(p<0.02). Therefore, in the first
case, the factors majorly influencing sickness seem to
be the boat velocity and the hardware used for simula-
tion, with the HMD negatively affecting participants
well-being. Whereas, in the second case, the velocity
of the boat plays a fundamental role: curved and irre-
gular trajectories and sudden direction changes, not-
withstanding, cause malaise more easily than regular
linear path.
These consideration are confirmed by the evalua-
tion of the three major symptoms of cybersickness.
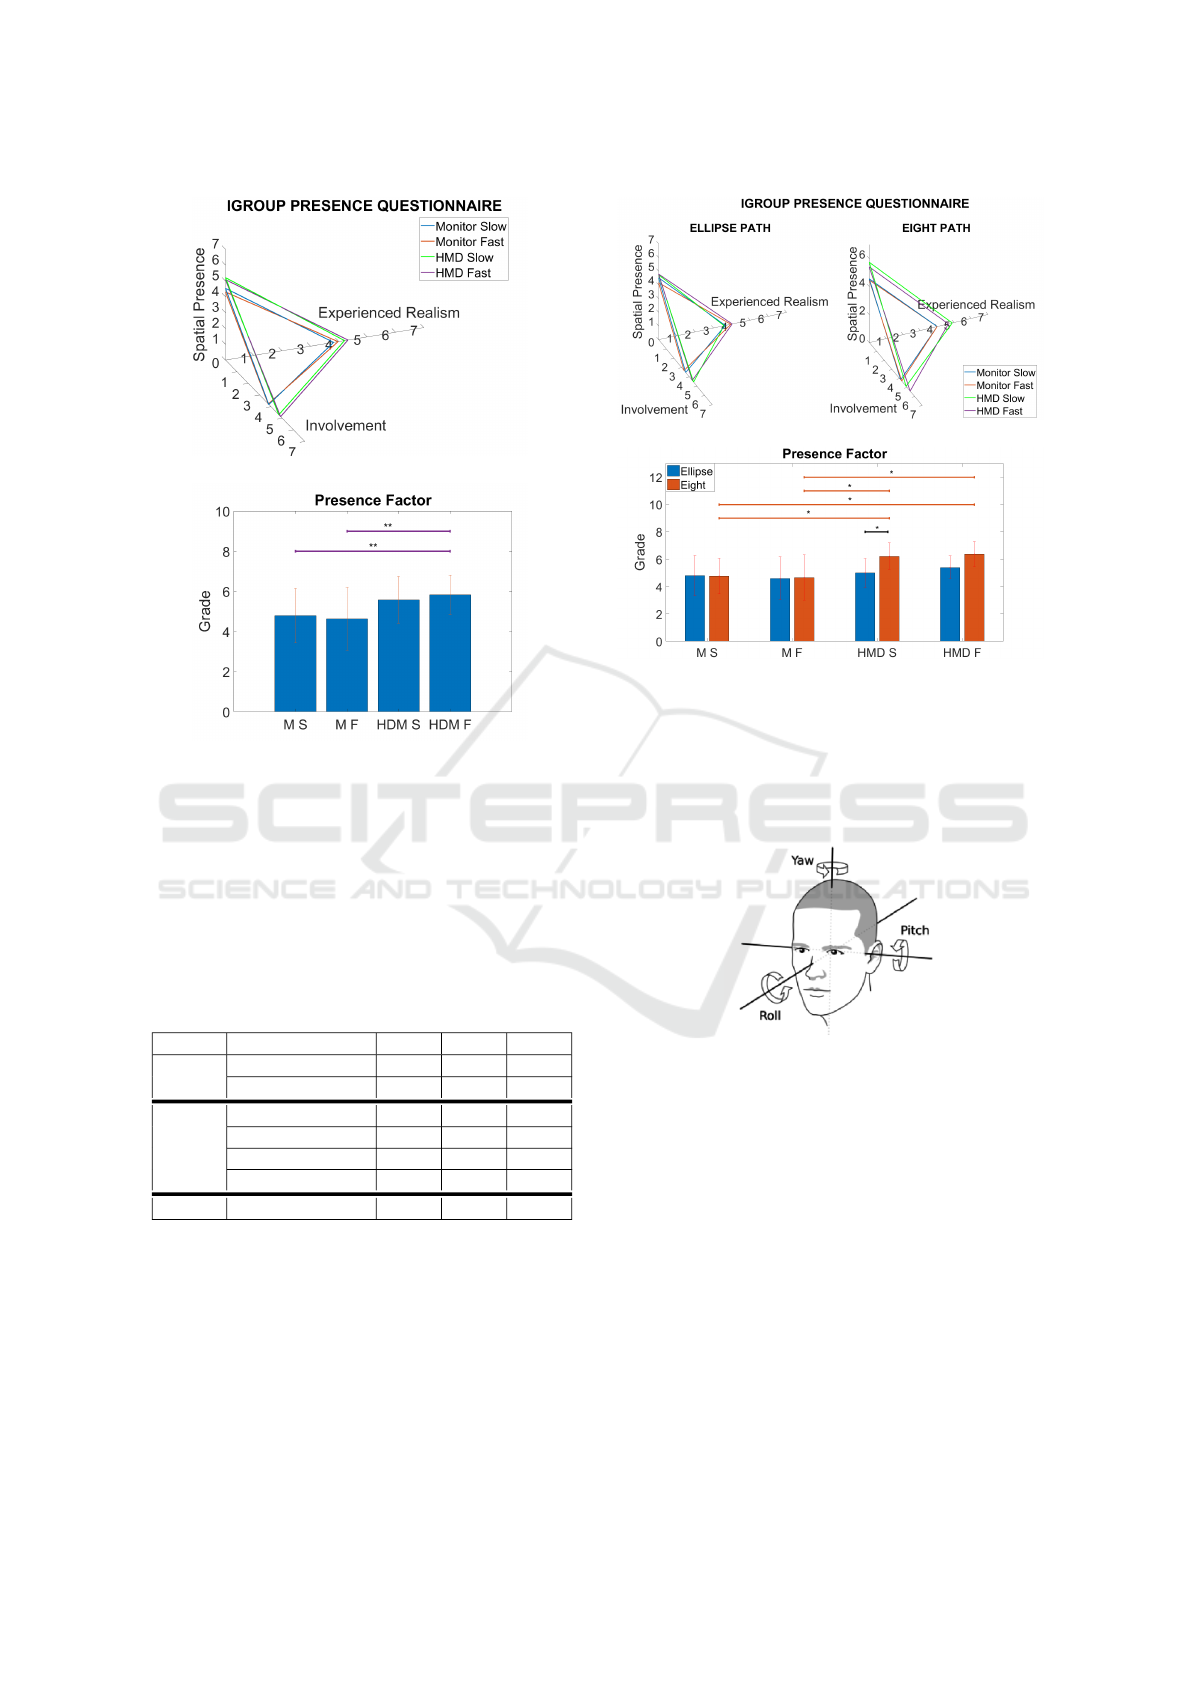
4.5 IGroup Presence Questionnaire
The IP Questionnaire is a subjective measure of the
sense of presence perceived by users. At the end of
the experimental session, participants were asked to
fill in four IPQs, one for each trial they had accom-
plished. Again data collected have been analyzed, fir-
stly, considering the kind of trial and, secondly, taking
into account also the path.
The rates given to the three subscales that com-
pose the questionnaire (Figure 9a) are better for the
HMD, indicating a higher sense of presence. Mo-
reover, the trials with the fast boat have less Spatial
Presence but greater Experienced Realism if compa-
red to the trials with the slow ship, maybe because of
the realism and response speed of the vessel to user’s
commands.
A between group Wilcox test was performed and
only the difference of Involvement and Spatial Pre-
sence parameters in the monitor and HMD trials has
been found to be statistically significant. This means
that the use of the Oculus Rift allows the user to feel
more involved and present in the virtual simulated en-
vironment.
If we consider the Presence Factor (Figure 9b),
trials with the HMD obtained better results and this
difference is statistically significant: in particular, the
average grade in the Monitor Slow and Fast trials with
the HMD Fast.
Figure 10a and Table 3 show results organized ba-
sed on the path shape. Differences between monitor
and HMD are more evident in the Eight case than in
the Ellipse case, where there is a clear distinction of
grades only for Involvements. In fact, in the ellip-
tic path only the difference between Monitor Fast and
HMD Slow and Fast for Involvement is statistically
significant (p<0.05). In the Eight path, instead, the
Evaluation of a Virtual Reality System for Ship Handling Simulations
69
(a)
(b)
Figure 9: IPQ results of the four questionnaires submitted
organized considering the trial. (a) Results divided based
on the three evaluation subscales. (b) Mean of grades of the
Presence Factor. M = monitor, HDM = head mounted dis-
play, S = slow, F = fast. * p-value<0.05 e ** p-value<0.02.
Table 3: P-value obtained making a within group Wilcox
test and comparing Spatial Presence (SP), Involvement (I)
and Experienced Realism (ER) grades in the four questi-
onnaires considering the two path separately (Ellipse and
Eight). Cross refers to the between group Wilcox test, made
comparing Ellipse path trials and Eight path trials.
SP I ER
Ellipse M F-HMD S 0.0254
M F-HMD F 0.0409
Eight M S-HMD S 0.0030
M S-HMD F 0.0427
M F-HMD S 0.0110
M F-HMD F 0.0472
Cross HMD S-HMD S 0.0178 0.0261
differences in Spatial Presence between monitor and
headset are statistically significant.
The Presence Factor shown in Figure 10b is bet-
ter with the HMD in both paths. This trend is more
evident in the Eight path case, were results are also
statistically significant. All these data confirm an ac-
tual increasing of sense of presence in VR.
(a)
(b)
Figure 10: IPQ results of the four questionnaires submitted
organized considering the trial and the path. (a) Results di-
vided based on the three evaluation subscales. (b) Mean of
grades of the Presence Factor. M = monitor, HDM = head
mounted display, S = slow, F = fast. * p-value<0.05 e **
p-value<0.02.
Figure 11: Head rotation angles schema: Yaw is the rota-
tion around the vertical axis (y), Pitch is the rotation around
lateral axis (x) and Roll is the rotation around the sagittal
axis (z). Axis are referred to Unity coordinates system.
4.6 Head Rotation Analysis
Head rotation angles (Figure 11) describe the ten-
dency of people to turn their head and explore the
scenario in order to collect information for task exe-
cution. It is worth noting, however, that this tendency
is subjective: people can be more or less prone to ex-
plore the virtual environment. So the following con-
siderations have a relative value.
We extracted head rotation angles and calculated
their histogram, in order to highlights users’ prefe-
rential head rotation angle and distribution across the
trial.
HUCAPP 2019 - 3rd International Conference on Human Computer Interaction Theory and Applications
70
(a)
(b)
Figure 12: Non normalized histograms of Pitch, Yaw and
Roll head rotation angles of participant 1 (a), who did the
trial with the Ellipse path, and participant 2, who did the
trial with the Eight path (b). Results are divided based on
the system used (monitor or HMD) and the boat velocity
(slow or fast).
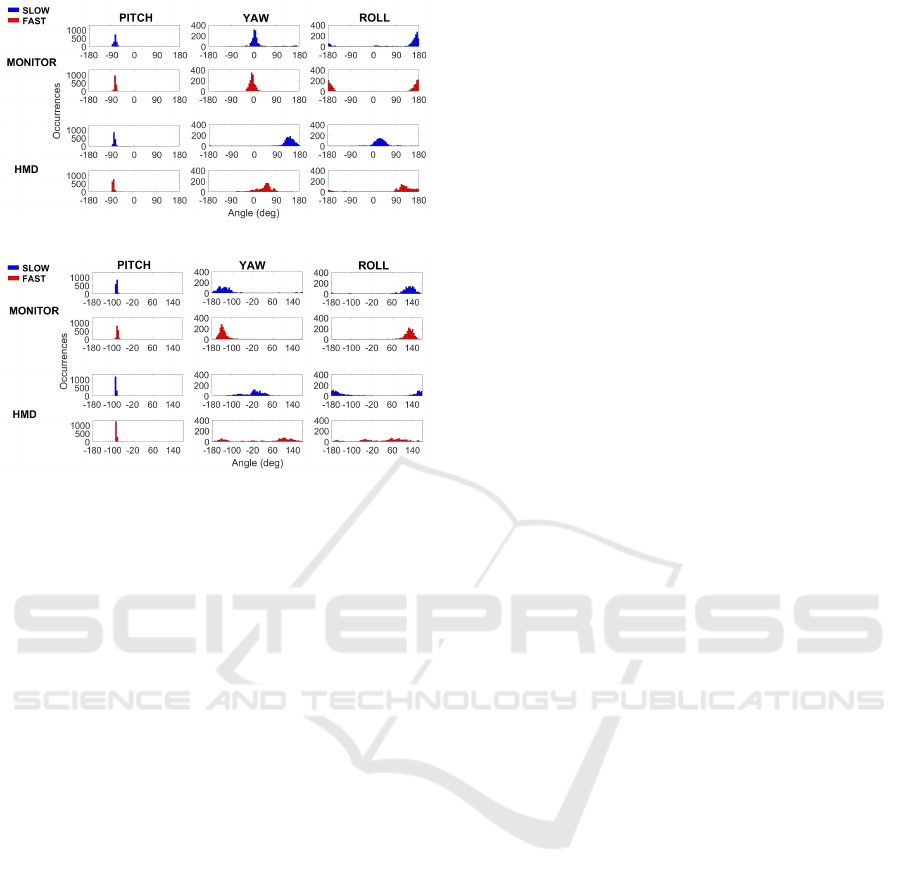
Figure 12 shows results referred to two partici-
pants who accomplished the task with Ellipse (a) and
Eight (b) paths both using the monitor and the Oculus
Rift. Considering each subject, in the monitor case,
we can notice that rotations are scattered around a
central value, which corresponds to the initial head ro-
tation when the application starts and the user looks at
the horizon in front of him; in the HMD case, instead,
especially in the Eight path, participants tended to
turn their head more, in order to receive more infor-
mation from the surrounding environment and better
follow the path. This is due to the higher difficulty of
the task, in fact the Eight path has more changes in di-
rection while the elliptic one can be considered quite
linear. This trend is even more evident in the trial with
the fast boat.
5 CONCLUSIONS
A simulation system for the training of boat pilots
have been tested by expert users. Two versions of the
simulation application have been implemented: the
first making use of a monitor (non-immersive) while
the second uses VR technologies (immersive). The
interface is composed of the model of a boat com-
mand panel, so the driving experience is as natural as
possible and user can sail simply turning the rudder
and using the accelerator knobs. The task is simple,
participants are required to steer two different boats, a
slow one and a fast one, and follow two paths, one ha-
ving the shape of an Ellipse and the other of an Eight.
Both vessel speed and path shape modulate the diffi-
culty of the task, i.e. the trial with elliptic path and
slow ship is the easiest one, while the trial with Eight
path and fast ship is the most difficult.
In this paper, we present preliminary results obtai-
ned from the analysis of quantitative (head rotati-
ons, trajectories and physiological measurements, i.e.
skin conductance and heart rate) and qualitative (SSQ
and IPQ) parameters recorded during the experimen-
tal sessions. The main goal of our study is evaluating
the two setups (immersive and non-immersive) in or-
der to understand which one is better for the purpose
of training. In particular, we analyze three different
aspects: the performances, e.g. user’s ability to fol-
low the path; the comfort and naturalness of the expe-
rience, in terms of physiological measurements and
level of cybersickness; the sense of presence, using
both a subjective questionnaire and tracked head mo-
vements.
- Analysis of Performances. Boat latitude and lon-
gitude recorded during the experimental session,
show that expert drivers are able to follow the
predefined path in a quite accurate manner. This
evaluation, however, is qualitative and coarse and
could be substituted in future by the calculation
of the actual accuracy between participants and
real path. This parameter could be also used as a
runtime feedback given to users in order to make
them aware of their actual performances and en-
courage improvements.
- Comfort and Naturalness of the Experience.
Considering the physiological measurements,
both skin conductance and heart rate remain con-
stant and stable in the four trials. They are slightly
higher in the fast vessel tests, probably because of
the difficulty of the task. This suggest that both
systems (monitor and Oculus Rift) do not intro-
duce anxiety, stress or particular emotional or ma-
laise states that could compromise performances
and, eventually, learning of new skills. Moreover,
this could indicate that participants have perceived
simulations as natural experiences, comparable to
the real one.
Finally, answers given to the SSQ highlight an in-
crease of cybersickness, especially in the virtual
reality setup. There is a general increment of Nau-
sea, Disorientation and Oculomotor parameters,
even if the last one is the most preponderant.
Evaluation of a Virtual Reality System for Ship Handling Simulations
71

Considering the two paths separately, in the El-
lipse case, cybersickness seems worst, probably
because in this simulations sea was more rough.
So sickness depends on a combine action of game
settings (calm or rough sea), hardware setup (im-
mersive or non-immersive) and speed of the boat.
In other words, the use of VR itself does not ex-
plain the increase of user malaise state.
- Sense of Presence. Sense of presence rates are
higher for VR simulations. Moreover, the trials
with the fast ship have a lower Spatial Presence
but a higher Experienced Realism with respect to
trials with the slow vessel. This is probably due to
the better realism and response speed of the fast
ship. Furthermore, there is a statistically signifi-
cant difference between the Presence Factor in im-
mersive and non-immersive simulations. All these
results demonstrate that the use of VR systems al-
lows user to feel more involved and present in the
virtual scenario.
Head rotation angles represent an objective me-
asurement of the degree of the interaction of the
user with the virtual scenario. This evaluation,
though, is subjective, in fact people can be more
or less prone to explore the virtual world surroun-
ding them. Considering each participant separa-
tely, we can notice that head rotations are actually
more limited in the monitor case, scattered around
a central value, which is the initial head rotation
when the application starts. While in the HMD
case, in general, people have a greater propensity
to turn their head, especially in the Eight path with
the fast boat, probably because the higher diffi-
culty of the task leads them to collect more in-
formation from the environment, for example the
development of the path curvature.
In conclusion, this preliminary work highlighted
that the two setups have been proven to be equiva-
lent: in terms of performances there are no differen-
ces and while monitor simulation system causes less
cybersickness, VR setup allows a better sense of pre-
sence. Further acquisitions, on non expert drivers or
senior drivers, are required in order to better under-
stand the usability of the system on a large scale and
its actual usefulness in providing long term learning
of new skills.
ACKNOWLEDGEMENTS
This work was partially funded by the Project “MIT
(Ministero dei Trasporti - Italian Ministry of Trans-
port) - Leadership tecnologica”
REFERENCES
Aldaba, C. N., White, P. J., Byagowi, A., and Moussavi, Z.
(2017). Virtual reality body motion induced navigati-
onal controllers and their effects on simulator sickness
and pathfinding. In Engineering in Medicine and Bio-
logy Society (EMBC), 2017 39th Annual International
Conference of the IEEE, pages 4175–4178. IEEE.
Benedict, K., Kirchhoff, M., Gluch, M., Fischer, S., Schaub,
M., Baldauf, M., and Klaes, S. (2014). Simula-
tion augmented manoeuvring design and monitoring-
a new method for advanced ship handling. TransNav,
International Journal on Marine Navigation and Sa-
fety od Sea Transportation, 8(1).
Bos, J. E., de Vries, S. C., van Emmerik, M. L., and Groen,
E. L. (2010). The effect of internal and external fields
of view on visually induced motion sickness. Applied
ergonomics, 41(4):516–521.
Bouchard, S., Robillard, G., Renaud, P., and Bernier, F.
(2011). Exploring new dimensions in the assessment
of virtual reality induced side effects. Journal of com-
puter and information technology, 1(3):20–32.
Coxon, M., Kelly, N., and Page, S. (2016). Individual dif-
ferences in virtual reality: Are spatial presence and
spatial ability linked? Virtual Reality, 20(4):203–212.
Davis, S., Nesbitt, K., and Nalivaiko, E. (2014). A syste-
matic review of cybersickness. In Proceedings of the
2014 Conference on Interactive Entertainment, pages
1–9. ACM.
Davis, S., Nesbitt, K., and Nalivaiko, E. (2015). Comparing
the onset of cybersickness using the Oculus Rift and
two virtual roller coasters. In Proceedings of the 11th
Australasian Conference on Interactive Entertainment
(IE 2015), volume 27, page 30.
Gianaros, P. J., Muth, E. R., Mordkoff, J. T., Levine,
M. E., and Stern, R. M. (2001). A questionnaire for
the assessment of the multiple dimensions of motion
sickness. Aviation, space, and environmental medi-
cine, 72(2):115.
Kennedy, R. S., Lane, N. E., Berbaum, K. S., and Li-
lienthal, M. G. (1993). Simulator sickness question-
naire: An enhanced method for quantifying simulator
sickness. The international journal of aviation psy-
chology, 3(3):203–220.
Keshavarz, B. and Hecht, H. (2011). Validating an efficient
method to quantify motion sickness. Human factors,
53(4):415–426.
Kim, Y. Y., Kim, H. J., Kim, E. N., Ko, H. D., and Kim,
H. T. (2005). Characteristic changes in the physiologi-
cal components of cybersickness. Psychophysiology,
42(5):616–625.
Lawson, B. and Mead, A. (1998). The sopite syndrome
revisited: drowsiness and mood changes during real
or apparent motion. Acta astronautica, 43(3-6):181–
192.
McGill, M., Ng, A., and Brewster, S. (2017). I am the
passenger: How visual motion cues can influence
sickness for in-car VR. In Proceedings of the 2017 chi
conference on human factors in computing systems,
pages 5655–5668. ACM.
HUCAPP 2019 - 3rd International Conference on Human Computer Interaction Theory and Applications
72

Munafo, J., Diedrick, M., and Stoffregen, T. A. (2017). The
virtual reality head-mounted display Oculus Rift indu-
ces motion sickness and is sexist in its effects. Expe-
rimental brain research, 235(3):889–901.
Muth, E. R., Stern, R. M., Thayer, J. F., and Koch, K. L.
(1996). Assessment of the multiple dimensions of
nausea: the nausea profile (NP). Journal of psycho-
somatic research, 40(5):511–520.
Nalivaiko, E., Davis, S. L., Blackmore, K. L., Vakulin, A.,
and Nesbitt, K. V. (2015). Cybersickness provoked by
head-mounted display affects cutaneous vascular tone,
heart rate and reaction time. Physiology & behavior,
151:583–590.
Nesbitt, K., Davis, S., Blackmore, K., and Nalivaiko, E.
(2017). Correlating reaction time and nausea measu-
res with traditional measures of cybersickness. Dis-
plays, 48:1–8.
Nichols, S., Cobb, S., and Wilson, J. R. (1997). Health
and safety implications of virtual environments: Me-
asurement issues. Presence: Teleoperators & Virtual
Environments, 6(6):667–675.
Ohyama, S., Nishiike, S., Watanabe, H., Matsuoka, K., Aki-
zuki, H., Takeda, N., and Harada, T. (2007). Auto-
nomic responses during motion sickness induced by
virtual reality. Auris Nasus Larynx, 34(3):303–306.
Reason, J. T. and Brand, J. J. (1975). Motion sickness. Aca-
demic press.
Regenbrecht, H. and Schubert, T. (2002). Real and il-
lusory interactions enhance presence in virtual envi-
ronments. Presence: Teleoperators & Virtual Envi-
ronments, 11(4):425–434.
Riccio, G. E. and Stoffregen, T. A. (1991). An ecologi-
cal theory of motion sickness and postural instability.
Ecological psychology, 3(3):195–240.
Sharples, S., Cobb, S., Moody, A., and Wilson, J. R.
(2008). Virtual reality induced symptoms and ef-
fects (VRISE): Comparison of head mounted display
(HMD), desktop and projection display systems. Dis-
plays, 29(2):58–69.
Sheridan, T. B. (1992). Musings on telepresence and virtual
presence. Presence: Teleoperators & Virtual Environ-
ments, 1(1):120–126.
Slater, M., McCarthy, J., and Maringelli, F. (1998). The
influence of body movement on subjective presence
in virtual environments. Human Factors, 40(3):469–
477.
Slater, M., Usoh, M., and Steed, A. (1994). Depth of pre-
sence in virtual environments. Presence: Teleopera-
tors & Virtual Environments, 3(2):130–144.
Usoh, M., Arthur, K., Whitton, M. C., Bastos, R., Steed,
A., Slater, M., and Brooks Jr, F. P. (1999). Walking¿
walking-in-place¿ flying, in virtual environments. In
Proceedings of the 26th annual conference on Com-
puter graphics and interactive techniques, pages 359–
364. ACM Press/Addison-Wesley Publishing Co.
Usoh, M., Catena, E., Arman, S., and Slater, M. (2000).
Using presence questionnaires in reality. Presence:
Teleoperators & Virtual Environments, 9(5):497–503.
Varela, J. and Soares, C. G. (2015). Interactive 3d desk-
top ship simulator for testing and training offloading
manoeuvres. Applied Ocean Research, 51:367 – 380.
Varela, J. M., Rodrigues, J., and Soares, C. G. (2015). 3D
simulation of ship motions to support the planning of
rescue operations on damaged ships. Procedia Com-
puter Science, 51:2397–2405.
Wirth, W., Hartmann, T., B
¨
ocking, S., Vorderer, P., Klimmt,
C., Schramm, H., Saari, T., Laarni, J., Ravaja, N.,
Gouveia, F. R., et al. (2007). A process model of the
formation of spatial presence experiences. Media psy-
chology, 9(3):493–525.
Witmer, B. G. and Singer, M. J. (1998). Measuring pre-
sence in virtual environments: A presence question-
naire. Presence, 7(3):225–240.
Evaluation of a Virtual Reality System for Ship Handling Simulations
73
