
Shape Recognition in High-level Image Representations:
Data Preparation and Framework of Recognition Method
Jagoda Lazarek and Piotr S. Szczepaniak
Institute of Information Technology, Lodz University of Technology, Lodz, Poland
Keywords:
Image Processing, Pattern Recognition, Image Representation, Graph Grammars, Mammograms, Spiculated
Masses.
Abstract:
The automatic shape recognition is an important task in various image processing applications, including
medical problems. Choosing the right image representation is key to the recognition process. In the paper,
we focused on high-level image representation (using line segments), thanks to which the amount of data nec-
essary for processing in subsequent stages is significantly reduced. We present the framework of recognition
method with the use of graph grammars.
1 INTRODUCTION
Since image processing and image analysis are key in
decision supporting systems and process automatisa-
tion, there is a need to develop processing techniques.
As a complex multistage process consisting of seg-
mentation, transformation, extraction of features, and
pattern classification, it is necessary to choose the best
technique for each of them, which results in the suc-
cess of the final recognition.
First of all, it is important to preapare data –
choosing the right representation of the image, de-
pending on the task. The algorithms can be based on
a digital image in an unprocessed version called ma-
trix (pixel) representation (low-level representation)
or any other high-level representation, e.g., using line
segments or edges. The last of these (high-level rep-
resentation) is particularly adequate to problems in
which the structure of recognized objects is impor-
tant. In the paper we discuss data preparation process
and framework of recognition method.
As important as the selection of image representa-
tion is the use of an appropriate recognition method.
Among the methods of image recognition, three ap-
proaches can be distinguished: statistical pattern
recognition (Chen, 1973; Devijver and Kittler, 1982;
Fukunaga, 1972; Fukunaga, 1990; Kurzynski, 1997;
Schurmann, 1996; Vapnik, 1998; Webb and Copsey,
2011), syntactic pattern recognition (Bunke and San-
feliu, 2000; Fu, 1982; Gonzales and Thomason, 1978;
Miclet, 1986; Pavlidis, 1977; Skomorowski, 2013)
and neural pattern recognition (Dunne, 2007; Omid-
var and Dayhoff, 1997; Pao, 1989; Schurmann, 1996).
Solving problems in which the image structure
is important requires a syntactic approach. The im-
age is decomposed into primary components (sim-
ple elements) whose mutual relations build its struc-
ture. The syntactic approach includes string, tree and
graph methods. Images are represented respectively
by means of string, tree and graph grammars. Image
recognition consists in performing a parsing (syntac-
tic analysis) that determines whether graph is accept-
able, correct for a defined grammar.
Based on the above observations, we proposed
a framework for shape recognition in images in high-
level representations using graph grammars. The
choice of graph grammars is due to their greater de-
scriptive power – in comparison with string or tree
grammars. The descriptive power of graph grammars
gives more options in solving complex problems, but
at the same time is a challenge in the process of ana-
lyzing them.
2 DATA PREPARATION:
HIGH-LEVEL IMAGE
REPRESENTATIONS
As mentioned in the Introduction, image analysis re-
quires the interpretation of a huge amount of low-level
data – pixels. Proper data preparation is key.
Two stages can be distinguished in the process of
image preparation for recognition: preprocessing and
Lazarek, J. and Szczepaniak, P.
Shape Recognition in High-level Image Representations: Data Preparation and Framework of Recognition Method.
DOI: 10.5220/0007579000570064
In Proceedings of the 12th International Joint Conference on Biomedical Engineering Systems and Technologies (BIOSTEC 2019), pages 57-64
ISBN: 978-989-758-353-7
Copyright
c
2019 by SCITEPRESS – Science and Technology Publications, Lda. All rights reserved
57
data reduction. Preprocessing methods are used to
eliminate noise and unnecessary information, includ-
ing changing the colour model, mathematical opera-
tions on images, improving contrast, removing arte-
facts, and identifying areas of interest (Malina and
Smiatacz, 2008).
Reducing the amount of data can be achieved us-
ing the methods of detecting lines, edges and segmen-
tation (Ballard and Brown, 1982). It allows finding
consistent, in terms of specific criteria, areas – consti-
tuting objects or their fragments. In principle, three
groups of methods are distinguished: methods of re-
gion growing, clustering and detection of boundaries.
So far, a wide variety of methods have been
developed to detect edges and lines (Forsyth and
Ponce, 2003; Gonzalez and Woods, 2008; Pratt, 1991;
Shapiro and Stockman, 2001; Sonka et al., 2007). The
edge detection methods are the first step in the meth-
ods of detecting lines. Many of the edge detection
methods use convolution masks and differential oper-
ators. Among the known edge detection methods, one
should mention the Roberts operator, the Sobel op-
erator, the Prewitz operator, the Laplacian operators,
Kirsch and Robinson masks. More advanced meth-
ods include the following algorithms: Marr-Hildreth
(1980) (Marr and Hildreth, 1980), Canny (1986)
(Canny, 1986), Boie-Cox (1986/87) (Boie and Cox,
1987), Shen-Castan (1992) (Shen and Castan, 1992),
Frei-Chen (1970) (Frei and Chen, 1977). One of the
well-known methods is the Hough transform (Gonza-
lez and Woods, 2008; Sonka et al., 2007). In 2013,
Krylov and Nelson proposed a method to detect line
segments and curvilinear structures, (Krylov and Nel-
son, 2014; Krylov et al., 2013). Another line segment
detector LSD was developed in 2014 by Grompone
von Goi (Grompone von Goi, 2014).
Based on detected complex structures such as
lines, shapes, it is possible to change the represen-
tation of the image from low-level to high-level rep-
resentation.
By default, the image is represented by pixels, and
more precisely by a rectangular pixel grid. Such rep-
resentation is not natural for a human who perceives
more complex objects – lines, shapes, spots. In ad-
dition, image analysis in the low-level – pixel repre-
sentation requires the analysis of a very large num-
ber of data. Hence, it is justified to distinguish in
the picture significant structures, objects – coherent
in terms of certain criteria, e.g . level of grey, colour,
texture. This process is very important because it al-
lows further image processing at a level higher than
pixel (Umbaugh, 2011) (figure 1). High-level repre-
sentations can be based on e.g.:
• line segments or edge segments (Grompone von
Goi, 2014; Krylov and Nelson, 2014; Lazarek and
Szczepaniak, 2014; Lazarek et al., 2014),
• superpixels (Achanta et al., 2012),
• contours – ,,active partitions” (Pryczek et al.,
2010; Tomczyk et al., 2012),
• OB (ang. Object Bank) (Li et al., 2010; Li et al.,
2014).
The higher the image representation level, the
greater the knowledge about it, and the number of data
necessary for processing decreases.
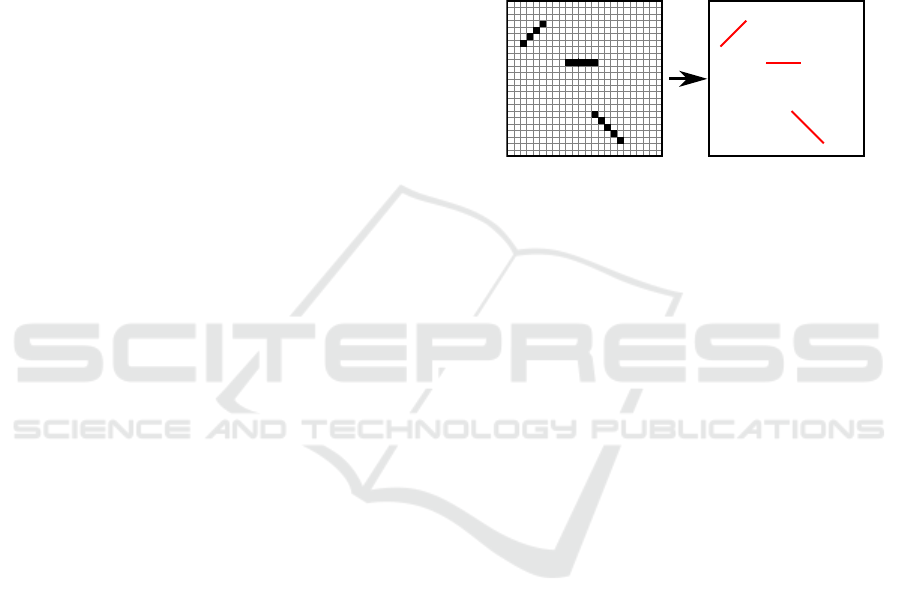
Figure 1: Visualization of the change of representation of
the image from low-level (pixels) to high-level representa-
tion (line segments).
Usage of context information is presented in fig-
ure 1 – analysis of adjacent pixels allows detection
of more complex structures. Instead of describing the
image using the values associated with each pixel in-
dependently, it is possible to use the description us-
ing e.g., the coordinates of the ends of the segments,
which increases the knowledge about the image being
processed.
3 HIGH-LEVEL IMAGE
REPRESENTATION –
EXAMPLE: MAMMOGRAM
IMAGE
The selection of the right representation is closely re-
lated to the problem being solved. The concept of the
use of high-level image representation is presented on
the example of mammogram data preparation for the
task of recognizing spiculated changes.
3.1 High-level Image Representation
Using Line Segments
Spiculated changes are characteristic masses that can
be observed on mammography images. Spiculated
change consists of a bright centre and star-shaped ex-
tensions of spicules spreading from it. An example
of a spiculated change is shown in figure 2. An oc-
currence of spiculated changes is a strong premise of
breast cancer (Kopans, 2007).
BIOIMAGING 2019 - 6th International Conference on Bioimaging
58
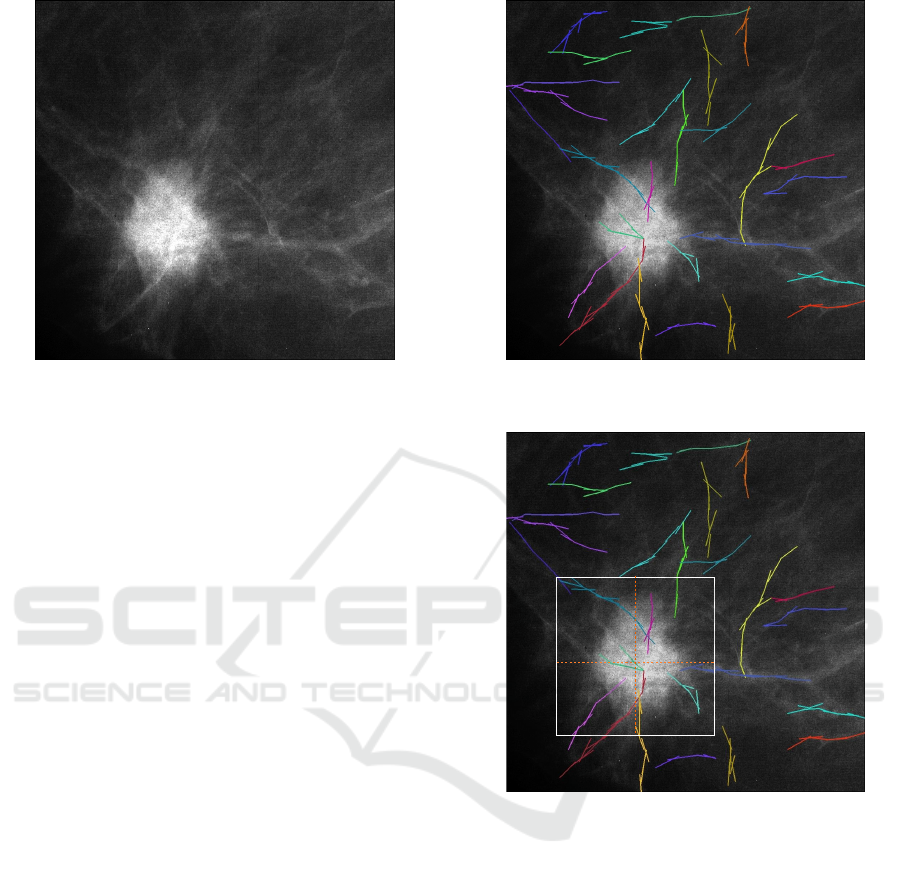
Figure 2: Spiculated change in mammogram.
By analyzing figure 2 it can be observed that
bright bands radiate from the bright centre – the
spicules, that can be represented by line segments.
Therefore, for the purpose of analysis of mammo-
graphic images for the presence of spiculated lesions
on them, it was proposed to change the representa-
tion of the image from low-level (pixels) to the rep-
resentation of a higher level (line segments). In order
to detect the segments of the line, the Krylov-Nelson
method was used. The image in such a representation
can be used to further analysis, enabling the detec-
tion and recognition of spiculated changes. Figure 3
presents a fragment of a mammogram image with de-
tected line segments that create its new representation
(high-level).
The automatic detection of spiculated changes,
despite significant research in this area, remains
a challenge (Jiang et al., 2008). This is due to the fact
that spiculated changes are often very subtle and are
characterized by a large variety in appearance (Jiang
et al., 2008), the number of spicules depending on the
case may vary enormously.
3.2 Selection of a Significant Part of the
Image – ROI
In order to prepare data for the recognition process, it
is necessary to extract interesting fragments from an
image – which may contain a spiculated change.
In the considered task, the choice of the ROI (area
of interest) can be realized in two ways – automatic
or supervised.
Regardless of the way ROI is selected, the square
area is extracted and then the coordinates of its centre
(intersection diagonals) are determined – (c
x
, c
y
). In
figure 4, the ROI containing the spiculated change is
Figure 3: Spiculated change with detected line segments
(with the use of the Krylov-Nelson method).
Figure 4: The area of interest – ROI (with highlighted sub-
areas) including the spiculated change visible in the mam-
mogram image. Initial ROI position selected in a supervised
way.
selected.
After determining the ROI in the high-level im-
age representation, it can be seen that the ROI frame
intersects the found structures – groups of line seg-
ments, marked with the same colour as in figure 4.
Omitting the line segments belonging to the separated
structures but remaining outside the ROI would re-
sult in a loss of both the number and the quality of
the data. To solve this problem, an original solution
was proposed to create a ”flexible” ROI frame that
adapts its shape to the groups of founded line seg-
ments. According to the author’s knowledge, the pro-
posed method of expanding the area of interest (ROI)
has not been described in the literature.
In figure 4 the selected area (ROI) is divided into
Shape Recognition in High-level Image Representations: Data Preparation and Framework of Recognition Method
59
four sub-areas. It can be observed that some of de-
tected groups of line segments (marked with the same
colour) cross the boundaries of the area of interest, or
are simultaneously in two adjacent sub-areas:
• a green group of line segments lying partly in the
right upper ROI sub-area, and partly outside it,
• a blue group of line segments lying partly in the
right, lower ROI sub-area, and partly outside it,
• yellow group of line segments lying partly in the
right, lower ROI sub-area, and partly outside it,
• a red group of line segments lying partially in the
left, lower sub-area of the ROI, partly in the right,
lower sub-area of the ROI and - partly outside the
ROI area,
• a purple group of line segments lying partially in
the left, lower ROI sub-area, and partly outside it,
• a blue group of line segments lying partially in the
left upper ROI sub-area, and partly outside it.
Omitting these fragments of groups of line segments
that lie outside the boundaries of the selected ROI
would result in the loss of a significant part of the in-
formation, and thus affect the effectiveness of the di-
agnosis. Similarly to ignoring information about the
belonging of detected line segments to larger groups,
i.e. only a geometric interpretation of the position of
line segments, which does not take into account the
line segments belonging to complex structures (lo-
cated in several sub-areas).
To avoid losing information, an innovative solu-
tion was proposed to match the ROI’s area to the in-
formation in the image. Each of the four sub-areas
expands independently of the others, adapting to the
information in the image. Systems of groups of line
segments are included in those sub-areas in which
they are in the majority. Three main steps may be
listed:
• segments are initially assigned to sub-area, in
which lays at least one of its ends;
• segments are reorganized – segments are assigned
to sub-area, in which the majority of segments
from the same group lay;
• new bounding boxes for sub-areas are created –
the smallest rectangle which contains all segments
from sub-area is drawn.
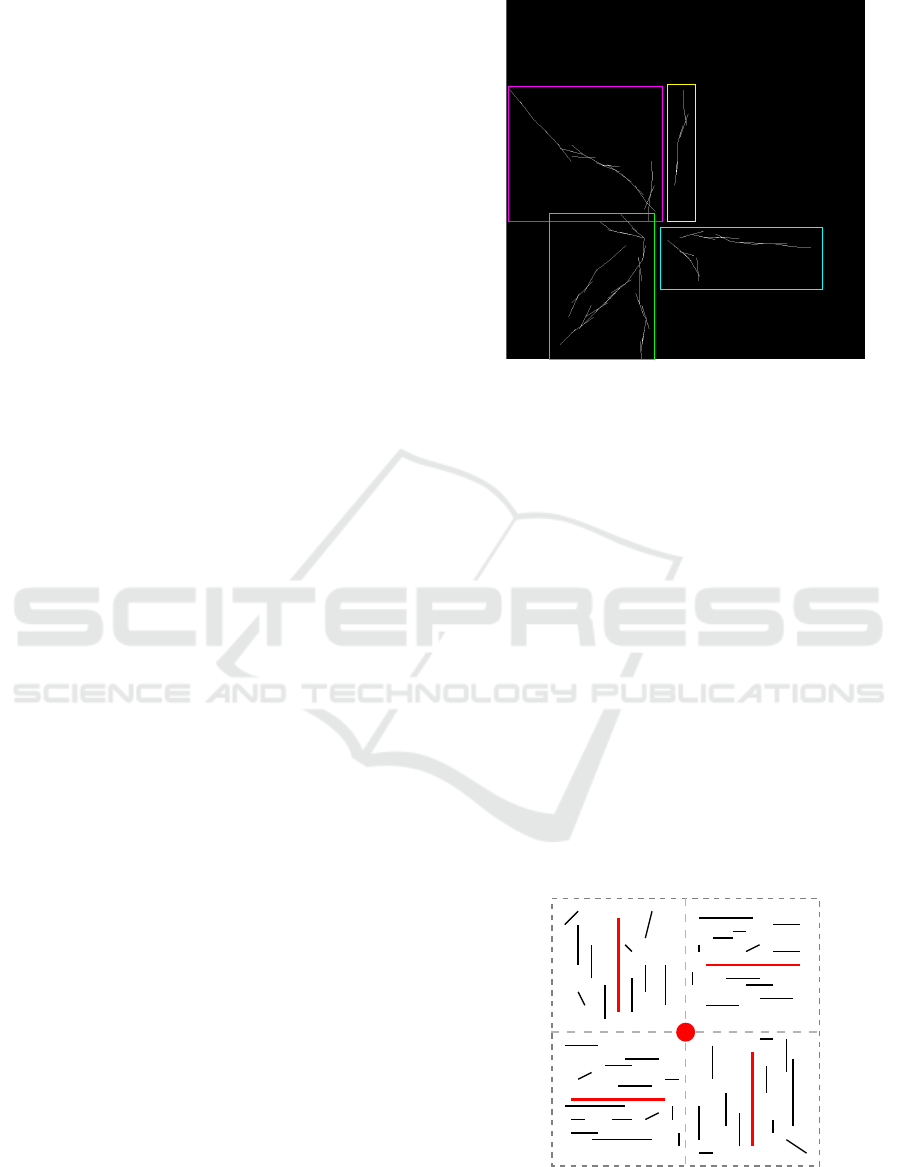
The extended original ROI frame shown in figure 4 is
shown in figure 5.
3.3 Graph Construction
Due to the structural nature of spiculated changes, we
proposed to recognize them using graph grammars.
Figure 5: Flexible ROI frame - built of four segments.
The framework of the method is presented in the next
subsection.
To recognize spiculated changes using graph
grammars, it is necessary to construct a graph rep-
resenting the area of interest. Graph consists of five
vertices – one of them is a previously designated point
that is the centre of the original ROI, the other four are
associated with four sub-areas of the extended ROI.
The vertex in the centre of ROI is assigned the label
s, while the labels for the remaining vertices are as-
signed in – depending on the arrangement of line seg-
ments located in the given sub-area of the ROI. The
drawing 6 illustrates the concept. The red line seg-
ments represent the dominant direction of the line seg-
ments in a given sub-area (black), are determined on
the basis of the median of directions of all segments
located in a given sub-area. The selected segments are
assigned the appropriate labels in accordance with the
principles presented in figure 7. Subsequent vertices
are indexed according to the principles presented in
Figure 6: ROI with 4 sub-areas with detected line segments
(black) and red line segments – being a symbolic represen-
tation of the dominant line segments direction in a given
segment.
BIOIMAGING 2019 - 6th International Conference on Bioimaging
60
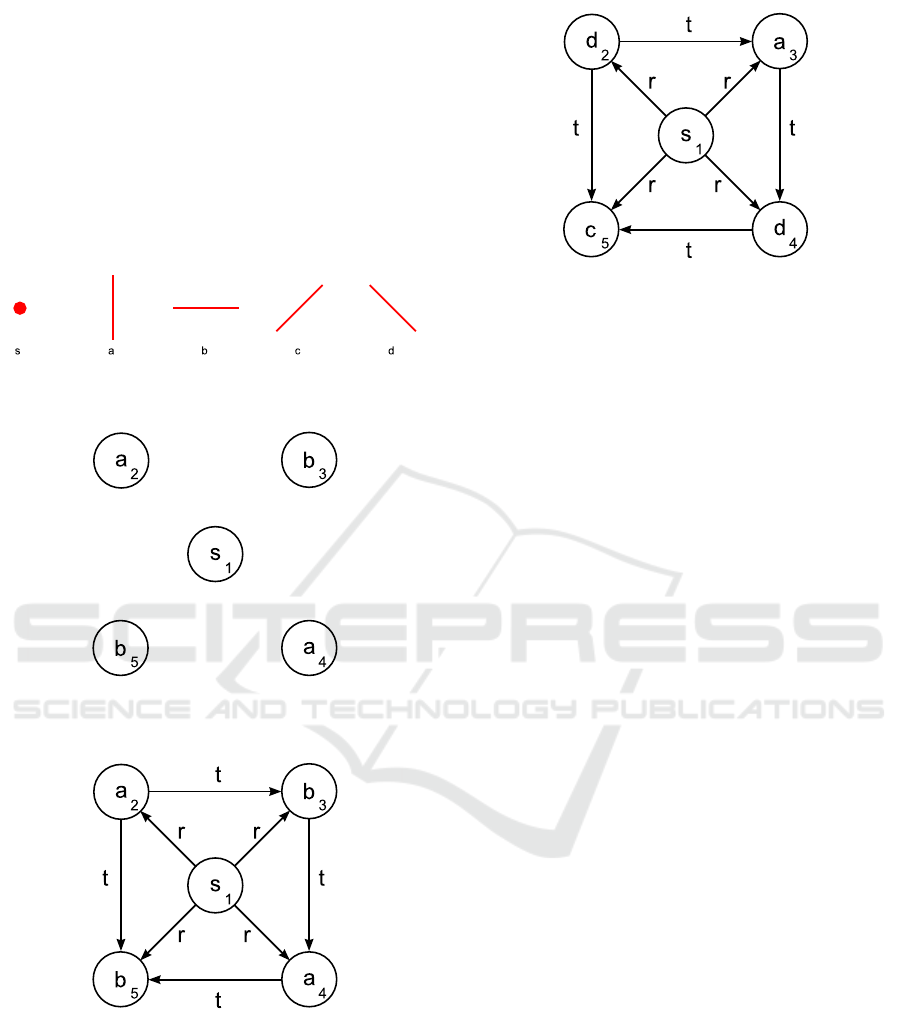
figure 8. The next step is the proper connection of the
vertices – the edge comes out from the vertex with the
smaller index and goes to the vertex with the larger
index. Next, a label describing relations between ver-
tices is assigned to each edge. A two-element set of
edge labels was defined – Γ = {r, t}:
• r – is assigned to the edge from a central vertex to
each non-central vertex,
• t – is assigned to the edges connecting non-central
vertices.
Figure 7: Visualization of a set of labels for dominant line
segments ∆ = {s, a, b, c, d}.
Figure 8: Graph representation of the pattern shown in fig-
ure 6 with assigned vertex labels and vertex indexes.
Figure 9: Graph representation of the pattern shown in fig-
ure 6 with assigned vertex labels, vertex indexes, and edge
labels.
Graph representation of the pattern shown in fig-
ure 5 (mammogram) is presented in figure 10.
Patterns presented in figure 9 and 10 may be rec-
ognized with dedicated graph grammar. Whats con-
sists one of the stages of graph grammar based shape
recognition method described in the next section.
Figure 10: Graph representation of the pattern shown in fig-
ure 5 (mammogram) with assigned vertex labels, vertex in-
dexes, and edge labels.
4 GRAPH GRAMMAR BASED
SHAPE RECOGNITION
METHOD
The method of semantic image analysis in high-level
representation (e.g., line segments) with the use of
graph grammars enables the detection and recognition
of a selected class of objects. A universal processing
sequence has been proposed that can be adapted to
the task of detection and recognition of any class of
objects that can be described using dedicated graph
grammars. The image processing scheme is shown in
figure 11.
4.1 Graph Grammars
Graph representations and graph grammars are used
in many areas of practical importance, e.g.:
• representation of the logical structure of algo-
rithms (Nagl, 1979),
• defining the semantics of programming languages
(Gottler, 1983),
• code optimization (Nagl, 1979),
• modeling and processing of databases (Angles
and Gutierrez, 2005; Angles and Gutierrez, 2008;
Cheng et al., 2009; Nagl, 1979),
• information processing (Jiang and Bunke, 2017),
• system modeling (Kotulski and Sedziwy, 2011;
Kotulski and Szpyrka, 2011; Rafe et al., 2009;
Sedziwy et al., 2012; Szpyrka and Kotulski, 2011;
Szpyrka et al., 2017),
• defining visual languages (Ehrig et al., 1999; Her-
mann et al., 2008; Rekers and Schurr, 1997;
Zhang et al., 2001).
Shape Recognition in High-level Image Representations: Data Preparation and Framework of Recognition Method
61
The important field being of interest in this pa-
per is computer image analysis (Flasinski, 1989;
Flasinski, 2007; Flasinski and Myslinski, 2010; Fu,
1974; Gonzales and Thomason, 1978; Lazarek and
Szczepaniak, 2016; Lin et al., 2009; Pavlidis, 1977;
Rosenfeld, 1976; Shaw, 1969; Tadeusiewicz and
Flasinski, 1991).
Graph grammars are commonly used to describe
images, but rarely to recognize. The reason for
this situation is due to the computational complex-
ity of the syntactic analysis process (Skomorowski,
2013). However, graph grammars are a very interest-
ing tool for creating recognition systems in which ob-
ject classes are defined explicitly. Due to the known
problem related to the computational complexity of
the syntactic analysis algorithms, it is particularly im-
portant to select the appropriate class of graph gram-
mars to ensure effective syntactic analysis. Grammat-
ical graphs that have these features are ETPL class
grammars (k) (embedding transformation preserved
production ordered, k-left nodes unambiguous). Their
effective syntactic analysis is possible, whose compu-
tational complexity is O(n
2
) (Flasinski, 1989; Flasin-
ski, 2007; Skomorowski, 2013).
4.2 Method of Semantic Image Analysis
in High-level Image Representation
The method of semantic image analysis in high-level
representation (e.g., line segments) with the use of
graph grammars enables recognition of a selected
class of objects. A processing sequence has been pro-
posed that can be adapted to the task of recognition of
any class of objects that can be described using dedi-
cated graph grammars.
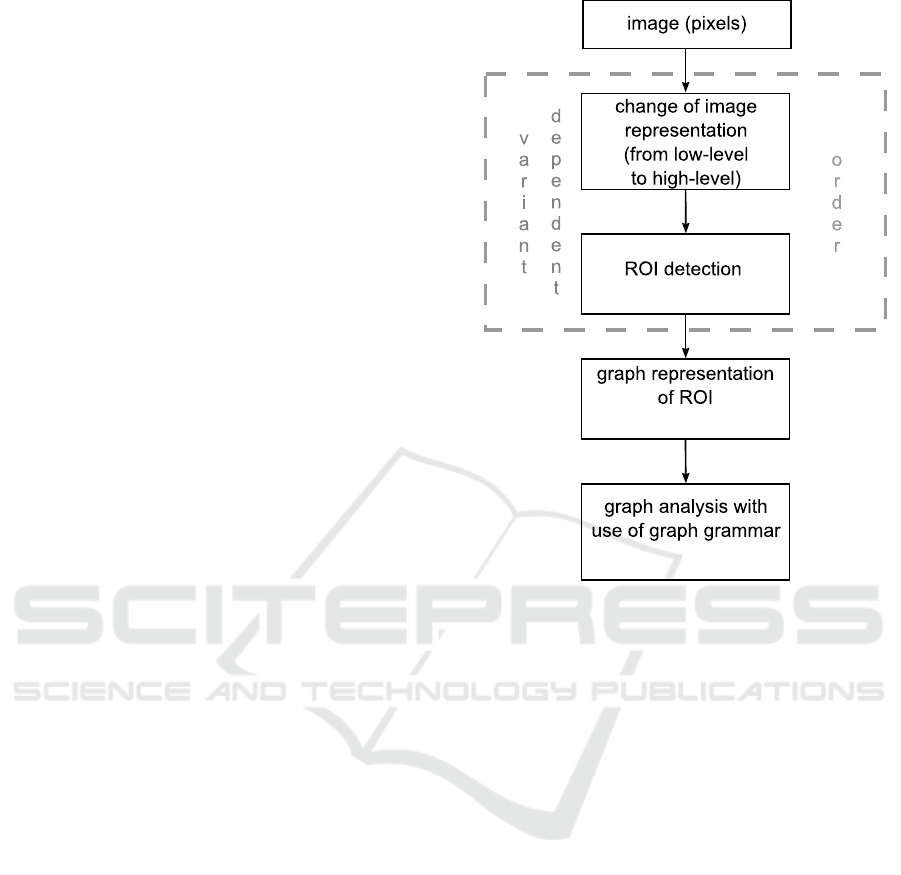
The method requires two main steps – changing
the representation of the image (to high-level) and de-
signing the appropriate graph grammar. Processing
schema (figure 11) is as follows:
1. Changing the representation of the image from
pixel to the representation of a higher level (e.g.,
line segments).
2. Detection of ROI – regions of interest.
3. Representation of ROI using a graph.
4. Graph analysis with the use of dedicated graph
grammar to recognize the object in the image.
5 SUMMARY
In the paper, we have shown the importance of prepa-
ration data process, which demands to change image
Figure 11: Processing scheme for the method of semantic
image analysis in high-level representation with the use of
graph grammars.
representation from low-level to high-level represen-
tation. Choosing proper representation strongly de-
pends on recognition purpose. We have depicted that
such representation may be used for the creation of
object structure and its further recognition with the
use of graph grammars, what was explained in the
section 4 about the framework of recognition method.
The presented general framework of graph gram-
mar based shape recognition method was successfully
used for recognition of spiculated masses in mammo-
graphic images where the high-level image represen-
tation (line segments) and dedicated graph grammar
were applied for recognition purpose (Lazarek, 2017).
REFERENCES
Achanta, R., Shaji, A., Smith, K., Lucchi, A., Fua, P., and
Susstrunk, S. (2012). Slic superpixels compared to
state-of-the-art superpixel methods. IEEE Transac-
tions on Pattern Analysis and Machine Intelligence,
34(11):2274–2282.
Angles, R. and Gutierrez, C. (2005). Querying rdf data from
a graph database perspective. In European Semantic
Web Conference, pages 346–360. Springer.
BIOIMAGING 2019 - 6th International Conference on Bioimaging
62

Angles, R. and Gutierrez, C. (2008). Survey of graph
database models. ACM Computing Surveys (CSUR).
Ballard, D. and Brown, C. (1982). Computer Vison. Pren-
tice Hall.
Boie, R. and Cox, I. (1987). Two dimensional optimum
edge recognition using matched and wiener filters for
machine vison. Proceedings of IEEE First Interna-
tional Conference on Computer Vison, pages 450–
456.
Bunke, H. and Sanfeliu, A. (2000). Syntactic and Structural
Pattern Recognition: Theory and Applications. World
Scientific.
Canny, J. (1986). A computional approach to edge detec-
tion. IEEE Transactions on Pattern Analysis and Ma-
chine Intelligence, pages 679–698.
Chen, C. (1973). Statistical pattern recognition. Hayden.
Cheng, J., Ke, Y., and Ng, W. (2009). Efficient query pro-
cessing on graph databases. ACM Trans. Database
Syst.
Devijver, P. and Kittler, J. (1982). Pattern recognition: a
statistical approach. Prentice-Hall.
Dunne, R. (2007). A Statistical Approach to Neural Net-
works for Pattern Recognition. Wiley.
Ehrig, H., Engels, G., Kreowski, H., and Rozenberg, G.
(1999). Handbook of Graph Grammars and Comput-
ing by Graph Transformation. World Scientific.
Flasinski, M. (1989). Characteristics of ednlc-graph gram-
mar for syntactic pattern recognition. Computer Vi-
sion, Graphics, and Image Processing, 47(1):1–21.
Flasinski, M. (2007). Inference of parsable graph gram-
mars for syntactic pattern. Fundamenta Informaticae,
80:379—413.
Flasinski, M. and Myslinski, S. (2010). On the use of
graph parsing for recognition of isolated hand pos-
tures of polish sign language. Pattern Recognition,
43(6):2249–2264.
Forsyth, D. and Ponce, J. (2003). Computer Vision. Prentice
Hall.
Frei, W. and Chen, C. (1977). Fast boundary detection: A
generalization and a new algorithm. IEEE Transac-
tions on Computers, (10):988–998.
Fu, K. (1974). Syntactic Methods in Pattern Recognition,
volume 112 of Mathematics in Science and Engineer-
ing. Academic Press.
Fu, K. (1982). Syntactic pattern recognition and applica-
tions. Prentice Hall.
Fukunaga, K. (1972). Introduction to statistical pattern
recognition. Academic Press.
Fukunaga, K. (1990). Introduction to statistical pattern
recognition. Academic Press.
Gonzales, R. and Thomason, M. (1978). Syntactic meth-
ods in pattern recognition. An introduction. Addisom-
Wesley.
Gonzalez, R. and Woods, R. (2008). Digital Image Process-
ing. Prentice Hall.
Gottler, H. (1983). Attributed graph grammars for graphics.
LNCS, 153:130–142.
Grompone von Goi, R. (2014). A Contrario Line Segment
Detection. Springer.
Hermann, F., Ehrig, H., and Taentzer, G. (2008). A typed
attributed graph grammar with inheritance for the ab-
stract syntax of uml class and sequence diagrams.
Electronic Notes in Theoretical Computer Science,
pages 261–269.
Jiang, L., Song, E., Xu, X., Ma, G., and Zheng, B. (2008).
Automated detection of breast mass spiculation lev-
els and evaluation of scheme performance. Academic
Radiology, 15(12):1534–1544.
Jiang, X. and Bunke, H. (2017). Graph Matching, vol-
ume 73 of Studies in Computional Intelligence, pages
149–173. Springer-Verlag.
Kopans, D. (2007). Breast Imaging. Lippincott Williams &
Wilkins, trzecie edition.
Kotulski, L. and Sedziwy, A. (2011). Parallel graph trans-
formations supported by replicated complementary
graphs. In Proceedings of the 10th International Con-
ference on Adaptive and Natural Computing Algo-
rithms - Volume Part II, ICANNGA’11, pages 254–
264. Springer-Verlag.
Kotulski, L. and Szpyrka, M. (2011). Graph representation
of hierarchical alvis model structure. In FCS 2011 :
proceedings of the 2011 international conference on
Foundations of Computer Science, pages 95–101.
Krylov, V. and Nelson, J. (2014). Stochastic extrac-
tion of elongated curvilinear structures with appli-
cations. IEEE Transactions on Image Processing,
23(12):5360–5373.
Krylov, V., Taylor, S., and Nelson, J. (2013). Stochastic
extraction of elongated curvilinear structures in mam-
mographic images. Springer, pages 475–484.
Kurzynski, M. (1997). Rozpoznawanie obiektow. Metody
statystyczne. Politechnika Wroclawska.
Lazarek, J. (2017). Object detection on digital im-
ages with the use of local data analysis and graph
representation (In Polish: Wykrywanie obiektow na
obrazach cyfrowych z zastosowaniem analizy lokalnej
i reprezentacji grafowych.). PhD thesis, Lodz Univer-
sity of Technology.
Lazarek, J. and Szczepaniak, P. (2014). Information Tech-
nologies in Biomedicine, Volume 3, chapter Line Seg-
ment Based Approach to Pattern Detection in Mam-
mographic Images, pages 37–48. Springer Interna-
tional Publishing.
Lazarek, J. and Szczepaniak, P. (2016). Automatic
Graph-Based Local Edge Detection, pages 397–409.
Springer International Publishing.
Lazarek, J., Tomczyk, A., and Szczepaniak, P. (2014).
Method of pattern detection in mammographic im-
ages. Advances in Intelligent Systems and Computing,
Springer, pages 235–245.
Li, L.-J., Su, H., Fei-Fei, L., and Xing, E. P. (2010). Ob-
ject bank: A high-level image representation for scene
classification & semantic feature sparsification. In
Advances in Neural Information Processing Systems,
pages 1378–1386.
Li, L.-J., Su, H., Lim, Y., and Fei-Fei, L. (2014). Ob-
ject bank: An object-level image representation for
high-level visual recognition. International Journal
of Computer Vision, 107(1):20–39.
Shape Recognition in High-level Image Representations: Data Preparation and Framework of Recognition Method
63

Lin, L., Wu, T., Porway, J., and Xu, Z. (2009). A
stochastic graph grammar for compositional object
representation and recognition. Pattern Recognition,
42(7):1297–1307.
Malina, W. and Smiatacz, M. (2008). Cyfrowe
przetwarzanie obrazow. Akademicka Oficyna
Wydawnicza EXIT.
Marr, D. and Hildreth, E. (1980). Theory of edge detection.
Proceedings of the Royal Society, pages 187–217.
Miclet, L. (1986). Structural methods in pattern recogni-
tion. Springer-Verlag.
Nagl, M. (1979). A tutorial and bibliographical survey on
graph grammars, pages 70–126. Springer Berlin Hei-
delberg.
Omidvar, O. and Dayhoff, J. (1997). Neural Networks and
Pattern Recognition. Academic Press.
Pao, Y. (1989). Addaptive pattern recognition and neural
networks. Addison-Wesley.
Pavlidis, T. (1977). Structural pattern recognition.
Springer-Verlag.
Pratt, W. (1991). Digital Image Processing. Wiley.
Pryczek, M., Tomczyk, A., and Szczepaniak, P. (2010). Ac-
tive partition based medical image understanding with
self organized, competitive spatch eduction. Journal
of Applied Computer Science, 18(2):67–78.
Rafe, V., Rahmani, A., Baresi, L., and Spoletini, P.
(2009). Towards automated verification of layered
graph transformation specifications. IET Software,
3(4):276–291.
Rekers, J. and Schurr, A. (1997). Defining and parsing vi-
sual languages with layered graph grammars. Visual
Languages and Computing, pages 27–55.
Rosenfeld, A. (1976). Digital Picture Analysis. Springer-
Verlag.
Schurmann, J. (1996). Pattern Classification: A Unified
View of Statistical and Neural Approaches. Wiley.
Sedziwy, A., Kotulski, L., and Szpyrka, M. (2012). For-
mal Methods Supporting Agent Aided Smart Lighting
Design, pages 225–239. Springer Berlin Heidelberg.
Shapiro, L. and Stockman, G. (2001). Computer Vision.
Prentice Hall.
Shaw, A. (1969). A formal picture description scheme as a
basis for picture processing systems. Information and
Control, 14(1):9–52.
Shen, J. and Castan, S. (1992). An optimal linear operator
for step edge detection. Computer Vision, Graphics,
and Image Processing: Graphical Models and Under-
standing, (2):112–133.
Skomorowski, M. (2013). Wybrane zagadnienia rozpoz-
nawania obrazow. Wydawnictwo Uniwersytetu
Jagiellonskiego.
Sonka, M., Hlavac, V., and Boyle, R. (2007). Image
Processing, Analysis and Machine Vision. Cengage-
Engineering.
Szpyrka, M. and Kotulski, L. (2011). Snapshot Reachability
Graphs for Alvis Models, pages 190–199. Springer
Berlin Heidelberg.
Szpyrka, M., Matyasik, P., and Mrowka, R. (2017). Alvis
- Modelling Language for Concurrent Systems, pages
315–341. Springer-Verlag.
Tadeusiewicz, R. and Flasinski, M. (1991). Rozpoznawanie
obrazow. Wydawnictwo Naukowe PWN.
Tomczyk, A., Szczepaniak, P., and Pryczek, M. (2012).
Cognitive hierarchical active partitions in distributed
analysis of medical images. Journal of Ambient Intel-
ligence and Humanized Computing, Springer.
Umbaugh, S. (2011). Digital image processing and analy-
sis. CRC Press.
Vapnik, V. (1998). Statistical learning theory. Wiley.
Webb, A. and Copsey, K. (2011). Statistical Pattern Recog-
nition. Wiley.
Zhang, D., Zhang, K., and Cao, J. (2001). A context-
sensitive graph grammar formalism for the specifi-
cation of visual languages. The Computer Journal,
44(3):186–200.
BIOIMAGING 2019 - 6th International Conference on Bioimaging
64
