
Sender Authentication for Automotive In-Vehicle Networks through Dual
Analog Measurements to Determine the Location of the Transmitter
Carlos Moreno and Sebastian Fischmeister
Department of Electrical and Computer Engineering, University of Waterloo,
Waterloo, Ontario, Canada
Keywords:
Cyber Physical Systems Security, Automotive Systems, Controller Area Network, Intrusion Detection.
Abstract:
Controller Area Network (CAN) is a fundamentally insecure communications bus. Its intrinsic lack of sender
authentication makes impersonation attacks a severe threat to the security of systems that rely on CAN for
communication between devices. In this paper, we propose a novel technique to enforce sender authenticity
on a CAN bus. The technique is reliable, robust, and reasonably easy and inexpensive to implement, as it relies
on non-clonable physical characteristics of the transmitted signals. In particular, we measure the analog signal
at two different locations on the CAN bus physical wire; the signal corresponding to the transmitted message
travels through the wire at a certain speed, which allows us to determine the physical location (i.e., position
along the wire) of the transmitter as a function of the relative delay between the two analog measurements.
Our work includes an experimental evaluation on an actual vehicle, with results that suggest that the technique
is effective and practical.
1 INTRODUCTION
Controller Area Network (CAN) is a fundamentally
insecure communication bus. Historically, this has
not been a critical issue, since automotive vehicles
had little or no connectivity to the outside world, and
cybersecurity was not as critical or widespread as it
is in the modern world. However, modern vehicles
include a high level of connectivity, including the In-
ternet; moreover, the prospect of autonomous vehicles
makes cybersecurity a critical aspect in modern auto-
motive vehicles.
Security of automotive vehicles has received a
great deal of attention in recent years, with some
works studying and reporting the potential vulnera-
bilities (Checkoway, S. et al., 2011; Koscher et al.,
2010; Petit and Shladover, 2015; Mukherjee et al.,
2016), some works reporting concrete practical at-
tacks, most notably the Jeep Cherokee hack by Miller
and Valasek (Miller and Valasek, 2015; Miller and
Valasek, 2016), and several works proposing strate-
gies and guidelines for securing automotive vehi-
cles (McAfee, 2015; Pike et al., 2015; SAE, 2016).
Problem Statement
Several of the above mentioned works highlight the
importance of sender authentication (rather, the lack
thereof) as one of the critical attack vectors. In par-
ticular, the work by Miller and Valasek (Miller and
Valasek, 2015) demonstrate the realistic nature of this
threat, where they compromised a vulnerable Elec-
tronic Control Unit (ECU) with unintended connec-
tivity to the Internet, and used it to send messages im-
personating other ECUs.
This leads to the motivating problem for our work,
which is that of sender authentication on a Controller
Area Network. Specifically, given an ongoing trans-
mission, determine as early as possible whether the
transmission is actually sent by the purported sender
(i.e., by the sender identified by the data in the trans-
mission).
Related Work
There have been several attempts to tackle the prob-
lem of sender authentication on a CAN bus. These
include approaches based on the use of cryptography,
such as (Van Herrewege et al., 2011; Groza et al.,
2017). However, the broadcast nature and relatively
low bandwidth of the CAN bus limit the applicability
of these techniques. Moreover, heterogeneous, com-
mercial off-the-shelf (COTS) devices are commonly
used by automobile designers. This makes it diffi-
cult to set up all the devices to share common secrets
to be used for symmetric-key cryptographic primi-
596
Moreno, C. and Fischmeister, S.
Sender Authentication for Automotive In-Vehicle Networks through Dual Analog Measurements to Determine the Location of the Transmitter.
DOI: 10.5220/0007580105960605
In Proceedings of the 5th International Conference on Information Systems Security and Privacy (ICISSP 2019), pages 596-605
ISBN: 978-989-758-359-9
Copyright
c
2019 by SCITEPRESS – Science and Technology Publications, Lda. All rights reserved

tives. Alternative approaches are based on finger-
printing some physical characteristic(s) of the trans-
mitting ECU. Timing-based detection of imperson-
ating ECUs was proposed in (Cho and Shin, 2016).
However, as shown by (Sagong et al., 2018), these
timing characteristics can be fingerprinted and emu-
lated by an attacker, entirely bypassing the protective
measure. We refer to this as a profile-and-mimic at-
tack. Voltage-based sender identification techniques
have been recently proposed, with the work by Mur-
vay and Groza (Murvay and Groza, 2014) being the
first one proposed, followed by Viden (Cho and Shin,
2017), and a refined implementation of Viden’s idea
in Scission (Kneib and Huth, 2018). Although to the
best of our knowledge no attacks have been proposed
that defeat these techniques, it is conceivable, even
intuitive, that they are also vulnerable to profile-and-
mimic attacks — an attacker with temporary physical
access to the CAN bus could place a transmitter that
uses a custom-made analog CAN driver that is able to
inject an arbitrary waveform on the CAN bus. This
is even more plausible when we observe that these
techniques do not use the complete analog waveform
of transmissions, but simply extract some statistical
characteristics of the voltage, making it easier to em-
ulate by an attacker.
Our Contributions
We propose a novel technique to enforce sender au-
thenticity on a CAN bus. The technique is based on
measuring the analog transmitted signal at two differ-
ent locations on the CAN bus physical wire; the sig-
nal corresponding to the transmitted message travels
through the wire at a certain speed, which determines
unique propagation delays from a given physical lo-
cation of the sender (i.e., position along the wire) to
each measuring device. With two measurements, the
system can biangulate
1
to determine the physical lo-
cation of the transmitter as a function of the relative
delay between the two analog measurements.
Our proposed approach exhibits some important
and somewhat unique advantages:
• The technique is not vulnerable to profile-and-
mimic attacks, as it relies on the propagation
timing of the transmitted signals as they travel
through the physical wire. These characteristics
cannot be reproduced by a sender at a different
physical location on the bus. Simply put: the ac-
tual physical location where a transmission orig-
inates cannot be mimicked by an ECU transmit-
1
We use the term biangulate by analogy to triangulate:
biangulation is to a one-dimensional location as triangula-
tion is to a two-dimensional location.
ting from a different physical location. Thus, a
profile-and-mimic attack is simply not possible by
a remote attacker that compromises some other
ECU(s) on the same CAN bus.
For an attacker with physical access to the CAN
bus, they could conceivably place the attacking
ECU in close proximity to the victim ECU. How-
ever, it may be straightforward to design the phys-
ical wiring of a vehicle in a way that makes this
task difficult — indeed, the wiring of modern ve-
hicles is so complex that this could already be the
case even if the manufacturer did not intend to
make it difficult for a third-party to connect to the
CAN bus at a location in close proximity to a tar-
get ECU.
• The technique can be easily implemented with
analog processing that drastically reduces the
computational power requirements to implement
the necessary processing. Although our experi-
mental evaluation was based on digital signal pro-
cessing, we discuss the design based on analog
processing and present a sketch of its implemen-
tation in Section 3.2.5.
• Our technique can be effectively used for attacks
prevention, and not just detection: the timing
characteristics that determine the physical loca-
tion of the sender are available as early as at the
first edge of the start bit of the transmission. Thus,
an attack prevention system can disrupt and effec-
tively inhibit the forged transmission before it is
completed. We will discuss this in more detail af-
ter we discuss the characteristics of CAN trans-
missions in Section 2.1.
Our work includes an experimental evaluation on
an actual vehicle, a Lexus RX-450H. The results sug-
gest that our proposed approach is feasible and effec-
tive.
2 BACKGROUND
This section presents some background notions rele-
vant to this work, including details on the CAN bus
as well as signals propagation through transmission
lines.
2.1 Controller Area Network
Controller Area Network (CAN) is a serial communi-
cation protocol with broadcast (bus) topology (Robert
Bosch GmbH, 1991). Its physical layer consists of a
twisted-pair cable where a binary signal is transmitted
Sender Authentication for Automotive In-Vehicle Networks through Dual Analog Measurements to Determine the Location of the
Transmitter
597
using differential signaling. The two signals are de-
noted CAN H and CAN L (CAN High and Low, re-
spectively). Typically, the “rest” state of the bus — a
logical 1 — is given by both CAN H and CAN L at
the middle of the voltage range, 2.5 V, and a logical
0 is represented by the CAN H signal at 2.5 V + ∆v
and the CAN L signal at 2.5 V − ∆v, where ∆v can
be implementation specific. Additional details or a
comprehensive list of configurations are not relevant
to understanding our work.
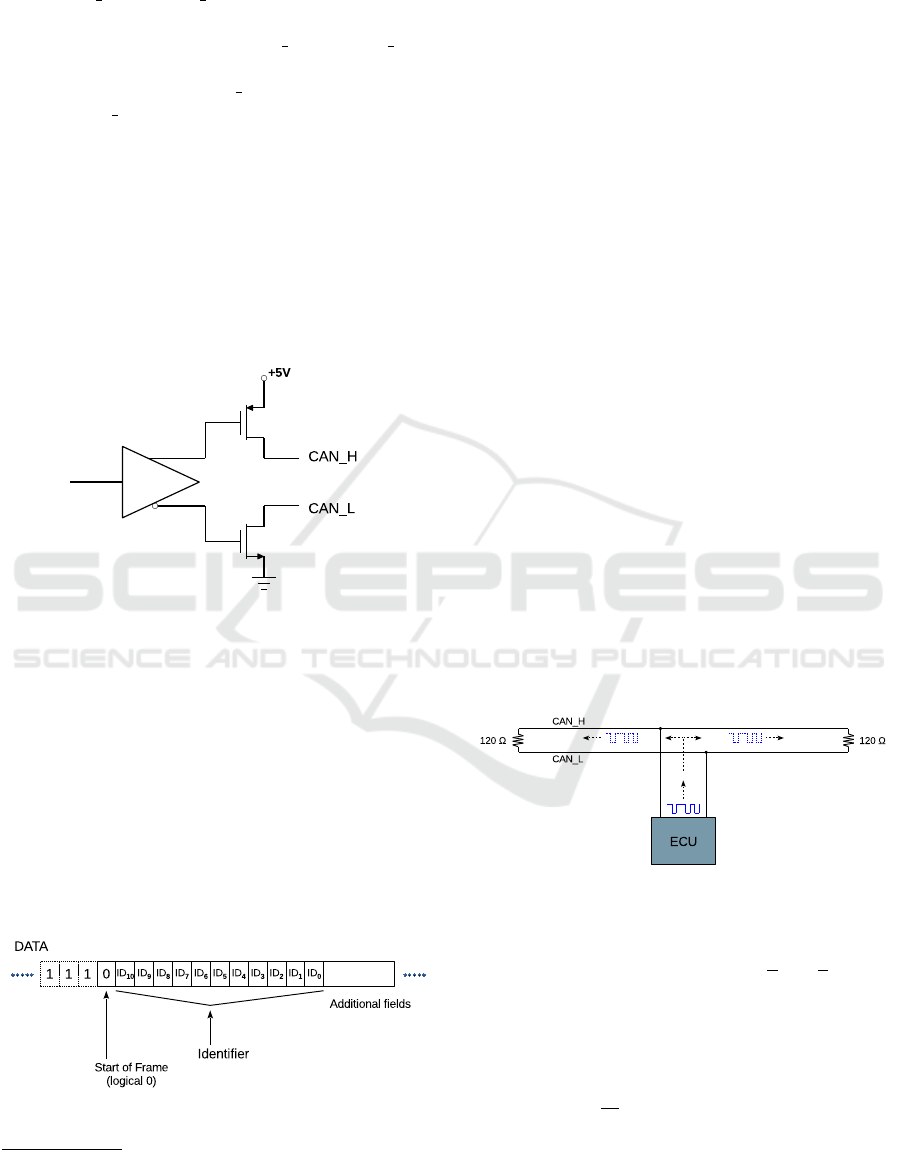
The bus operation is based on a “wired AND”
mechanism where any device connected to the bus
can either assert a logical 0, or release the bus to im-
plicitly bring its logical state to 1 (unless some other
device is asserting a logical 0). Thus, a CAN driver
typically features two “open-collector” connections to
drive its outputs, as shown in Figure 1.
Figure 1: Simplified Diagram of a CAN Driver.
Arbitration of the bus is done by the devices them-
selves: the ID field in a CAN frame (see Figure 2)
represents the priority of the transmission.
2
Lower
numeric values represent higher priority. As a device
D transmits its ID, it monitors the bus. Since the ID is
transmitted MSB to LSB, a logical 0 on the bus while
D transmits a logical 1 means that some other device
is transmitting a lower ID value, and thus has higher
priority. This condition causes the device D to abort
its transmission and release the bus. We omit any de-
tails about retransmission attempts and other related
issues, as these are not relevant to our work.
Figure 2: Start of a CAN Base Frame.
2
For simplicity, we only show the Base frame format,
with an 11-bit ID; the principle applies identically to ex-
tended frames (29-bit ID), but the details are not relevant.
2.2 Transmission Lines
In the context of electronic circuits, electrical sig-
nals are waves that travel through transmission
lines — conduits that guide the propagation of the sig-
nal. Simple examples of transmission lines are cables,
including coaxial cables and twisted-pair.
Transmission lines have a so-called characteris-
tic impedance, which affects, among other things, the
speed at which the signal travels (Blood, W. R., Jr.,
1988). Like with mechanical waves or light, a dis-
continuity in the characteristic impedance causes part
or all of the wave to be reflected. This can be visual-
ized from the perspective of energy transmission. An
unterminated (open) transmission line involves inabil-
ity to maintain the signal propagation after a certain
point; the signal is thus reflected. On the other hand, a
resistive element with a resistance value that matches
the characteristic impedance of the wave leads to the
energy being absorbed without reflection.
Twisted-pair cables used in CAN have a nominal
characteristic impedance of 120 Ω. Thus, the bus is
terminated on both endpoints with 120 Ω resistors, to
minimize reflections. This is done for signal integrity
purposes, as reflected signals would be superposed
to the original signal causing spurious noise-like ar-
tifacts. Also related to this aspect is a detail that is
relevant to the operation of our proposed technique: if
a device “tapping” into a twisted-pair cable transmits
a signal, this signal travels in both directions, mov-
ing outwards from the point where the transmission
originates. These aspects are illustrated in Figure 3.
Figure 3: CAN Transmission Line with Termination Resis-
tors.
The speed of signals in unloaded transmission
lines can be typically in the order of
1
2
c or
1
3
c, where
c is the speed of light in vacuum. This speed can be
reduced by a considerable factor if the line is loaded,
due to the input capacitance of the connected de-
vices (Blood, W. R., Jr., 1988). In our experimen-
tal measurements, we observed a propagation speed
in the order of
1
10
c (this is an estimate, as the vehi-
cle’s specifications available to us do not provide ex-
act lengths of the cables).
ICISSP 2019 - 5th International Conference on Information Systems Security and Privacy
598

3 OUR PROPOSED TECHNIQUE
This section describes the details of our proposed
technique, including our threat model and assump-
tions, operation and novelty of the technique, and a
description of the analog processing scheme to reduce
the computational requirements of our technique.
3.1 Threat Model and Assumptions
In our attack model, we assume that an attacker may
be able to exploit some security vulnerabilities on
some ECUs, and want to use these to transmit crafted
data that would disrupt the functionality of the sys-
tem as a whole. Such transmissions in general require
specific IDs, which ties them to specific ECUs.
To simplify the presentation, we will assume that
the attacker has a particular target ECU, denoted E
T
,
that is otherwise secure (i.e., the attacker does not
have access to any exploitable vulnerabilities in E
T
)
and wants to send crafted data that is logically valid
but may cause E
T
, and presumably the vehicle, to de-
viate from normal/correct operation. For example,
E
T
could be the engine control unit, and the attacker
could use other (compromised) ECU(s) to inject false
speed and temperature data that may result in over-
heating or damage to the engine.
Our threat model includes an attacker with the fol-
lowing concrete capabilities:
• Control Existing ECUs: An attacker can com-
promise (in particular, hijack control) some other
ECU(s) on the same CAN bus where the tar-
get ECU, E
T
, is. For example, some ECU E
B
could exhibit unintended connectivity combined
with vulnerabilities that allow an attacker to ex-
ecute arbitrary code on E
B
or even reprogram its
firmware.
• Add ECU(s) to the Bus: An attacker may gain
temporary physical access to the CAN bus where
E
T
is, and connect an arbitrary device (e.g., an
ECU with custom firmware designed by the at-
tacker) to the bus.
3.1.1 Assumptions and Limitations
Our work relies on the following assumptions:
• ECU Capabilities: Any ECU can transmit arbi-
trary data with arbitrary IDs. Though this does not
occur during normal operation, this assumption
emphasizes the aspect that a compromised ECU
E
C
can, under the attacker’s control, transmit any
arbitrary message, including any arbitrary ID.
• Secure Monitor: An implementation of our
proposed technique is assumed to be secure and
tamper-proof, possibly physically isolated from
any CAN bus and any of the vehicle’s ECUs.
• Classes of Attacks Detected: Our proposed
technique is limited to detect impersonation at-
tacks. If an ECU E
C
transmits malicious data with
IDs that legitimately correspond to E
C
, our sys-
tem will not detect any anomalous or suspicious
behavior.
3.2 Proposed Technique – Biangulation
to Authenticate Sender
Figure 4 illustrates the basic idea behind our proposed
technique. The ECU transmits a message which prop-
agates to the left (wave ω
L
) and to the right (wave ω
R
).
Two analog differential amplifiers at two different po-
sitions on the bus measure each of these signals, ob-
taining differential voltages v
L
and v
R
. In the diagram,
the amplifiers are near the bus’ endpoints, which is
the optimal configuration; however, as we will dis-
cuss shortly, other configurations may also work.
In the example in Figure 4, we see that the sig-
nal ω
L
arrives at its corresponding analog differential
amplifier before the signal ω
R
. This indicates that the
transmission originates on the left half of the CAN
bus. If we assume a constant propagation speed (in-
dependent of the position along the cable), then:
Let v be the speed (magnitude) at which the sig-
nals travel through the CAN bus; let x
0
be the posi-
tion at which the ECU connects to the bus; let x
L
and
x
R
be the positions of the connections to the left and
right differential amplifiers, respectively (by conven-
tion, x
L
< x
0
< x
R
); let τ
L
and τ
R
be the additional
time that it takes from the connection at the CAN bus
to the inputs of the time shift measurement subsystem
(these are fixed values, since the lengths and geome-
try of the wires involved and the propagation delays
through the differential amplifiers are fixed). Then,
the time shift ∆t , t
R
− t
L
is:
∆t =
x
R
− x
0
v
+ τ
R
−
x
0
− x
L
v
+ τ
L
=
x
R
+ x
L
− 2x
0
v
+ τ
R
− τ
L
(1)
The time shift is an injective function of x
0
, the
position of the ECU on the bus. Thus, the position x
0
is a function of the time shift. In the more general
case of a speed that is a function of the position x
Sender Authentication for Automotive In-Vehicle Networks through Dual Analog Measurements to Determine the Location of the
Transmitter
599
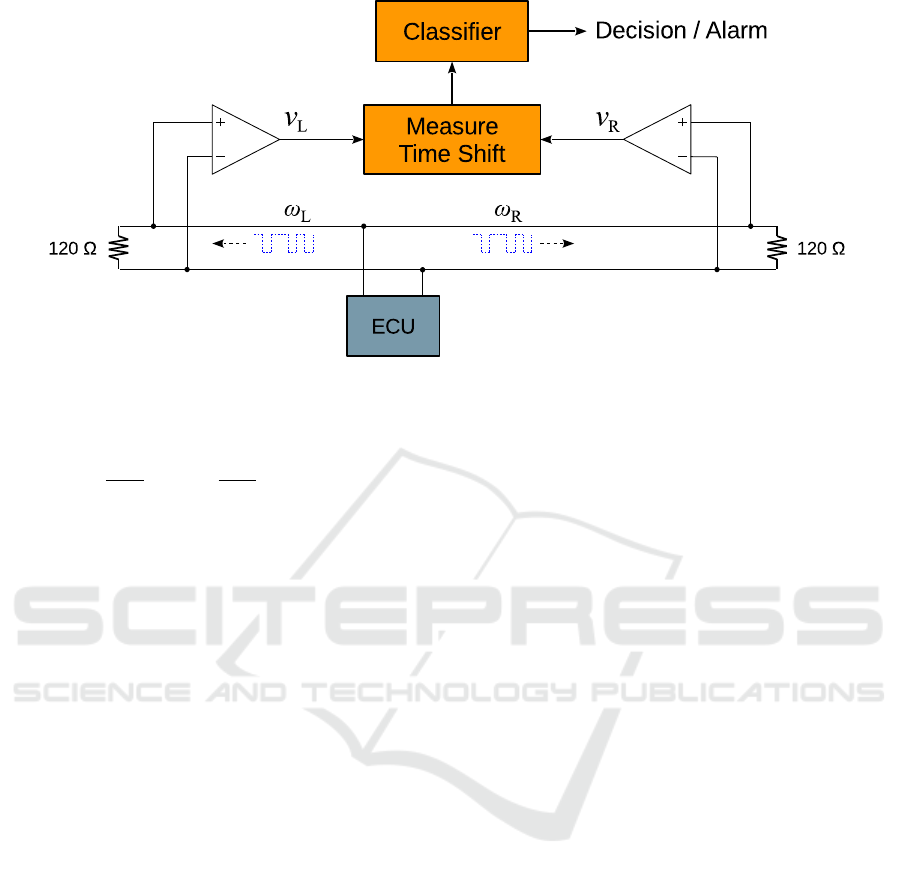
Figure 4: Biangulation System Diagram.
along the cable, v(x), the time shift is:
∆t =
x
R
Z
x
0
1
v(x)
dx −
x
0
Z
x
L
1
v(x)
dx + τ
R
− τ
L
(2)
Since v(x) > 0, in this general case the time shift
is also an injective function of the position x
0
. This is
the case since the first integral term, corresponding to
the cable fragment on the right, is a monotonically de-
creasing function of x
0
, and the second integral term
is a monotonically increasing function of x
0
. Like in
the simplified case of constant speed, the position x
0
is a function of the time shift ∆t — albeit, an exceed-
ingly difficult function to compute in practice.
This brings us to an important aspect in a practical
implementation of our technique, including our proto-
type implementation for this work: we do not need to
explicitly obtain the value of x
0
given a measurement
of the time shift for a given transmission. The fact
that x
0
is a function of ∆t means that we can profile
this function through measurements of the time shift
for messages sent by each ECU. Thus, the classifier is
a simple algorithm that compares the given time shift
against a set of ranges. These ranges are obtained dur-
ing a training phase where we profile the time shifts
for the various ECUs.
3.2.1 Optimal Location of the Measurement
Points
The optimal location of the measurement points
x
L
and x
R
is given by any configuration such that
x
L
< x
k
< x
R
∀ k ∈ [1, N], where x
k
is the position of
the k
th
ECU and N is the number of ECUs on the bus.
This is clearly the case: if ECUs are connected out-
side the cable segment between x
L
and x
R
, then it is
no longer the case that the time shift is an injective
function of the position where a transmission origi-
nates. More formally, if the domain of this function is
not restricted to the interval between x
L
and x
R
, then
the function is not injective. Thus, the position is not
a function of the measured time shift. It is straightfor-
ward to show that this is the case: signals originating
at x
R
+ x (x > 0) produce the same time shift, inde-
pendently of x. Similarly for signals originating at
x
L
− x.
If at most one ECU on each side is allowed out-
side the interval (x
L
, x
R
), then the configuration still
works. However, x
L
and x
R
further away means that
the positions of the ECUs (and thus the values of the
time shifts) are spread out over a larger range, which
leads to potentially better accuracy of the detector.
3.2.2 Attack Prevention
As briefly mentioned in Section 1, our technique can
be used to block transmissions subject to sender im-
personation, and not just detect them. The informa-
tion necessary to determine the time shift — and thus
the legitimate sender — is available as early as at the
first edge of the start bit. The claimed sender is known
at the end of the ID field. Thus, a mismatch is de-
tected at this point. Given the “wired AND” nature of
the bus, the detector can disrupt the remainder of the
message to make it invalid and make all other ECUs
discard it. This can be accomplished, e.g., by assert-
ing one or several logical 0’s to cause the checksum
field to mismatch the message’s contents.
Engineers implementing this idea should exercise
extreme caution. False positives or otherwise incor-
rect decisions to block transmitted messages could
have severe safety implications, depending on the
criticality of the blocked messages.
ICISSP 2019 - 5th International Conference on Information Systems Security and Privacy
600

3.2.3 Optimizations
To measure the time shift, our implementation as part
of this work simply digitized both signals (v
L
and v
R
)
and processed them off-line. The sampling has to
be done at a high enough rate to be able to measure
the small time shifts. This imposes a computational
workload that may be too heavy for a practical im-
plementation. The following subsections present two
approaches to optimize the technique that are reason-
ably easy to implement.
3.2.4 Sampling During a Small Interval around
the Signal’s Edge
A key observation that can lead to an important op-
timization is that we only need to process the digi-
tized signals during a short interval around the edge.
For example, an external simple edge detecting circuit
could trigger the sampling and data processing. Al-
ternatively, the system could sample continuously at
high frequency, sending the samples through a (circu-
lar) FIFO buffer, enabling the processing only when
an edge is detected.
3.2.5 Analog Processing
Another important optimization could result from the
use of analog circuitry to measure the time shift. We
start with a simplified model of the signals, with
v
L
(t) = 2∆v u(t − t
0
) and v
R
(t) similarly defined.
u(t) is the unit step function:
u(t) =
(
0 t 6 0
1 t > 0
(3)
Without loss of generality, let us assume that the
ECU is on the left half of the cable (like in the exam-
ple in Figure 4), and let us define t = 0 as the time
of arrival of the edge (a transition) of v
L
to the time
measurement subsystem. Then:
∆t ∝
δ
Z
0
(v
R
(t) − v
L
(t)) dt (4)
for some δ sufficiently small that the integration in-
terval does not cover more than one edge, and also
sufficiently large that it covers the edges in both v
R
(t)
and v
L
(t).
3
One can simply approximate the integral with a
resistor-capacitor circuit, as illustrated in Figure 5,
3
Given the speeds of the CAN bus (up to 1 Mbps), the
time shift is always much smaller than the duration of a bit
in the transmission.
observing that a strict integration operation is not re-
quired; the relevant characteristic of the integral is
that during the time shift, when v
R
(t) − v
L
(t) > 0,
the integrated signal’s value increases at a constant
rate. Given our goal of exploiting the fact that the
Figure 5: Resistor-Capacitor Circuit to Approximate Inte-
gration.
position of the sender is a function of the measured
time shift, we only require a monotonically increas-
ing transformed signal. This guarantees that the value
of that transformed signal is an injective function of
the time shift, and thus the time shift is a function of
that value. The output of a resistor-capacitor circuit
meets this requirement, as illustrated in Figure 5. In
the figure, the time shift is a function of the peak value
of the output signal v
o
. If the shift is reversed (i.e., if
v
L
is delayed with respect to v
R
), then v
o
would take
negative values and the value with highest magnitude
is what determines the time shift.
4 EXPERIMENTAL EVALUATION
In this section we describe our experimental setup,
and present and discuss the results.
4.1 Setup
The main goal of our experimental evaluation is to
confirm the feasibility and practicality of our pro-
posed technique. Thus, we implemented the ana-
log measurement devices (custom designed for this
work), and created a proof-of-concept implementa-
tion of the time shift measurement subsystem. We
did not explicitly implement the classifier / detector,
as the results for the time shift measurement imple-
mentation directly provide a reasonable prediction of
the performance of such a classifier.
The fundamental unknown that our experimental
evaluation needs to answer relates to the precision of
the measurements in a real vehicle, given limiting fac-
tors such as variations in the transmission line and
speed, measurement noise and resolution, etc. This
aspect determines the applicability of our technique
in practice, since it determines how narrowly our tech-
nique can obtain the position of the transmitting ECU,
Sender Authentication for Automotive In-Vehicle Networks through Dual Analog Measurements to Determine the Location of the
Transmitter
601
and thus, whether ECUs can be distinguished from
each other based on their positions.
4.1.1 Vehicle Instrumentation
We instrumented one of the CAN buses of a Lexus
RX-450H with two analog differential amplifiers. We
selected the vehicle’s CAN 2 bus, since that one is
accessible at a reasonably low level of difficulty, and
without an excessive risk to result in damage to the
vehicle. CAN 2 runs from the dashboard (left and
below the steering wheel) to the back of the vehicle.
Approximate measurements indicate a distance of
2 m between the two analog differential amplifiers.
The largest time-shift measured in the experiments
was around 70 ns, suggesting an average speed of
1
10
c
(assuming that this largest time shift corresponds to
the distance between the two analog measurements).
For the purpose of demonstrating applicability of
the technique at low cost, we used a Texas Instru-
ments OPA211 operational amplifier in a standard dif-
ferential amplifier configuration (Horowitz and Hill,
2015). To confirm that the bandwidth of this ampli-
fier (45 MHz, with a slew-rate of 27 V/µs) is sufficient
to faithfully reproduce the transitions (sharp transi-
tions involve significant contents of high frequencies),
we repeated the measurements using a high-frequency
current feedback operational amplifier, the Analog
Devices ADA4927, with a bandwidth of 2.3 GHz and
a slew-rate of 5000 V/µs. The design of our high-
speed amplifier included higher-grade circuit board
design and manufacturing, including impedance con-
trol. The measurements with this ultra high-speed
amplifier resulted in essentially identical time-shift
values, compared to those obtained with the lower-
end alternative. This confirmed the applicability of
lower cost solutions to implement our technique.
The output of the analog measurements are sent
to 50Ω coaxial cables connecting to the inputs of
an AlazarTech ATS9462 Digitizer card, with two-
channel simultaneous capture at 16-bit and a maxi-
mum sampling rate of 180 Msps. In practice, due to
internal bus and hard disk bandwidth, we found a safe
upper limit of 100 Msps, which is the capture speed
we used in our experiments.
The cables going from the CAN bus connections
to our amplifier boards had matching lengths, and
the coaxial cables were identical (commercial off-the-
shelf 6-feet cable assemblies). This means that in our
setup, the values τ
L
and τ
R
were identical. This is not
necessary and does not improve the effectiveness or
any metrics of the technique, but it can potentially
help facilitate verification of certain results, by re-
moving one unknown (the difference τ
R
− τ
L
) from
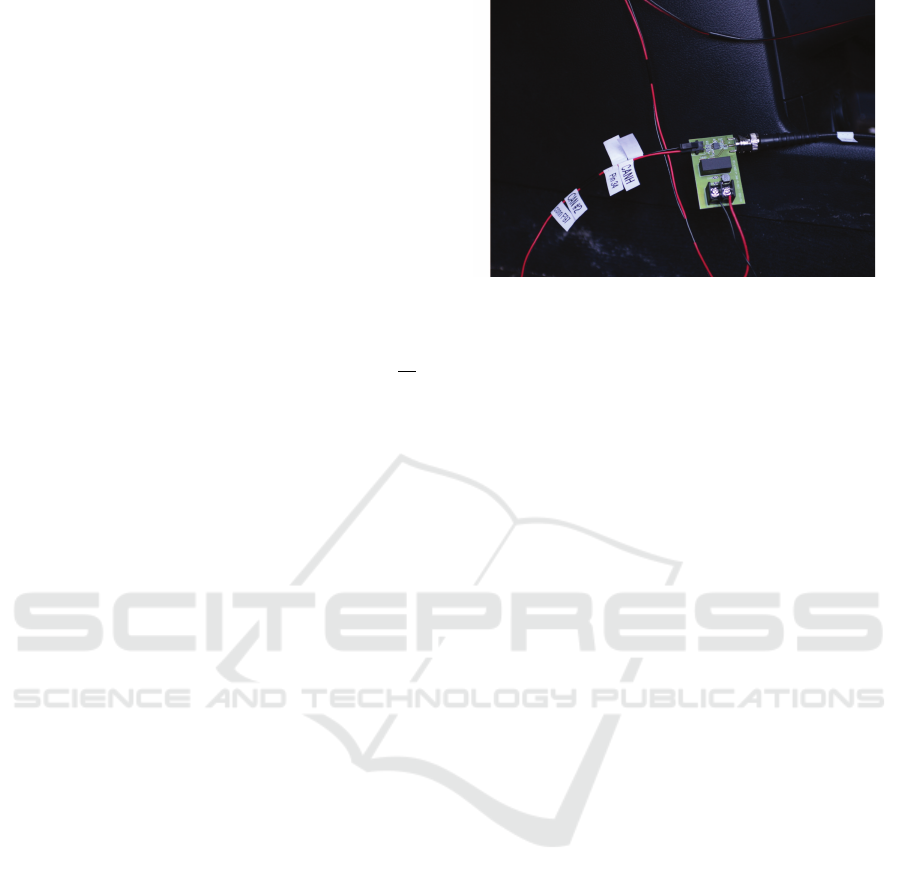
Figure 6: Analog Measurement Board and Connections.
the model. Figure 6 shows a photograph of our board
and its connections in our setup.
4.2 Results
With the setup as described in Section 4.1, we cap-
tured a little more than 800 000 CAN frames, during
a total time of approximately 2 hours. These cap-
tures include transmissions with the vehicle off, vehi-
cle idling (parked), and while driving the vehicle, in-
cluding inside our campus and on public roads. Dur-
ing all of the periods, we tried to exercise as many
vehicle features as possible: while parked, we re-
peatedly opened and closed all windows, adjusted the
seats positions, changed the A.C. and fan speed set-
tings. During the driving period, in addition to the
normal activity, we enabled the driver-assistance fea-
tures: adaptive cruise-control, parking assist (when
parking, we intentionally passed close to objects, and
approached front and rear objects such that the park-
ing assist alarms would beep). This was done with
the goal to make as many different ECUs as possible
transmit data that we would capture.
We isolated the frames from the captured analog
waveforms, and decoded them (only the IDs) through
custom programs that we created for these experi-
ments. This was clearly the simplest approach: using
a separate tool to capture and decode CAN messages
would have introduced the difficulty of synchronizing
the output of such tool to our analog captures. Fig-
ure 7 shows an example of the start of a CAN frame,
including both analog measurements (corresponding
to v
L
and v
R
, labeled as per Digitizer input channel)
to show the time shift (in this case, approximately 7
samples, corresponding to 70 ns).
To determine the time shift, we used the numerical
approximations of the second derivatives to find the
inflection point in each of the measurements (Press
et al., 1992). The inflection point provides a precise
representation of the position of the edge. We interpo-
ICISSP 2019 - 5th International Conference on Information Systems Security and Privacy
602

-0.5
0
0.5
1
1.5
2
1000 1200 1400 1600 1800 2000 2200 2400 2600
Differential Voltage (V)
Time index
Channel A
Channel B
(a) Start of CAN Frame – Dual Measurement
0
0.2
0.4
0.6
0.8
1
1.2
1.4
1.6
1020 1040 1060 1080 1100 1120
Differential Voltage (V)
Time index
Channel A
Channel B
(b) Detail of Start Bit Showing Time Shift
Figure 7: Example of Analog Capture of a CAN Frame.
lated the values of the second derivatives, allowing us
to determine the location of the inflection points with
sub-sample resolution.
Vehicle’s manufacturers in general (and in our
specific case as well) do not disclose information
about CAN transmissions. In particular, the corre-
spondence between ECUs and CAN frame IDs is not
publicly known. However, since the ID field is used
for bus arbitration, we have the guarantee that each
ID uniquely corresponds to an ECU (that is, differ-
ent messages with the same ID field are guaranteed
to be transmitted from the same ECU
4
). We observe
that the converse does not hold: one ECU can be the
sender that corresponds to multiple IDs.
Thus, we measured the time shift for each transmis-
sion and grouped them by ID to compute mean and
standard deviation. The standard deviation relates to
the precision of the measurement, and ultimately de-
fines the range of uncertainty for the position of the
sender. Since one ECU can have multiple IDs associ-
ated to it, we clustered the time shifts for IDs where
ranges had a significant overlap. Table 1 shows the
results for the four observed clusters.
Table 1: Statistics for Each Cluster of Time Shifts.
Cluster # of Samples Mean (ns) Std. Dev. (ns) Std. Dev (cm)
1 939 -62.9357 3.42349 10.2705
2 55357 2.28171 3.7476 11.2428
3 4067 41.6689 1.99615 5.98845
4 754202 68.9884 2.22483 6.67448
The standard deviation is reported both in time
units and in space units, using the estimated average
speed,
1
10
c. This relates to the uncertainty in the loca-
4
Under normal operation, without malicious devices im-
personating other ECUs.
0
0.2
0.4
0.6
0.8
1
1.2
-50 0 50 100
Normalized Histogram
Time shift (ns)
Clst. 1
Clst. 2
Clst. 3
Clst. 4
Figure 8: Normalized Histograms for the Time Shift Clus-
ters.
tion of the ECU. Table A1 in Appendix A shows the
complete listing of mean and standard deviation for
each distinct ID.
Figure 8 shows the normalized histograms for
each of the clusters. We normalized them since, as
can be seen in Table 1, the number of samples for
cluster 4 is large compared to the other clusters, so
those would not be visible in the combined histogram.
The results confirm the feasibility of our proposed
technique: our proof-of-concept implementation is
able to narrow down the position of the sender to
within 20 or 30 cm. Regarding the vehicle’s config-
uration, the fact that the clusters are narrow relative
to the distance to other clusters means that our tech-
nique can reliably distinguish senders from each of
these four sources with high accuracy. For example,
for the two closest clusters (3 and 4), a boundary value
in the middle point is at more than 6 standard devia-
tions from either mean; hence the probability of mis-
classification is negligible. Moreover, the histograms
suggest that each cluster does indeed correspond to
a single location of the sender, as each cluster looks
reasonably close to a single bell shape.
5 DISCUSSION AND FUTURE
WORK
The main difficulty with the experimental evaluation
was the lack of available documentation and details
about the CAN bus and ECUs. Vehicle manufactur-
ers in general do not disclose any details on these.
In particular, the connection points (x
L
and x
R
) were
not under our control, as we were restricted in terms
of which locations were physically accessible without
causing damage to the vehicle’s wiring or body.
However, the results do show the potential capa-
bilities of our technique: automotive engineers imple-
menting this technique could use the internally avail-
able information to guide the design, and even could
adapt the design and configuration of a vehicle’s CAN
bus to facilitate or to maximize the effectiveness of
our technique. For example, a critical ECU (an ECU
for which false positives are critical), could be placed
Sender Authentication for Automotive In-Vehicle Networks through Dual Analog Measurements to Determine the Location of the
Transmitter
603

such that the distance to other ECUs is maximized.
In terms of future work, many interesting ques-
tions and avenues for future research arise from this
work. In particular:
• J-1939: Heavy vehicles use the J-1939 standard
protocol (a layer above the CAN protocol). With
this protocol, we would have the advantage of be-
ing able to decode the protocol and count on the
“ground truth” for the experimental evaluation.
• Improvements in Performance: We will inves-
tigate the use of multiple edges to average multi-
ple estimates of the time shift and obtain a more
accurate measurement. Though the system can
determine the time shift upon the falling edge of
the start bit, it must wait until the ID has been
transmitted entirely before it can output a deci-
sion. Thus, all of these edges can be exploited to
take multiple measurements.
• On-the-fly Operation: This work produced a
proof-of-concept implementation that captures
data to be processed off-line. We will also work
towards an implementation with on-the-fly opera-
tion. This will provide a much deeper insight into
the practicality of our technique.
6 CONCLUSIONS
We presented a novel technique to identify the sender
in Controller Area Networks. The technique is highly
effective, as it relies on physical characteristics of an
ECU’s transmission that an attacker attempting to im-
personate the ECU cannot mimic. This constitutes an
important advantage over state-of-the-art approaches,
that are conceivably vulnerable to profile-and-mimic
attacks. The work includes an experimental evalua-
tion that confirms the feasibility and practicality of
our proposed technique.
ACKNOWLEDGEMENTS
The authors would like to thank Lorin Maran for his
valuable assistance with the vehicle’s instrumenta-
tion. We would also like to thank Arthur Chung for
his valuable guidance and discussions regarding our
high-frequency board design.
REFERENCES
Blood, W. R., Jr. (1988). MECL System Design Handbook
(HB205/D, Rev. 1A).
Checkoway, S. et al. (2011). Comprehensive Experimental
Analyses of Automotive Attack Surfaces. In USENIX
Security Symposium.
Cho, K.-T. and Shin, K. G. (2016). Fingerprinting Elec-
tronic Control Units for Vehicle Intrusion Detection.
In USENIX Security Symposium.
Cho, K.-T. and Shin, K. G. (2017). Viden: Attacker Iden-
tification on In-Vehicle Networks. In Proceedings of
the 2017 ACM SIGSAC Conference on Computer and
Communications Security, pages 1109–1123. ACM.
Groza, B., Murvay, S., Herrewege, A. V., and Ver-
bauwhede, I. (2017). LiBrA-CAN: Lightweight
Broadcast Authentication for Controller Area Net-
works. ACM Transactions on Embedded Computing
Systems, 16(3):90:1–90:28.
Horowitz, P. and Hill, W. (2015). The Art of Electronics.
Cambridge University Press, Third edition.
Kneib, M. and Huth, C. (2018). Scission: Signal
Characteristic-Based Sender Identification and Intru-
sion Detection in Automotive Networks. In ACM
SIGSAC Conference on Computer and Communica-
tions Security. ACM.
Koscher, K., Czeskis, A., Roesner, F., Patel, S., Kohno, T.,
Checkoway, S., McCoy, D., Kantor, B., Anderson, D.,
Shacham, H., et al. (2010). Experimental Security
Analysis of a Modern Automobile. In IEEE Sympo-
sium on Security and Privacy, pages 447–462. IEEE.
McAfee (2015). Automotive Security Best Practices.
Miller, C. and Valasek, C. (2015). Remote Exploitation of
an Unaltered Passenger Vehicle.
Miller, C. and Valasek, C. (2016). Advanced CAN Injection
Techniques for Vehicle Networks.
Mukherjee, S., Shirazi, H., Ray, I., Daily, J., and Gamble,
R. (2016). Practical DoS Attacks on Embedded Net-
works in Commercial Vehicles. In International Con-
ference on Information Systems Security, pages 23–
42. Springer.
Murvay, P.-S. and Groza, B. (2014). Source Identification
Using Signal Characteristics in Controller Area Net-
works. IEEE Signal Processing Letters, 21(4):395–399.
Petit, J. and Shladover, S. (2015). Potential Cyberattacks
on Automated Vehicles. IEEE Transactions on Intel-
ligent Transportation Systems, 16(2):546–556.
Pike, L., Sharp, J., Tullsen, M., Hickey, P. C., and Bielman,
J. (2015). Securing the Automobile: a Comprehensive
Approach. In Embedded Security in Cars (ESCAR)
Conference.
Press, W., Teukolsky, S., Vetterling, W., and Flannery, B.
(1992). Numerical Recipes in C. Cambridge Univer-
sity Press, Second edition.
Robert Bosch GmbH (1991). CAN Specification, Version 2.0.
SAE (2016). Cybersecurity Guidebook for Cyber-Physical
Vehicle Systems.
Sagong, S. U., Ying, X., Clark, A., Bushnell, L., and
Poovendran, R. (2018). Cloaking the Clock: Emu-
lating Clock Skew in Controller Area Networks. In
Proceedings of the 9th ACM/IEEE International Con-
ference on Cyber-Physical Systems, pages 32–42.
Van Herrewege, A., Singelee, D., and Verbauwhede, I.
(2011). CANAuth: A Simple, Backward Compati-
ble Broadcast Authentication Protocol for CAN Bus.
In ECRYPT Workshop on Lightweight Cryptography.
ICISSP 2019 - 5th International Conference on Information Systems Security and Privacy
604

APPENDIX
A Time Shift Statistics
Table A1: Statistics for Time Shift by ID.
ID # of Samples Mean (ns) Std. Dev. (ns) Std. Dev (cm)
0x3ec 517 -62.9444 4.22815 12.6844
0x4d5 418 -62.9343 2.055 6.16499
0x778 4 -61.9638 1.18046 3.54139
0x352 510 2.049 1.69915 5.09745
0x288 10699 2.07594 2.4364 7.30919
0x4cb 510 2.08868 1.60234 4.80703
0x689 517 2.09483 0.915489 2.74647
0x102 16048 2.24681 3.74316 11.2295
0x106 16048 2.29587 4.15473 12.4642
0x4e2 486 2.3409 0.926301 2.7789
0x322 514 2.42082 3.01928 9.05785
0x29a 10025 2.55582 4.4946 13.4838
0x458 2563 41.6105 2.13171 6.39512
0x338 515 41.7426 1.85384 5.56153
0x4d4 473 41.7643 1.38032 4.14096
0x32c 516 41.7982 1.90502 5.71507
0x354 10630 68.0049 8.60718 25.8215
0x0c4 12685 68.6607 5.1656 15.4968
0x308 171 68.7487 4.02203 12.0661
0x623 2003 68.8762 1.30822 3.92467
0x420 510 68.8934 3.36012 10.0804
0x312 5957 68.9101 1.41566 4.24697
0x240 41765 68.9319 2.85064 8.55193
0x376 499 68.9321 1.44252 4.32757
0x0c0 31430 68.943 2.21871 6.65613
0x36e 1719 68.9499 2.13546 6.40639
0x08a 21659 68.9567 2.57982 7.73945
0x388 21789 68.9707 2.43622 7.30867
0x060 21255 68.9721 2.89066 8.67199
0x24e 31136 68.9772 2.40957 7.2287
0x154 42513 68.9832 1.95169 5.85508
0x168 21255 68.9871 2.42942 7.28826
0x378 499 68.9906 1.9579 5.8737
0x192 16069 68.9982 2.09111 6.27334
0x0a4 42528 69.0005 1.83936 5.51808
0x048 21255 69.0045 2.45669 7.37008
0x0a5 55028 69.0131 2.30028 6.90083
0x18c 16070 69.014 2.00657 6.0197
0x280 10600 69.0212 2.02714 6.08142
0x423 510 69.028 1.36729 4.10188
0x620 47568 69.029 1.14065 3.42196
0x360 513 69.0328 1.43671 4.31012
0x621 29903 69.0405 1.07903 3.23708
0x611 1923 69.0411 1.13658 3.40973
0x622 15774 69.0417 1.07541 3.22622
0x45c 146060 69.0443 1.11658 3.34975
0x610 40656 69.0465 1.1081 3.32431
0x624 6178 69.0514 1.06052 3.18156
0x3f2 2042 69.0523 1.38821 4.16462
0x328 1694 69.054 1.38745 4.16234
0x63b 28399 69.0576 1.06894 3.20683
0x627 514 69.0761 1.32297 3.96892
0x770 60 69.0913 1.40259 4.20778
0x678 1981 69.1175 1.147 3.441
0x30c 171 69.124 1.35414 4.06243
0x36c 511 69.1289 1.41421 4.24264
0x362 521 69.1365 1.44882 4.34647
0x7c6 28 69.1534 0.976756 2.93027
0x3cc 171 69.2481 1.38732 4.16197
Sender Authentication for Automotive In-Vehicle Networks through Dual Analog Measurements to Determine the Location of the
Transmitter
605
