
Improvement of Range Resolution of FDMAS Beamforming in
Ultrasound Imaging
Ryoya Kozai, Jing Zhu, Kan Okubo and Norio Tagawa
Graduate School of System Design, Tokyo Metropolitan University, Hino, Tokyo 191-0065, Japan
Keywords:
Reception Beamforming, Super-resolution, Transmission With Frequency Sweep, MUSIC Algorithm.
Abstract:
Ultrasound imaging is applied to various fields because it is noninvasive and real-time imaging i s possible.
However, in diagnosis applications, ultrasound imaging is inferior in resolution to other modalities, so resear-
ches for improving resolution have been actively conducted. Recently, researches on beamforming methods
have been advanced for the purpose of i mproving lateral resolution. In order to form a narrower beam, adap-
tive beamformers such as the MV (minimum variance) beamformer that adaptively changes the beamforming
weights have been proposed, but these methods increase the computational complexity. Therefore, in recent
years, the FDMAS (Filtered-Delay Multiply And Sum) beamformer which can realize high resolution and
high contrast without using complicated calculation attracts attention. On the other hand, we proposed a met-
hod called the SCM (Super resolution FM-Chirp correlation Method) that improves range resolution based on
frequency sweep. In addition, we proposed a new DAS (Delay And Sum) beam former which improves range
resolution by multiplying the echo signal by the result of the SCM before DA S processing. This method is
constructed in the usual RF (Radio Frequency) band. In this study, we first reconstruct the FDMAS as a base-
band processing in order to improve the SNR, and apply the SCM result to the FDMAS in order to improve
both range and lateral resolution.
1 INTRODUCTION
Ultrasound imaging is effectively used for medical
diagnosis (Amy et al., 2015) and non-destructive in-
spection. (Ylitalo, 1996) In p articular, real-time ima-
ging is a major ad vantage of ultrasonic imaging, and
it has been extend e d to applications such as an auto-
mobile obstacle detection system (Shoval and Boren-
stein, 2001) and an indoor po sitioning system. (Ha-
zas and Hopper, 2006) Currently, researches aimed at
improving the pe rformance of ultrasonic imaging are
actively condu c te d, and further improvements are also
expected in the future.
Recent researches on the ultrasonic beamforming
methods have been particularly advanced in the la-
teral resolution. The beamforming method serves as
the basis of array signal processing using a transducer
array composed of a plurality of transducer elements
and is a techniq ue to improve the lateral resolution
by fo rming directivity. The most basic beamforming
method is the DAS (Delay and Sum) (Thome nius,
1996) that compensates for the delay of received sig-
nals between transducer elements of the sensor array
and adds them. However, this technique strongly re-
flects the limitation o f the beam width determined by
the aperture width of the transducer array. In order
to form a narrower beam, adaptive beamformers such
as the MV (Minimum Variance) beamformer (Wang
et al., 2005 ; Vignon and Burcher, 2 008; Holm et al.,
2009) th at adaptively changes the beamforming weig-
hts have been pr oposed, but these me thods incre ase
the computational com plexity. Recently the FDMAS
(Filtered-Delay Multip ly and Sum) beamformer (Ma-
trone et al., 201 5) which can realize high resolu tion
and contrast without complicated calculatio n by using
approximate calculation of correlation between recei-
ved signals of each tra nsducer element attracts atten-
tion. Various extensions of the FDMAS have been
proposed in (Matron e et al., 2017; Matrone et al.,
2018; Su et al., 2018). On the other hand, we pr opo-
sed me thods called the SCM (Super-resolution FM-
Chirp correlation M ethod) (Fujiwara et al., 2009) and
the SA-SCM (Synthetic Ap erture-SCM) (Wada et al.,
2015; Tagawa et al., 2018) to improve the range re-
solution. These methods rea lize super reso lution in
the range direc tion by using the phase inf ormation of
the carrier wave by transmitting and receiving a plu-
rality of pulses with different carrier frequencies. The
SCM utilizes focused pulse tra nsmission and the SA-
SCM is an extension of the SCM to utilized divergent
198
Kozai, R., Zhu, J., Okubo, K. and Tagawa, N.
Improvement of Range Resolution of FDMAS Beamforming in Ultrasound Imaging.
DOI: 10.5220/0007583601980205
In Proceedings of the 14th International Joint Conference on Computer Vision, Imaging and Computer Graphics Theory and Applications (VISIGRAPP 2019), pages 198-205
ISBN: 978-989-758-354-4
Copyright
c
2019 by SCITEPRESS – Science and Technology Publications, Lda. All rights reserved

pulse transmission for th e purpose of inc reasing the
frame rate. The SA-SCM transmits divergent pulses
and applies the SA processing (Jensen et al., 2006),
for example the DAS, as a reception beamformer to
echoes received by all transducer elements. After cal-
culating each line signal, resolution is improved by
applying the SCM. Since the SCM is a processing for
each imag e line, discontinuities tend to occu r in the
lateral direction. In order to solve this problem, we
first applied the SCM to the received echo of each ele-
ment, and multiply the received echo by th e result to
generate the echo signal with high range resolution.
After that, by applying the DAS to th e obtain e d high-
resolution echoes, we constructed a beam former cal-
led the SCM-weighted SA, in which lateral discon-
tinuities do not occur. (Zhu and Tagawa, 2018)
In this study, we aim to improve the lateral resolu-
tion based o n the FDMAS. First, by reconstructing the
FDMAS as baseban d processing, it is possible to use
not only the frequency band of twice the transmission
frequency used in the FDMAS but also the tran smis-
sion frequency band. SNR (Signal-to-Noise Ratio) is
expected to be improved by using this baseband FD-
MAS. Since the SCM is exe c uted in baseband, the
result of the SCM can be efficiently incorporated into
the baseband FDMAS. By this new beam former, in
which the SCM results are used as the same way of
the SCM-weighted SA. we simultane ously impr ove
both range and lateral resolution.
2 METHOD
2.1 Super-Resolution FM-Chirp
Correlation Method
In this section, we explain the principle of the SCM.
We transmit a FM-chirp pulse s(t) = Re[x(t)e
jω
0
t
]
with a center frequency of ω
0
, and r e ceive the echo
signal y(t) in RF-band from D point scatterers, which
is mathematically expressed as
y(t) =
Z
∞
−∞
h(τ)s(t − τ)dτ, (1)
h(t) =
D
∑
i=1
h
i
δ(t − τ
i
), (2)
where h
i
is the set of the amplitudes of reflections in
all the scatterers, τ
i
is set of pro pagation delay time s
of echoes of all scatterers, and δ(·) is the Dira c delta
function. The received FM-chirped echo is expressed
as a baseband analytic signal v(t), and a compressed
Figure 1: Example of FM-chirp pulse compression: (a)
transmitted signal s(t) with 8 MHz bandwidth and wit h
Hanning window apodization; (b) absolute value of com-
pressed signal r(t).
signal is formulated as z(t), which are
v(t) =
D
∑
i=1
h
i
x(t − τ
i
)e
− jω
0
τ
i
+ n(t), (3)
z(t) =
D
∑
i=1
h
i
r(t − τ
i
)e
− jω
0
τ
i
+ m(t), (4)
where r(t) is the autocorrelation function of x(t) in
the baseband th at takes complex values, and hence,
z(t) is the complex valued delay profile. The observa-
tion noise n(t) is assumed to be Gaussian white noise
restricted to baseband with variance σ
2
, and hence,
m(t) is the complex value cross-correlation of x(t) and
n(t). An example of FM-chirp pulse compression is
shown in Fig. 1.
Equation 4 shows that the echo from each scatte-
rer has a phase that depends on the carrier frequency
ω
0
and the scatterer position. Therefore, by receiving
echoes of different carrier frequencies, it is possible
to separate scatterers based on phase information. Fi-
gure 2 shows an example of the phase informa tion
obtained by different frequency transmission.
The MUSIC (MUltiple SIgnal Classification) al-
gorithm (Schmidt, 1986; Zhou et al., 2008) is used
for super-resolution processing of the SCM. As a d is-
crete representation, we define a compressed echo
vector z
z
z ≡ [z(t
1
),z(t
2
),··· ,z(t
M
)]
⊤
, a steering vec-
tor r
r
r
i
≡ [r(t
1
− τ
i
),r(t
2
− τ
i
),··· ,r(t
M
− τ
i
)]
⊤
indica-
ting the compressed echo of the i th scatterer, and a
noise vector m
m
m ≡ [m(t
1
),m(t
2
),··· ,m(t
M
)]
⊤
with M
the number of time sampling. Using an array ma-
nifold matrix Γ
Γ
Γ ≡ [r
r
r
1
,r
r
r
2
,· ·· ,r
r
r
D
]
⊤
and a gain vector
g
g
g ≡ [h
1
e
− jω
0
τ
1
,h
2
e
− jω
0
τ
2
,· ·· ,h
D
e
− jω
0
τ
D
]
⊤
, z
z
z and its
variance covariance matrix R
R
R can be formulated as
z
z
z = Γ
Γ
Γg
g
g + m
m
m, (5)
Improvement of Range Resolution of FDMAS Beamforming in Ultrasound Imaging
199
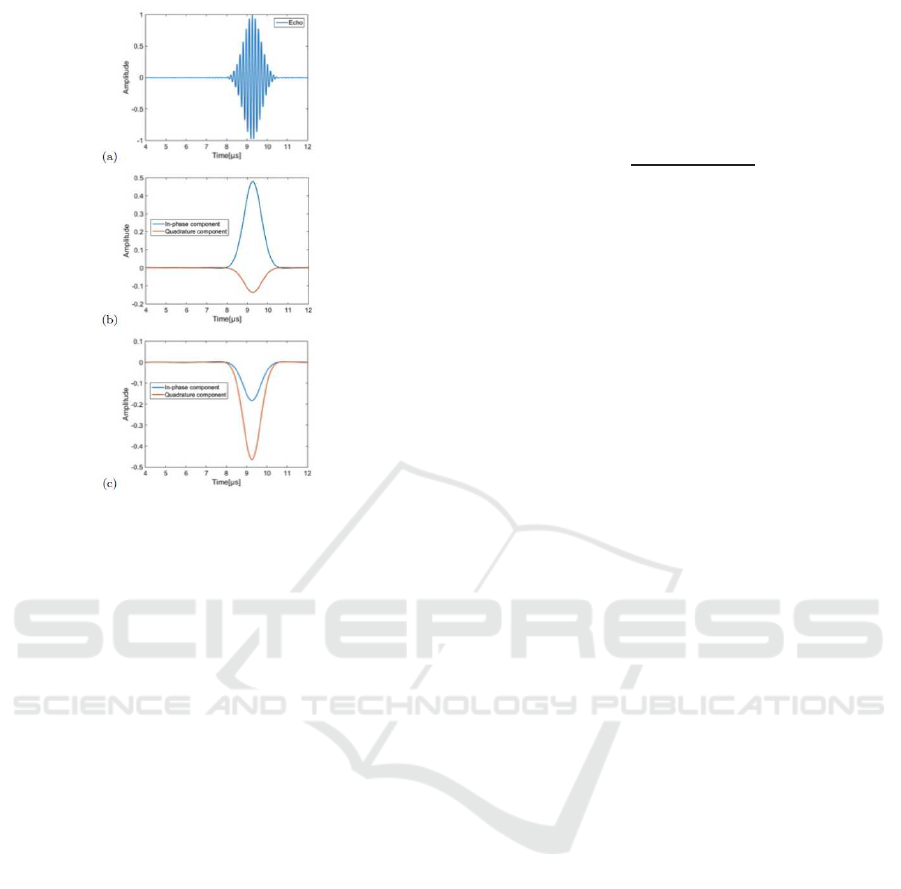
Figure 2: Phase information obtained by transmitting multi-
ple pulses having different frequencies: (a) example of com-
pressed FM-chirp echo; (b) I (In-phase) and Q (Quadrature-
phase) components of z corresponding to (a); (c) I and Q
components for different frequency transmission.
R
R
R = Γ
Γ
ΓG
G
GΓ
Γ
Γ
⊤
+ R
R
R
n
, (6)
G
G
G ≡ E
ω
0
[g
g
gg
g
g
H
], (7)
R
R
R
n
≡ E
n
[m
m
mm
m
m
H
] = σ
2
R
R
R
0
, (8)
where E
ω
0
[·] and E
n
[·] indicate the expectation opera-
tors with respect to ω
0
and E
n
[·] and with respect to
n(t) respectively by assuming that echoes and obser-
vation noise are statistically independen t. The Her-
mitian matrix R
R
R
0
consists of r(t), a nd the (k,l)th ele-
ment is r(t
k
− t
l
). The superscript H mea ns complex
conjuga te transpo se. In the SCM proce ssing, it is ne-
cessary to solve the generalized eigenvalue problem
of the following equation to ob tain eige nvalues λ
i
and
eigenvectors e
e
e
i
.
R
R
Re
e
e
i
= λ
i
R
R
R
0
e
e
e
i
, i = 1, 2,· ·· , M. (9)
When M > D, the column vectors of Γ
Γ
Γ are linearly in-
dependent, and hence, the ra nk of R
R
R − R
R
R
n
= Γ
Γ
ΓG
G
GΓ
Γ
Γ
H
is
D. Therefore, R
R
R has D g e neralized eigenval ues grea-
ter than σ
2
and M − D generalized eig envalues equal
to σ
2
. The set of D eigenvectors {e
e
e
i
}
D
i=1
correspo n-
ding to the largest D eigenvalues spans the signal sub-
space. The remaining M − D eigenvectors {e
e
e
i
}
M
i=D+1
span the noise subspace that does not contain signals.
The noise subspace is orth ogonal to the steering vec-
tor corresponding to the true delay time of the echo.
In order to estimate the arrival time of the reflected
wave from the scatterer, the orthogonality between the
steering vector and the noise subspace is evaluated by
changin g the delay time of the steering vector as a
super-resolution dela y profile S(t
i
) defined as
S(t
i
) ≡
r
r
r
H
i
R
R
R
−1
0
r
r
r
i
∑
M
j=D+1
|r
r
r
H
i
e
e
e
j
|
2
. (10)
If t
i
matches the actual position of the scatterer, the
correspo nding r
r
r
i
is orthogonal to {e
e
e
j
}
M
j=D+1
, and
hence, the d e nominato r of Eq. 10 becomes small.
In this scheme, D must be the number of scatte-
rers, and in practical applications, for example, the
Akaike’s I nformation Criteria (AIC) or the Minimum
Description Length (MDL) criteria are used to deter-
mine D.
In this study, in order to avoid artifacts through
periodicity, we randomly changed the transmission
wave frequency. With K transmissions having a rand-
omly shifted freq uency band, we estimate R
R
R as an en-
semble average of
ˆ
R
R
R = (
∑
K
k=1
z
z
zz
z
z
H
)/K.
2.2 Synthetic Aperture-SCM
The SCM performs super-resolution processing for
each imag ing line. For that purpose, it is necessary
to transmit multiple FM chirp pu lses having different
frequency bands in each direc tion corresponding to
each imaging line; see Fig. 3 (a). If the image con-
sists of N lines and K times of transmissions are per-
formed in each direction, N × K transmissions must
be ma de to generate the whole image. This extremely
decreases the frame rate when super-resolution is per-
formed on the entire imaging area. In order to solve
the problem, the SA-SCM is realized by incorpora-
ting the SAI (Synthetic Aperture Imaging ) into the
SCM. In the SAI, unfocused pulses are transmitted
in a wide ran ge from sub-aperture elements [Fig. 3
(b)], and for each tr ansmission, echoes from the en-
tire imaging area are received simultaneously by all
the elements and rec eive beam forming is applied. By
randomly changing the frequency band of each trans-
mitted FM-chirp pulse in the SAI, the total number of
the transmissions is reduced. The above-men tioned
N × K times of transmission in the SCM is realized
by only K transmissions in the SA-SCM. Multiple
line signals with different frequencies for each line
are input to the SCM process. To avoid fr equency de-
viation re la te d to the position of the sub-aperture for
transmission, a freque ncy band is randomly assigned
to the position of the sub-apertu re.
VISAPP 2019 - 14th International Conference on Computer Vision Theory and Applications
200

Figure 3: Transmission procedure: (a) SCM; (b) SA-SCM.
2.3 SCM-Weighted SA
Since the SCM is executed for each image line, dis-
continuities tend to occur in the lateral direction. In
order to solve the problem, w e proposed a new DAS
incorporating th e SCM re sults. In this method, the
SCM is firstly applied to the echoes received by each
element before the DAS processing. Although it is
possible to apply the DAS to the SCM result, i.e., S(t)
defined by E q. 10, sin c e S(t) does no t include phase
informa tion, suppression of unwanted signals using
phase mismatch is not done. By multiplying the re-
ceived RF echo o f each e le ment by S(t), we improve
the range resolution of echo before the DAS b eamfor-
ming and gene rate an image by the DAS. We call this
method the SCM-weigh te d SA. The refore, an image
can be obtain ed for each freque ncy of the transm is-
sion pulse, and it can be used as multispectral infor-
mation, or by integrating all of them, an image with
high SNR can be obtained while avoiding gratin g lo-
bes.
In this m ethod, unlike the SA-SCM, it is necessary
to fix transmission positions of plural transmissions to
the same one in the array transducer. If the transmis-
sion of d ifferent freq uencies is perform ed from dif -
ferent positions, the time position of the correspon-
ding reflected wave will deviate between the echoes
used for the SCM processing, and hence, the SCM
processing can not be executed correctly. This limi-
tation is not a problem for phased array tran sducers.
However, in linear arrays and convex arrays, this li-
mitation is not desirable in order to proper ly measure
the information o f the e ntire imaged area . In order
to avoid this problem, it is sufficient to execute the
SCM-weighted SA for some tran smission positions,
and to do so, apply a method based on the concept of
compressive sensing in (L iu et al., 2018) to reduce the
transmission position is effective.
2.4 High Range-Resolution FDMAS
In this section, we propose the FDMAS in baseband
and a new beamformer with improved its range reso-
lution. In the SCM-weighted SA, the first SCM pro-
cessing uses the pulse-com pressed IQ (In-phase a nd
Quadrature-phase) echoes, whereas the subsequent
DAS beamforming is applied to the pulse-compressed
RF echo, and finally in order to generate the B-mod e
image. Namely, the beamforme d RF signal is conver-
ted to the IQ signal again. Since this series of pro-
cedures is inefficient, the FDMAS should be realized
in baseband when incorporating the SCM results into
the FDMAS.
In the baseband FDMAS, first, time delay of the
pulse-com pressed IQ echo is corrected instead of the
RF echo. In addition, it is necessary to compensate
the phase deviation of th e IQ signal, which is caused
by the time delay correction. The correction amount
is calculated by the following equ ation.
E(n) = exp(iβn
2
), (11)
where β satisfies the relation β = πd
2
/(λR
0
), d is the
pitch between transducer elements, R
0
is the shortest
distance from the transducer arr ay to the targeted ima-
ging point and n is a number correspo nding to each
element of the tr ansducer. The value of n at the shor-
test distance from the imaging point is set to 0. The
phase is cor rected by multiplying the analytic repre-
sentation of the delay-corrected received echoes by
Eq. 11. Figure 4 shows an example of the real part
of Eq. 11 c orresponding to the certain position in the
image. For the setting of Fig. 4, d is set to 0.14 mm, λ
is set to 0.3 mm, R
0
is set to 15 mm and the center ele-
ment of the sensor array holds n = 0. This phase cor-
rection corresponds to Doppler compression p roces-
sing in synthetic aperture r adar and β is called Dop-
pler constant. In the DAS, delay-corrected received
echoes received by all elements are added up, but in
the FDMA S, corrected received echoes are multiplied
by a combination of all pairs and added. Assumin g
that the number of elements used for beam forming is
N, the number of all combinations of the pairs is
N
2
=
N
2
− N
2
. (12)
Physical d imension is cha nged by multiplication, and
therefore processing to restore the dimension is per-
formed. That is
ˆs
i j
(t) = sign (s
i
(t)s
j
(t))
q
|s
i
(t)s
j
(t)|, (13)
where s
i
indicates the IQ signal ( complex number) of
the ith element and sign(x) represents a unit complex
number corresp onding to x. The co rrelation of two
complex signals is generally computed as a complex
conjuga te produ ct, that indicates s
i
(t)
H
s
j
(t) in this
case. However, it was experimentally confirmed that
it is d ifficult to detect the phase d ifference between
Improvement of Range Resolution of FDMAS Beamforming in Ultrasound Imaging
201

Figure 4: Example of real pert of Equation 1 at the certain
position in image.
two signals with little time lag when using s
i
(t)
H
s
j
(t).
On the other hand, if s
i
(t) and s
j
(t) are target sig-
nals without time lag, the product s
i
(t)s
j
(t) becomes a
complex number of the same argument in all element
pairs, and a large signal ca n be obtained by add ing
them together. For pairs with time lag s, we found that
the difference in argument is emphasized, espec ia lly
for irregular signals such as spec kle, the rand omness
of the argument is strongly generated, and cancella-
tion occurs by adding them together. Therefore, in
our method, we adopt s
i
(t)s
j
(t) for multiplying pro-
cessing. It is noted that |s
i
(t)s
j
(t)| = |s
i
(t)
H
s
j
(t)|.
In the original FDMAS, s
i
(t) in Eq. 13 is a real
number (RF signal), and Eq. 13 in this study is a com-
plex version of the original eq uation o f the FDMAS.
From these equations, the signal a fter the ad dition is
y
∗
DMAS
(t) =
N−1
∑
i=1
N
∑
j=i+1
ˆs
i j
(t) =
(N
2
−N)/2
∑
n=1
ˆs
n
(t). (14)
The B-mode image can be generated by computing
the amplitude of the complex value y
∗
DMAS
(t). In th e
FDMAS in RF band, it is ne c essary to extract th e band
correspo nding to the freq uency twice the fr equency
band of the transmission wave by using the band pass
filter. On the other hand, in the FDMA S in baseband,
the low pass filter is adopted instead of the band pass
filter, since both fundamental a nd 2nd harmonic co m-
ponen ts of the result of Eq. 14 appear around a DC
component. This means that the fundamental and the
2nd harmonic components are simultaneously extrac-
ted a nd used for imaging, wh a t is expected to improve
the SNR.
In order to improve the ra nge re solution of the
original FDM AS, we adopt the same method in the
SCM-weighted SA to incorporate the SCM result into
the FDMAS. Namely, before the processing of Eq. 14,
s
i
(t) is multiplied by the corre sponding S(t) obtai-
ned by a pplying the SCM to the echoes before be-
amform ing. We call this new beamformer HRR-
FDMAS (High Range-Resolution FDMAS). The re-
striction o f pulse transmission position exists simi-
larly to the SCM-weighted SA, and its improvement
strategy is the same as the SCM-weighted SA, an d it
will be a future task.
Figure 5: Experiment setting using metal wire with vinyl
coating.
3 EXPERIMENT
3.1 Experiment Conditions
In the experiments, the transmission and re ception se-
quences were generated using an experimental plat-
form for medical ultrasound (RSYS0003, Microsonic
Inc., Japan) with a sampling rate of 31.25 M Hz. The
number of transducer elements used for both trans-
mission and reception is 64, while the element pitch
is 0.315 mm. Transmitted waves are restricted to se-
ven gradations. A linear array probe (T0-1 599, Nihon
Dempa Kogyo Co ., Ltd., Japa n) was also used. Th is
probes center frequency is 7.5 MHz and its specific
bandwidth is 70%. The signal processing required
was performed offline using MATLA B software.
3.2 Experiments Using Wire Target
Figure 5 shows the experiment setting. We performed
an experime nt using a vinyl coated metal wire with a
diameter of 1.5 mm that was placed in the water at a
distance of 10 mm from the transducer as an imaging
target. The divergent waves wer e transmitted using a
central sub-array composed of 8 eleme nts with a fo-
cal point of −0.63 mm with respect to the sub-array
width of 2.52 mm. Because the probe element spa-
cing is wider, it is likely that grating lobes will be
formed. The f requency band of th e FM chirp pulse
that is used in the experiment is set at a relatively nar-
row 2 MHz, as described in the Table 1. Although the
frequency band that is used is not the most effective
band for all the transmissions, it was confirmed that
can be perform ed appropriately.
3.3 Performance Evaluation of
Baseband FDMAS
First, pe rformm ance compa rison be twe en the DAS
and the FDMAS were conducted. Figure 6 shows the
B-mode images of processing in baseband, and Fig. 7
VISAPP 2019 - 14th International Conference on Computer Vision Theory and Applications
202
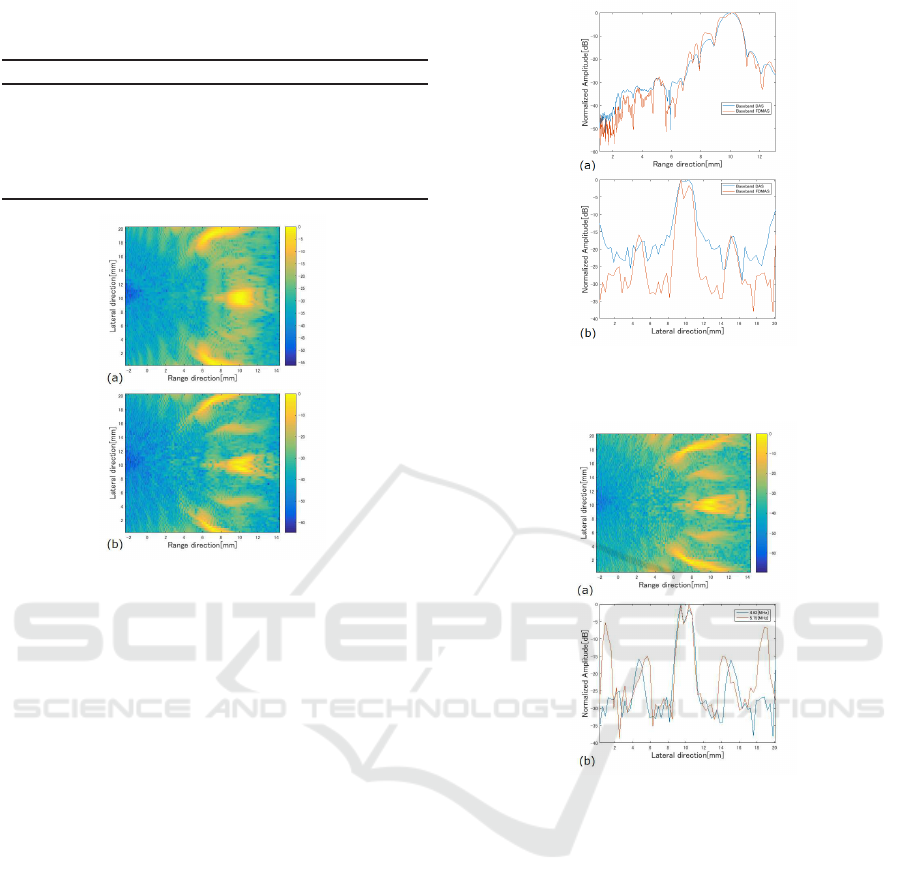
Table 1: Parameter settings of the transmitted FM-chirp
pulse.
Parameter Value
Frequency band width 2 MHz
Chirp pulse duration 5 µs
Variation range of center freq. 4 to 6 MHz
Number of transmission 15
Apodization Hanning window
Figure 6: B-mode images using 4.62 MHz: (a) baseband
DAS; (b) baseband FDMAS.
shows the intensity distribution profiles on a line cros-
sing the imaging target. Since the reception echoes of
a plurality of frequencies are obtained for the SCM
processing, it is possible to g enerate a B-mode image
using each frequency echo. I n this study, the lowest
frequency of 4.62 MHz was used for imaging to avoid
grating lobes as much as possible. In ord er to con-
firm that th e grating lobes increase by using the high
frequency echo for B-mode imaging, the baseband
FDMAS result using high frequency of 5.75 MHz is
shown in Fig. 8(a). In addition, the intensity distribu-
tion profiles in the lateral dir ection using 4.62 MHz
and 5.75 MHz are shown in Fig. 8(b). From Figs. 6
and 7, it c an b e confirmed that the range resolution
almost unchange d, but the lateral resolution improves
when the FDMAS is applied.
Next, in order to evaluate the performance of the
baseband FDMAS, the SNR was compared with the
RF band FDMAS. Figure 9 shows the B-mode image
of the RF band FDMAS and Fig. 10 shows the inten-
sity distribution profiles on a line crossing the im a-
ging target. In the definition of the SNR, the peak
of the echo signal from the target was a dopted as the
signal inte nsity, and the no ise average was adopted as
the noise intensity in the range direction profile of one
line where the target exists. The SNR was 32.63 dB
for RF band FDMAS and 37.12 dB for baseband FD-
MAS. From this result, it was confirmed that the ba-
Figure 7: Intensity distribution profiles on a line crossing
imaging target using 4.62 MHz: (a) range direction; (b) la-
teral direction.
Figure 8: Grating lobes increase using high frequency echo:
(a) B-mode i mage using 5.75 MHz; (b) intensity distribu-
tion profiles in lateral direction using diff erent frequencies.
seband FDMAS improves the SNR and the lateral re-
solution. In the RF band FDMAS, the range resolu-
tion is improved by extracting the double frequency
band using a band pass filter. On the other hand,
the baseband FDM A S processes the baseb a nd signal
in which both the transmission frequency component
and the doubled frequency component are conve rted,
so that the SNR can be improved. By using not only
the double freque ncy band but also th e transmission
frequency band, we were worried about lowering the
resolution compared to the FDMAS in the RF band.
However, due to the fact th a t th e double freq uency
band has sufficient power, no reduc tion in range re-
solution was confirmed. Improvemen t of lateral re-
solution is considered to be due to phase matching
of processing in baseband. However, pr ocessing with
baseband causes a rtifacts regardless of the beamfo r-
ming method. Since th is does not occur in processing
Improvement of Range Resolution of FDMAS Beamforming in Ultrasound Imaging
203
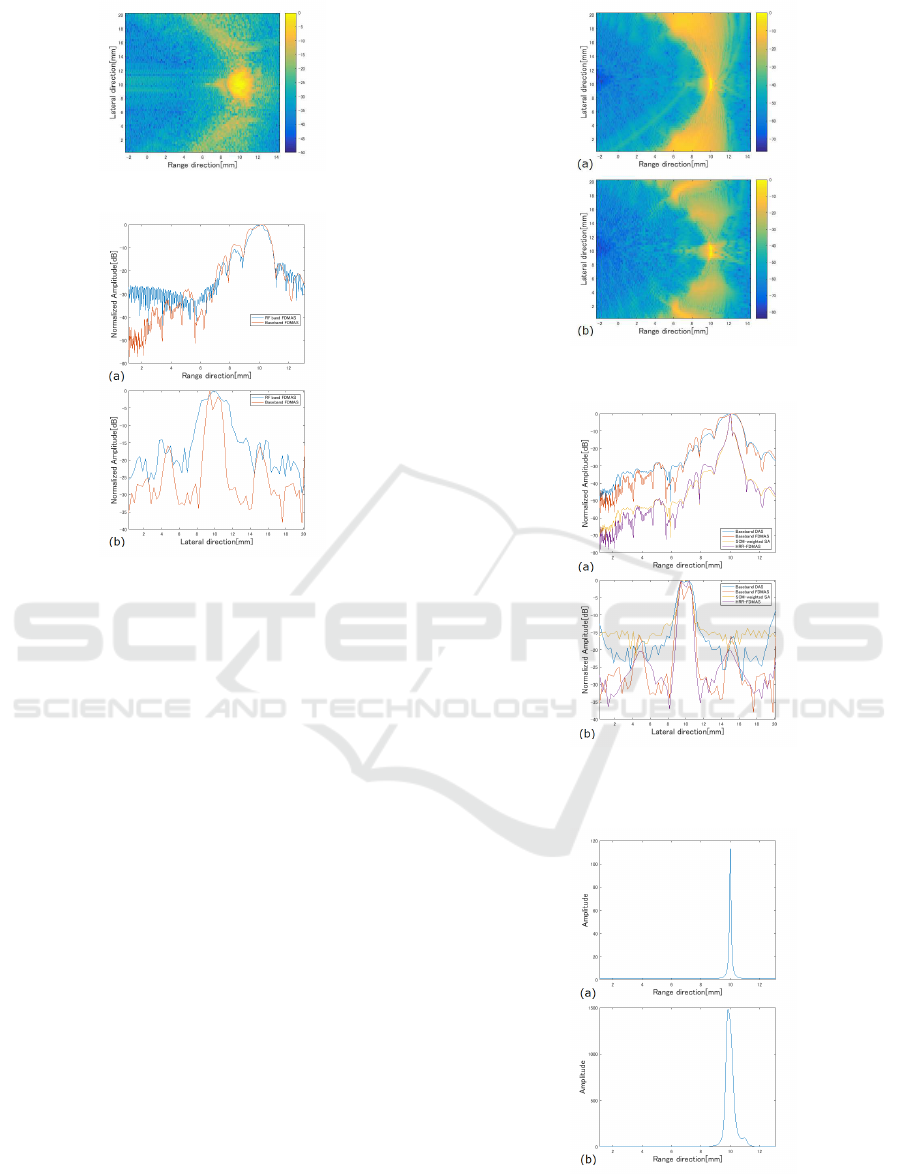
Figure 9: B-mode image of RF band FDMAS.
Figure 10: Intensity distribution profiles on a line crossing
imaging target of B-mode images in RF band and baseband
FDMAS: (a) range direction; (b) lateral direction.
with the RF band, we will investigate the cause in the
future.
3.4 Performance Evaluation of
HRR-FDMAS
Performance of HRR-FDMAS was evaluated. Fi-
gure 11 shows th e B-mode image s by the SCM-
weighted SA and by th e HRR-FDMAS, and Fig. 12
shows the intensity distribution profiles on a line cros-
sing the imaging target of all the methods described
in this p aper. In this experiment, the value of D in
SCM processing was set to 1 because there is only
one target. Figu re 13 shows the result of SCM when
changin g the value of D. As sh own in Fig. 13, arti-
facts m a y be gener a te d in the re sult of the SCM if D
setting is not a ppropriate. From this result, it can be
confirmed that the HDD-FDMAS improves the lateral
resolution compared with the SCM-weighted SA.
4 CONCLUSION
We first proposed the realization of FDMAS in ba-
seband, and experimentally confirmed that SNR and
lateral resolution are grea tly improved c ompared with
Figure 11: B-mode images: (a) SCM-weighted SA; (b)
HRR-FDMAS.
Figure 12: Intensity distribution profiles on a line crossing
imaging target of al l methods described in this paper: (a)
range direction; (b) lateral direction.
Figure 13: Result of SCM when changing the value of D:
(a) D = 1; (b) D = 5.
VISAPP 2019 - 14th International Conference on Computer Vision Theory and Applications
204

FDMAS in RF band. Subsequently, we proposed a
new beamformer HRR-FDMAS in which the SCM
result is applied to the FDMAS in o rder to improve
range resolution. The improvement of the spatial re-
solution for the FDMAS in the conventional RF ban d
was clearly confirmed by experiments. Evaluation
and verification of a c tual performance of the HRR-
FDMAS fo r living organ isms is a task to be carr ie d
out as soon as possible in the f uture.
In the HRR-FDMAS, the SCM processing takes
much computational cost because the phase informa-
tion of the carrier is extracted by the MUSI C algo-
rithm that requires the e igenvalue analysis. Therefore,
we are considering improvin g the range resolution by
other methods that can use phase information with a
low cost procedure. The essence of the SCM is to
transmit and receive multiple times while ch anging
the carrier frequency irregularly, and we aim to pro-
pose an efficient beamforming method that can take
advantage of this principle.
REFERENCES
Amy, D., Durante, E., and Tot, T. (2015). T he lobar appro-
ach to breast ultrasound i maging and surgery. Ultra-
sonics, 42(3):331–339.
Fujiwara, M., Okubo, K., and tagawa, N. (2009). A no-
vel technique for high resolution ultrasound imaging
using super resolution fm-chirp correlation method
(scm). In Proc. IEEE Int. Ultrason. Symp., pages
2390–2393.
Hazas, M. and Hopper, A. (2006). Broadband ultrasonic lo-
cation systems for improved indoor positioning. IEEE
Trans. Mobile Computing, 5(5):536–547.
Holm, S., Synnevdg, J. F., and Austeng, A. (2009). Capon
beamforming for active ultrasound imaging systems.
In Proc. IEEE 13th DSP Workshop, pages 60–65.
Jensen, J. A., Nikolov, S. I., Gammelmark, K. L., and Pe-
dersen, M. H. (2006). Synthetic aperture ultrasound
imaging. Ultrasonics, 44:e5–e15.
Liu, J., He, Q., and Luo, J. (2018). Compressed sensing
based synthetic transmit aperture imaging: Validation
in a convex array configuration. IEEE trans. ultrason.
ferroelectr. freq. control, 65(3):300–315.
Matrone, G., Ramalli, A., Savoia, A . S., Tortoli , P., and Ma-
genes, G. (2017). High frame-rate, high resolution
ultrasound imaging with multi-line transmission and
filtered-delay multiply and sum beamforming. IEEE
Trans. Med. Imag., 36(2):478–486.
Matrone, G., R amalli, A., Tortoli, P., and Magenes, G.
(2018). Experimental evaluation of ultrasound higher-
order harmonic imaging with filtereddelay multiply
and sum (f-dmas) non-linear beamforming. Ultraso-
nics, 86:59–68.
Matrone, G., Savoia, A. S., Caliano, G., and Magenes, G.
(2015). The delay multiply and sum beamforming al-
gorithm in ultrasound b-mode medical imaging. IEEE
Trans. Med. Imag, 34(4):940–949.
Schmidt, R. O. (1986). Multiple emitter location and sig-
nal parameter estimation. IEEE Trans. Antennas and
Propagation, 34(3):276–280.
Shoval, S. and Borenstein, J. (2001). Using coded signals to
benefit from ultrasonic sensor crosstalk in mobile ro-
bot obstacle avoidance. In Proc. IEEE Int. Conf. Ro-
botics and Automation, volume 3, pages 2879–2884.
Su, T. , Li, D., and Zhang, S. (2018). An efficient subar-
ray average delay multiply and sum beamformer al-
gorithm in ultrasound imaging. Ultrasonics, 84:411–
420.
Tagawa, N., Zhu, J., and Okubo, K. (2018). Performance
analysis of high-frame rate and super-resolution ultra-
sound i maging based on f requency sweeping. submit-
ted to Applied Sciences.
Thomenius, K. E. (1996). Evolution of ult r asound beamfor-
mers. In Proc. IEEE Int. Ultrason. Symp., volume 2,
pages 1615–1622.
Vignon, F. and Burcher, M. R. (2008). Capon beamfor-
ming in medical ultrasound imaging with focused be-
ams. IEEE trans. ultrason. ferroelectr. freq. control,
24(10):1308–1322.
Wada, T., Ho, Y., Okubo, K., Tagawa, N., and Hirose, Y.
(2015). High frame r ate super resolution imaging ba-
sed on ultrasound synthetic aperture scheme. Physics
Procedia, 70:1216–1220.
Wang, Z., Li, J. , and Wu, R. (2005). Ti me-delay-
and time-reversal-based robust capon beamformers
for ultrasound imaging. IEEE Trans. Med. Imag.,
24(10):1308–1322.
Ylitalo, J. (1996). A fast ultrasonic synthetic aperture ima-
ging method: application to ndt. Ultrasonics, 34(2-
5):331–333.
Zhou, L., Zhao, Y. J., and Cui, H. (2008). High resolution
wideband doa estimation based on modified music al-
gorithm. In Proc. IEEE Int. Conf. Inf. Automat., pages
20–22.
Zhu, J. and Tagawa, N. (2018). Super-resolution ultrasound
imaging based on the phase of the carrier wave wit-
hout deterioration by grating lobes. In Proc. Int. Conf.
Pattern Recognition, pages 2791–2796.
Improvement of Range Resolution of FDMAS Beamforming in Ultrasound Imaging
205
