
A Toolset to Detect and Classify Active Deformation Areas using
Interferometric SAR Data
Jos
´
e A. Navarro
1
, Mar
´
ıa Cuevas
1
, Roberto Tom
´
as
2
, Anna Barra
1
and Michele Crosetto
1
1
Centre Tecnol
`
ogic de Telecomunicacions de Catalunya (CTTC/CERCA),
Av. Carl Friedrich Gauss 7, 08860 Castelldefels, Spain
2
Dpto. de Ingenier
´
ıa Civil, Escuela Polit
´
ecnica Superior de Alicante, Universidad de Alicante,
P.O. Box 99, E-03080 Alicante, Spain
Keywords:
Ground Deformation Analysis, Ground Deformation Classification, Process Automation.
Abstract:
The MOMIT project is targeted at showing how remote sensing techniques may help to monitor and then
maintain railway infrastructures. This project has defined several demostrators to fulfill such goal. The au-
thors have been involved in the design and development of several sofware tools needed to implement the
first demonstrator, dealing with ground movements nearby the railway infrastructures. Among these tools,
ADAfinder, ADAclassifier and los2hv have been developed at the CTTC. The aim of ADAfinder is to detect
—and update— areas where active deformation processes are taking place; ADAclassifier is targeted at iden-
tifying the kind of processes undergone by such areas; finally, los2hv is a tool computing the horizontal and
vertical components of the movement measured along a line of sight. This paper takes care of describing these
three application, in the context of the MOMIT project, not forgetting the benefits derived from the automation
of the methodologies they rely on. The formal testing process of the tools as well as some results obtained
with real datasets are also presented.
1 INTRODUCTION
The MOMIT project—(Multi-scale Observation and
Monitoring of railway Infrastructure Threats), see
(MOMIT, 2017) for details—aims at developing and
demonstrating a new use of remote sensing technolo-
gies for railway infrastructures monitoring. MOMIT
solutions will mainly aim at supporting the mainte-
nance and prevention processes within the infrastruc-
ture management lifecycle. The overall concept un-
derpinning MOMIT project is the demonstration of
the benefits brought by Earth Observation and Re-
mote Sensing to the monitoring of railways networks
both in terms of the infrastructure and of the surround-
ing environment, where activities and phenomena im-
pacting the infrastructure could be present. MOMIT
will leverage on state of the art technologies in the
fields of space-based remote sensing and RPAS (Re-
motely Piloted Aircraft Systems) based to perform
different kind of analysis thanks to the wide variety
of sensors they could be equipped with.
To achieve its goals, six demonstrators showing
how these data and technologies may contribute to
such objectives are being built, namely:
1. Ground movements nearby the infrastructure.
2. Hydraulic activities nearby the track.
3. Global supervision for natural hazards.
4. Electrical system monitoring.
5. Civil engineering structures monitoring.
6. Safety monitoring.
The Division of Geomatics of the CTTC (Cen-
tre Tecnol
`
ogic de Telecomunicacions de Catalunya)
takes care of building some of the components inte-
grating the first demonstrator, whose objectives are
detailed in (MOMIT, 2017). The goal most relevant
to the work presented here is to use the PSI (Persis-
tent Scatterer Interferometry) method for monitoring
the sites of interest, allowing the measurement of dif-
ferential deformation of the ground and each single
structure, with millimetric / centimetric precision.
Several software applications are needed in the
context of this demonstrator. This paper describes
those developed at CTTC, namely, ADAfinder, ADA-
classifier and los2hv. The first one, ADAfinder, is
a tool to detect and update ADAs (Active Deforma-
tion Areas) using Sentinel-1 imagery and PSI. The
Navarro, J., Cuevas, M., Tomás, R., Barra, A. and Crosetto, M.
A Toolset to Detect and Classify Active Deformation Areas using Interferometric SAR Data.
DOI: 10.5220/0007617701670174
In Proceedings of the 5th International Conference on Geographical Information Systems Theory, Applications and Management (GISTAM 2019), pages 167-174
ISBN: 978-989-758-371-1
Copyright
c
2019 by SCITEPRESS – Science and Technology Publications, Lda. All rights reserved
167

main goal of such application is to update and as-
sess the geohazard activity (volcanic activity, land-
slides or ground subsidence among other phenomena)
of a given area. ADAclassifier goes a step beyond
ADAfinder, trying to classify the kind of deforma-
tion process undergone by the ADAs — that is, is the
detected deformation process a landlisde, a sinkhole,
or what else? Finally, los2hv computes the horizon-
tal and vertical components of the movement mea-
sured along the LOS (Line Of Sight). The horizon-
tal component of such movement is one of the inputs
of ADAclassifier; therefore, a tool to compute it was
needed.
2 AUTOMATING
METHODOLOGIES
The three tools presented in this paper rely in preex-
isting methodologies, that is, these applications have
automated a set of procedures that already existed.
In the case of ADAfinder, a methodology to per-
form the identification and assessment of ADAs was
presented in (Barra et al., 2017) back in 2017. In that
work, the authors explain in detail the procedure to
identify the active deformation areas and also to as-
sess the certainty of such findings; the set of points
making each ADA as well as its area of influence and
the quality index stating the goodness of the assess-
ment are the most relevant outputs. The input, the set
of PSs (Persistent Scatterers, aka the points) covering
the area to analyze.
ADAclassifier relies on a methodology that is un-
der active reseach—although mature enough as to be
automated, thus easing the experimentation in this
area and helping to improve the methodology itself.
For more details, see (Tom
´
as et al., 2018).
Finally, the work described in (Notti et al., 2014)
is the base of the implementation of los2hv.
The aforementioned procedures usually rely on
the heavy use of a GIS (Geographic Information Sys-
tem) tool and the expertise of its operator; there-
fore, these are time-consuming, error-prone pro-
cesses, which require qualified human resources.
This paper presents an implementation of the three
methodologies and algorithms above, incarnated as
the above-mentioned ADAfinder, ADAclassifier and
los2hv applications. The goals of such implementa-
tions are (1) to automate the respective procedures
to avoid unnecessary human errors, (2) to reduce the
time needed to identify and preclassify the ADAs,
thus opening the door to more frequent updates and
analysis, and (3) to reduce the expertise required to
obtain such results, being possible to integrate the
process in an semi-automated production workflow,
if necessary and possible.
3 THE APPLICATIONS
3.1 ADAfinder
The first tool in the set is ADAfinder. This application
is used to identify those areas that are undergoing a
deformation process, whatever it is. Additionally, an
assessment of the quality of the detection process is
performed.
As inputs, it takes:
• An ESRI shapefile containing the PSs that will be
used by the detection algorithm. ADAfinder needs
the attributes related to these PSs to be, at least,
the coordinates of the points, their velocity, and
the deformation time series measuring the move-
ments undergone by the PSs at various times in
the past.
• Optionally, another shapefile defining a polygon
delimiting the area of interest to be analyzed. All
PSs in the input shapefile are taken into account
when such polygon is not provided.
• The set of parameters defined by the methodology
described in (Barra et al., 2017).
The output is made of two ESRI shapefiles, the
first one containing the polygons defining the bound-
aries of the ADAs; the other contains the set of PSs
passing the set of filters set by the methodology.
Figure 1 depicts the user interface of the GUI
(Graphical User Interface) version of the ADAfinder
tool.
The output ADA shapefile includes among its at-
tributes the results of the quality assessment of the de-
formation detection process. Such asessment is repre-
sented by a four-level variable whose values measure
the certainty (”very sure”, ”sure”, ”not so sure” and
”not sure at all”) of the deformation detection pro-
cess. Figure 2 shows some ADAs; their colours cor-
respond to just two of the certainty levels described
(”very sure”, green, ”sure”, blue).
For more details on the ADAfinder tool, please
refer to (Navarro et al., 2018a) and (Navarro and
Cuevas, 2018b).
3.2 ADAclassifier
The second application in the toolset is ADAclassi-
fier. This tool takes the output of ADAfinder, that is,
GISTAM 2019 - 5th International Conference on Geographical Information Systems Theory, Applications and Management
168
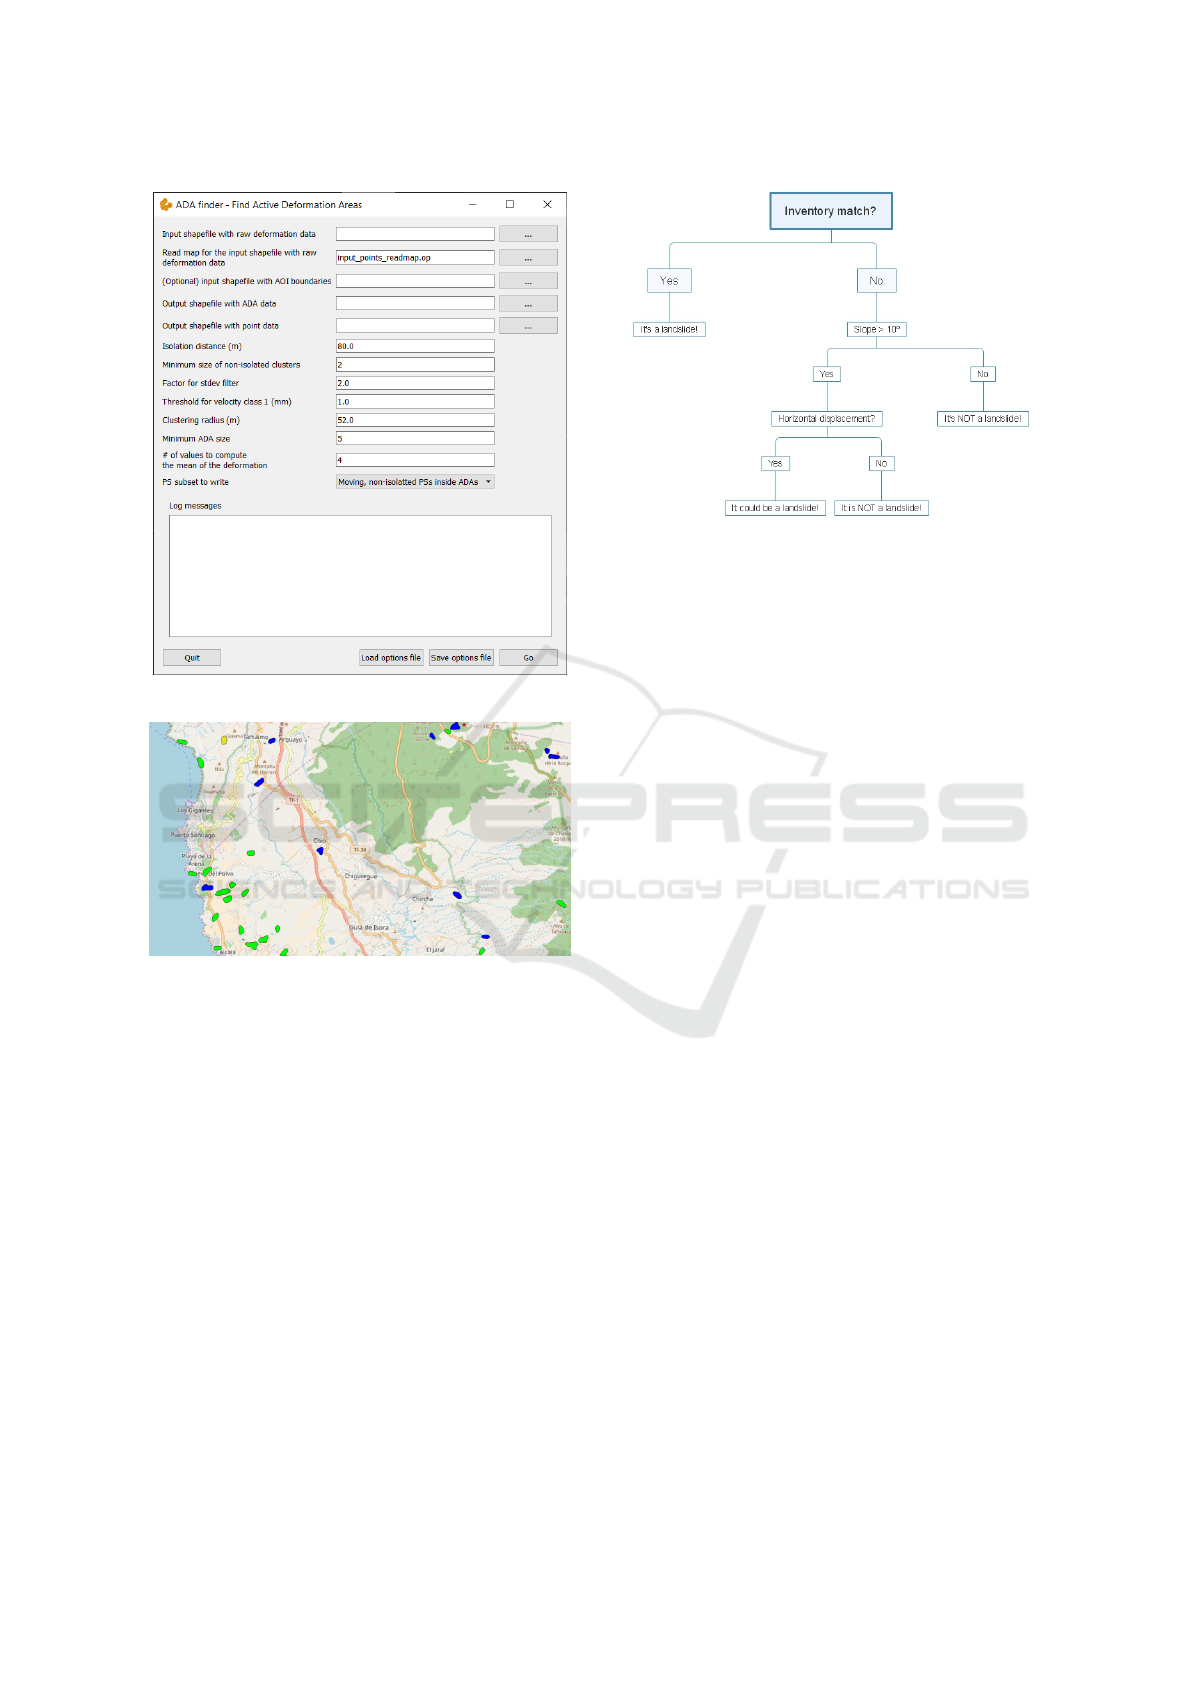
Figure 1: The GUI version of the ADAfinder tool.
Figure 2: An example of the output of ADAfinder. Colours
are used to show the quality assessment.
a set of ADAs, and tries to determine the kind(s) of
deformation process(es) undergone by each of them.
Up to six different kinds of deformation phenom-
ena are detected. These are: landslides, sinkholes,
land subsidences, constructive or consolidation set-
tlements, expansive soils and temperature effects. A
different algorithm (or sub-methodology) has been
devised for each of these. For instance, Figure 3
roughtly depicts how landslides are detected.
Being able to detect so many kind of deformation
processes implies that ADAclassifier needs a substan-
tial number of inputs. These are:
• The ADAs and PSs files created by ADAfinder
(see section 3.1). Obviously, these files need
not to be created by ADAfinder, but the set
of attributes must match those required by
ADAclassifier—and that ADAfinder does include
Figure 3: Algorithm to detect landslides.
in its output.
• A DTM (Digital Terrain Model), to compute
slopes.
• A series of polygon vector maps (inventories from
now on,) in the form of ESRI shapefiles, to check
whether an ADA has already being catalogued as
belonging to any of the six aforementioned de-
formation processes. The required inventories are
those for landslides, sinkholes, land subsidences,
infrastructures. A geologic map (another polygon
vector map) is also needed.
• Again, an ESRI (polygon) shapefile storing the
horizontal component of the movement for the
study area. This is, typically, the output of los2hv
(see section 3.3 for details).
• Finally, the set of parameters—typically
thresholds—needed by the different algo-
rithms in charge of the classification processes
must be supplied. Examples of such parameters
are slopes, Pearson coefficients to state whether
some statistical check is positive, or the minimum
percentage of overlap of an ADA and the poly-
gons in some inventory to consider that they do
intersect.
The output of ADAclassifier is another file with
ADAS, where the set of attributes characterizing each
of them has been extended to include six more. Each
of them state the possibility that the ADA belongs
to the corresponding deformation process. This is
so because all the detection algorithms are applied
to each ADA. Therefore, and although incongruous,
some ADAs might be classified as positives in more
than one deformation process.
Four levels of certainty are defined by the method-
ology: ”it is an X”, ”it could be an X”, it is not an X”
and ”X has not been checked”, where ”X” stands for
A Toolset to Detect and Classify Active Deformation Areas using Interferometric SAR Data
169
each of the six deformation detection processes exe-
cuted by ADAclassifier—for instance, when talking
about landslides, ”it is a landslide” would be one of
the values of the corresponding attribute.
Note that one of the four values is ”not checked”.
This is so because ADAclassifier may decide not to
apply one or more of the six detection processes be-
cause of the lack of data. As stated above, a notice-
able number of inputs is required. Just the inventory
files already amount to five. Taking also into account
the DTM and the horizontal components of the move-
ment, it is easy to realize that many will be the situa-
tions when the full set of files will not be available.
To alleviate this usual problem, ADAclassifier
makes optional almost every input file (this includes
the DTM, the inventories and the horizontal compo-
nents). Each time the application is run, it analyzes
the dependencies of each sub-algorithm and decides
which of these may be executed as a function of the
inputs provided by the user. Consequently, it is nec-
essary to add the ”not checked” value as one of the
possible outputs of each classification process. Note
that this behaviour makes the tool much more flexible:
while concentrating the detection of six deformation
processes in a single application, it may be used to
check only one of these, just providing the available
set of data.
The ADAclassifier tool is described in more detail
in (Navarro et al., 2018b).
3.3 los2hv
The los2hv tool is targeted at the computation of the
separate horizontal and vertical components of the
ground displacement measured with PSI technolo-
gies along the satellite’s LOS. Both ascending and
descending datasets—that is, files with PSs derived
from SAR (Synthetic Aperture Radar) images cap-
tured when the satellite is traveling from south to
north and from north to south respectively—are re-
quired. los2hv, in its current version, is not able
to compute such horizontal and vertical components
when only one dataset (ascending or descending) is
available.
The tool accepts (input) and produces (output)
ESRI shapefiles for compatibility reasons. On out-
put, los2hv creates two files, to store, respectively, the
horizontal and vertical components of the movement
as observed along the LOS.
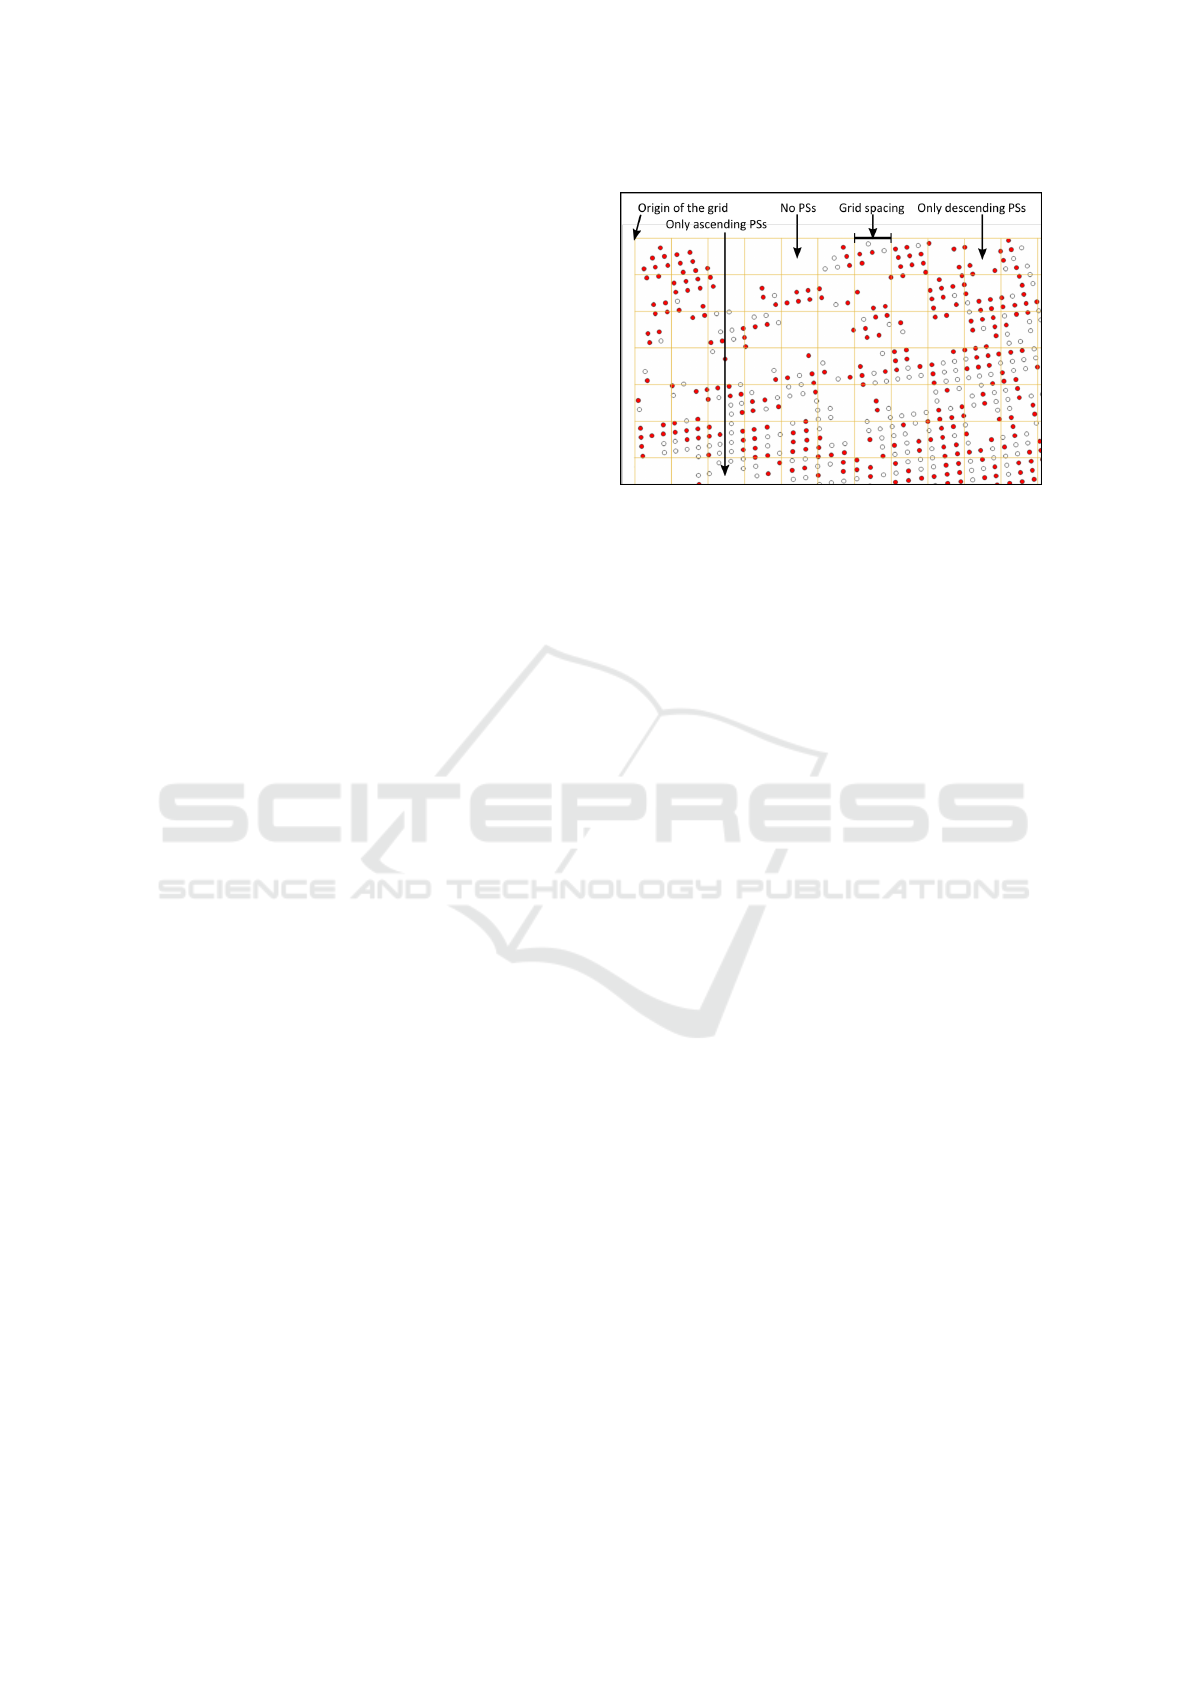
los2hv performs a tessellation of the whole area
covered by the PSs included in the two input files.
The size of the tesserae (grid spacing) is decided by
the user. As a consequence, each PS belongs to one
of the resulting tesserae.
Figure 4: los2v: tesserae and ascending and descending
PSs.
There may be tesserae where (1) there are no PSs,
(2) there are only PSs from the ascending input file,
(3) there are only PSs from the descending input file
and, finally (4) there are PSs from both input files (see
Figure 4). For those tesserae of type (4), the ground
movement is averaged. The resulting amount, mea-
sured along the LOS, is then converted to horizon-
tal and vertical components according to the formulae
described in (Notti et al., 2014). The value of the hor-
izontal and vertical components of the ground move-
ment corresponds now to the whole area covered by
the tessera where the points involved in the computa-
tion where located.
These values are saved to the corresponding out-
put files. Note that the user may select to store
points (centroids of the tesserae with data) or squares
(boundaries of the tesserae). The second kind of out-
put (squares) is the one used by ADAclassifier. The
centroid output is provided for whatever other pur-
poses.
For more information about los2hv, please refer
to (Navarro and Cuevas, 2018a).
4 IMPLEMENTATION AND
INTEGRATION
4.1 The Language of Choice
The toolset has been implemented in C++ to boost
performance. Other popular languages, as Python,
have been avoided precisely for that reason. Although
developed using Microsoft’s Visual Studio, special
precautions have been taken to make the source code
portable, particularly for the most popular C++ com-
piler used in the Linux operating system, i.e. gcc.
Choosing C++ opened the door to using several
GISTAM 2019 - 5th International Conference on Geographical Information Systems Theory, Applications and Management
170

open source libraries on which the toolset relies. The
most relevant ones are:
• Qt. Although it has been used for several pur-
poses, the main target was to provide a portable
GUI for the three applications.
• Shapelib. This library is a very convenient tool to
read and write ESRI shapefiles.
• Clipper. A library for clipping and offsetting lines
and polygons.
The selection of the programming language has
direct implications on how the logic of these appli-
cations may be embedded in other software compo-
nents. See section 4.2 for further details.
4.2 Three Flavours
Each of the applications described in section 3 are
available in three different incarnations or flavours:
• As a C++ class in a library (one for each applica-
tion). Third party (C++) sofware willing to embed
the logic of ADAfinder, ADAclassifier or los2hv
as a black box, only needs to instantiate the cor-
responding class. Thus, embedding the necessary
logic to be able to identify or classify ADAs or to
compute the horizontal components of the move-
ment is just one procedure call away. Obviously,
only sofware components developed in C++ will
be able to integrate the logic in the library.
• As a command-line utility. This makes possible to
integrate these tools in batch workflows, since no
human intervention is required to run them. See
section 4.3 for details on options files, the mech-
anism used to obtain the information controlling
the behaviour of the applications.
• As an application featuring a GUI. This flavour is
the best one for experimenting because of its ease
of use. GUI-based applications, however, cannot
be integrated in batch workflows.
Note that the command-line as well as the GUI
versions of the applications are just interfaces calling
the classes in the library that actually implement the
logic of the processes.
4.3 Option Files
Both the command-line and GUI versions of the ap-
plications in the toolset rely on option files to retrieve
the information defining how to proceeed—input or
output files, thresholds controlling some condition,
etc. Note that this is so for the GUI-based tools too;
in fact, the GUI is just a mechanism to fill the gaps in
an option file template. This simplifies the design of
the classes implementing the logic, since only one in-
terface (the option file) needs to be taken care of. The
commmand-line incarnations of the three tools have a
single parameter: the name of the options file with the
program’s parameters.
The option files used by the toolset are uncom-
plicated, plain text files including pairs of labels and
values:
POSITION_X = 5
4.4 Real-life Shapefiles
ESRI shapefiles, although standardized, may include
variable sets of attributes. Even when a shapefile in-
cludes the full set of attributes needed by a tool (for
instance, the x and y coordinates as well as the ve-
locity or the deformation time series in the case of
ADAfinder), they may appear in different columns of
the attribute (.dbf) file. This usually depends on the
provider of the files.
This variability might become a serious problem,
since the input module should be adapted for each
kind of shapefile to process.
The solution to avoid this problem are the ”read-
map files” defining how the relevant attributes in a
shapefile are organized. Of course, the attributes
needed by the tools to work properly must always
be present in the files, but thanks to these read-map
files it is possible to deal with changes in the positions
where these appear.
Thus, a read-map file is just an extra options file
(see section 4.3) where, by means of couples of labels
and values, the positions of the attributes on which
each tool rely are specified.
Such a simple mechanism makes the toolset much
more flexible and able to deal with real-life datasets.
5 QUALITY ASSURANCE
Prior to the delivery of the tools to the MOMIT con-
sortium, these went through a rigorous testing pro-
cess to guarantee that they worked correctly. Note
that both a test plan and a test report concerning the
whole toolset are described, respectively, in (Navarro
et al., 2018c) and (Navarro et al., 2018d). There, the
full details on how testing was devised and took place
are provided. However, and for the sake of complete-
ness, the next sections briefly presents the most rele-
vant steps taken to guarantee the quality of the code.
In the case of ADAfinder, the manual methodol-
ogy had been used for some time in GIS environments
when this tool was developed, so datasets including
A Toolset to Detect and Classify Active Deformation Areas using Interferometric SAR Data
171
both inputs and outputs were available. Therefore, the
tests consisted essentially in comparing the results of
the manual procedure with those created by the tool.
A mechanism to quickly compare the results pro-
duced by the manual and automated solutions was
devised; basically, it consisted on exporting the val-
ues of the attributes to check for both outputs (man-
ual and automated), sorting these to easily match the
attributes in each file and then computing the differ-
ences of their values, which, in all cases, were un-
der the threshold set by the precision of the typical
8-byte IEEE 754 double (around the 15th decimal po-
sition). This means, from the numerical standpoint,
that the results (for instance, the coordinates of the
output points) were equivalent. The values of the at-
tributes standing the level of certainty were checked
for absolute equality since these were represented by
integer (non-floating point) magnitudes.
The situation of ADAclassifier and los2hv was
different; no previous results existed, so no reliable
dataset to compare their outputs was at hand. The
approach, therefore, was to create synthetic datasets
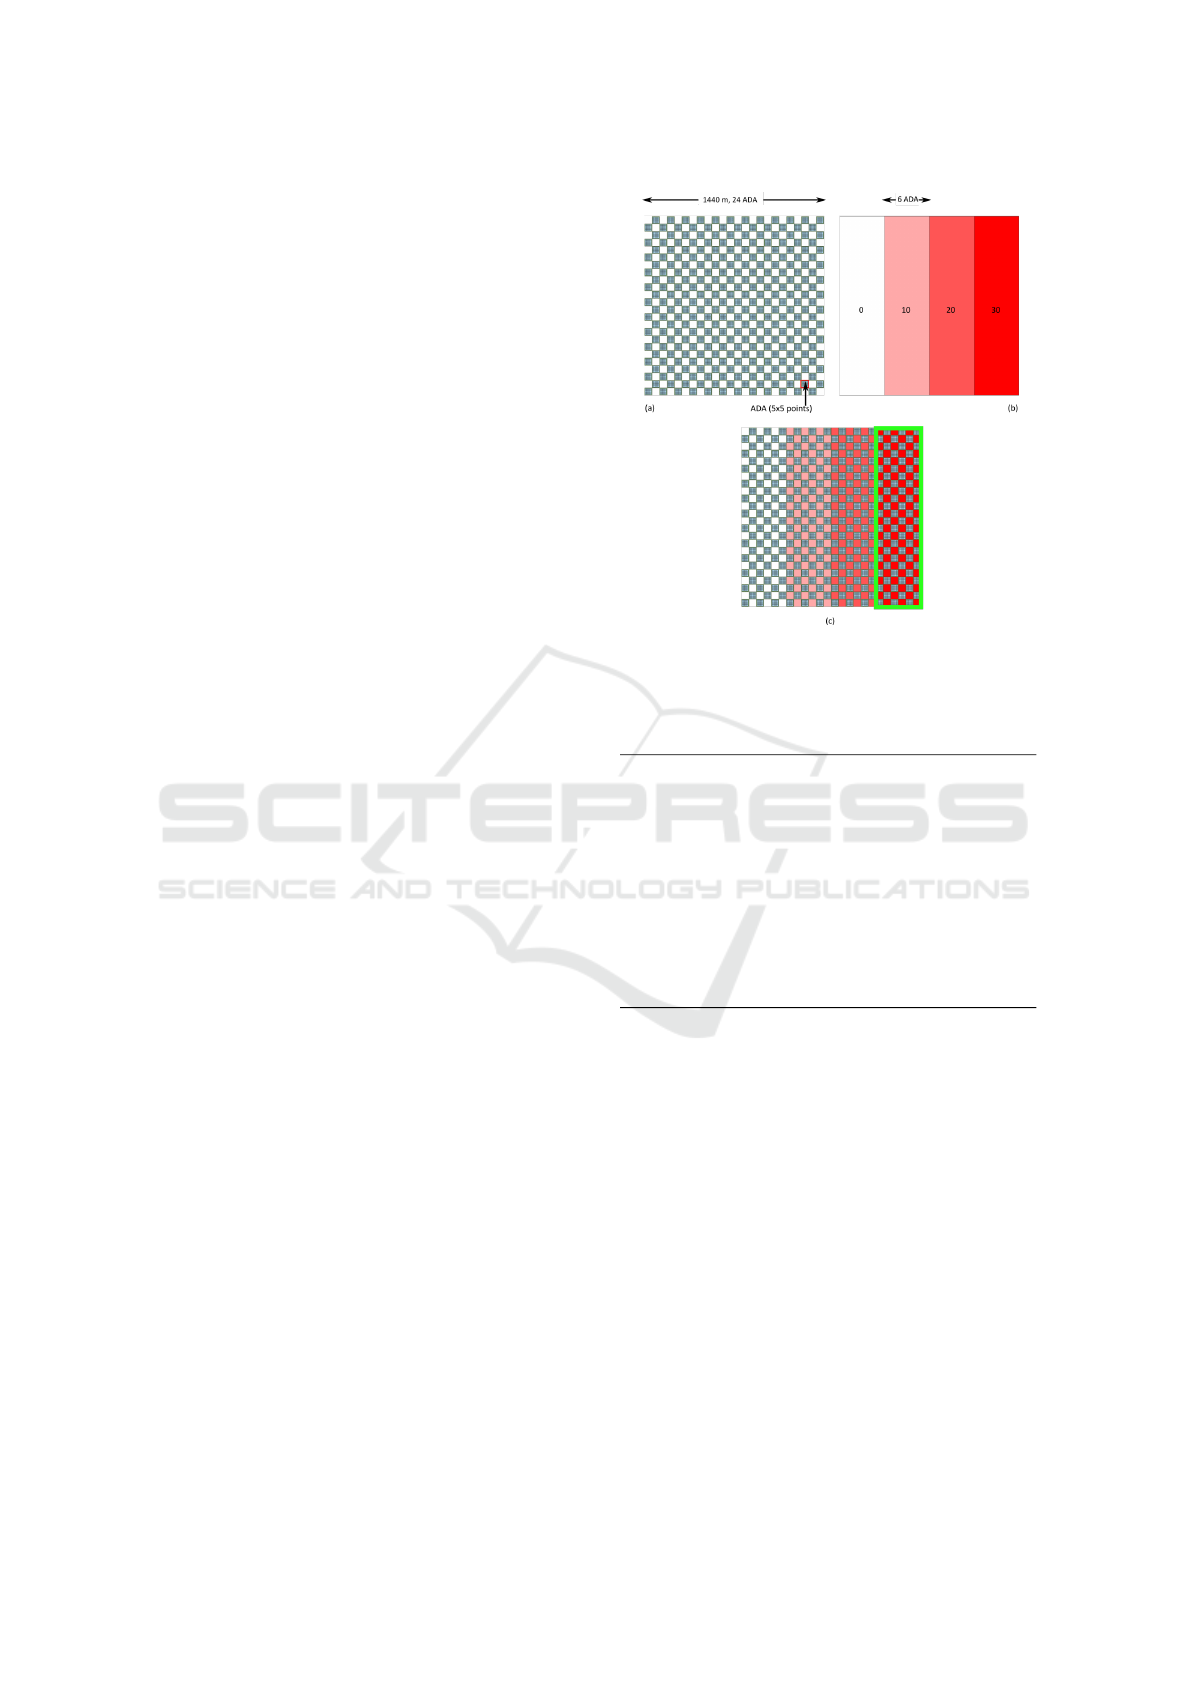
for both applications. The rationale behind the way
these datasets were created was to organize the infor-
mation in easily identifiable geometric patterns, so,
when combined, the area(s) where positive results
lie is (are) also predictable. For instance, all ADAS
were identical square-shaped polygons distributed in
a 24×24 ADAs checkerboard pattern (see Figure 5a);
the horizontal components of the moment were dis-
tributed in 4 adjacent vertical stripes covering 6×24
ADAs each and setting a known value to each of them
(0, 10, 20 and 30 mm/year respectively) as shown in
Figure 5b. Other easily identifiable patterns were used
for the rest of input files.
Then, for example, assuming that some classifica-
tion process needs the value of the horizontal compo-
nent of the movement to be higher than 25 mm/year,
then only the rightmost column made of 6×24 ADAs
will meet the requirement. This may be seen in Fig-
ure 5c where the ADAs and the horizontal compo-
nents of the movement (figures 5a and 5b) have been
overlapped.
6 PERFORMANCE EVALUATION
Only one of the applications developed and tested,
ADAfinder, relies on a procedure for which previous
results already existed. Therefore, it was the only one
for which a performance reference was available to
compare with. Since such procedure was executed
manually (a series of steps performed by an opera-
tor using the tools offered by a GIS) a noticeable im-
Figure 5: ADAclassifier: synthetic dataset samples.
Table 1: Performance of the several tools.
Tool Dataset Time (s)
ADAfinder 20,351 PSs. 2
ADAfinder 926,916 PSs. 179
ADAclassifier 144 ADAs, 3600
PSs, between 4 - 8
polygons per
inventory, DTM with
1441×1441 z values.
125
los2hv 2 × 135 PSs. Grid:
7×7 tesserae.
55
provement of performance was expected due to au-
tomation.
There were no performance references for the two
other tools (los2hv and ADAclassifier) so no spe-
cific expectations about performance improvements
existed. All tests took place using a computer with
the following characteristics: Windows 10 64-bit, In-
tel Core i5-5300U @ 2.3 GHz, 2 cores, 4 threads, 8
Gb RAM, 500 Gb magnetic (non-SSD) hard disk. Ta-
ble 1 shows the performance of the three tools.
Note that in the case of ADAclassifier, the pro-
cess includes the identification of six different classes
of deformation phenomena (that is, the test covers all
the possible classification processes available). Test-
ing for fewer options will reduce the time needed to
process data.
GISTAM 2019 - 5th International Conference on Geographical Information Systems Theory, Applications and Management
172
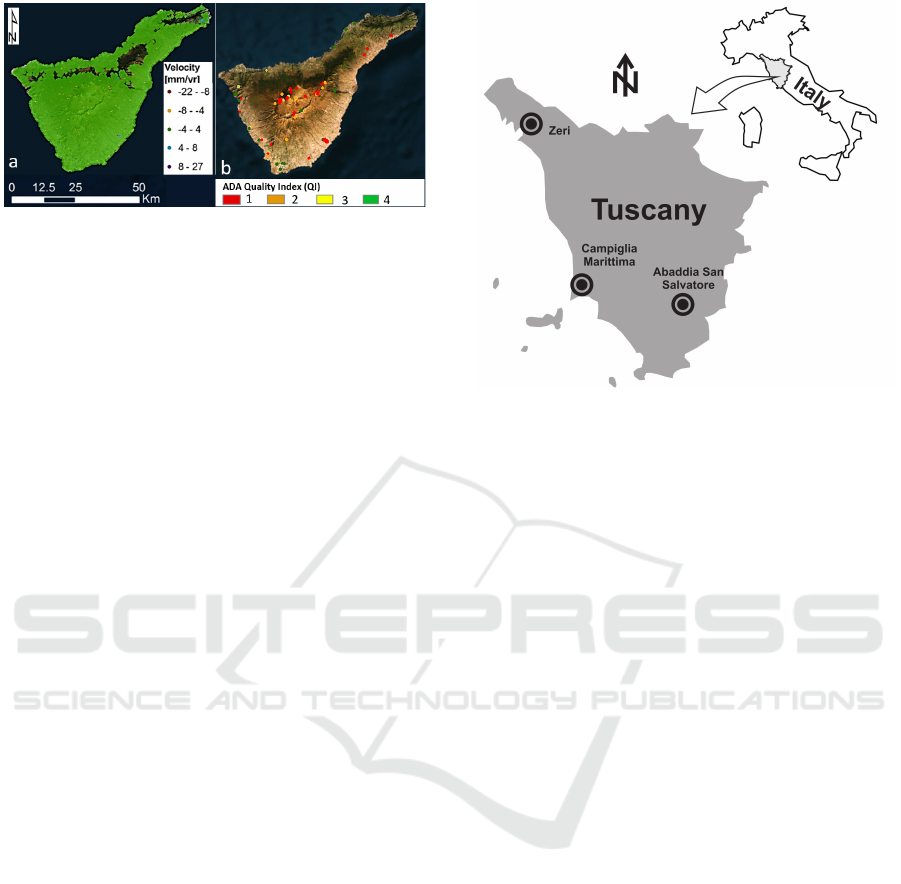
Figure 6: ADAfinder. Results for the Tenerife dataset
(source: (Barra et al., 2017)).
7 REAL TEST CASES
As stated in section 5, two real datasets were used to
check the correctness of the ADAfinder application.
The first one corresponds to Tenerife, one of the Ca-
nary Islands; the other one, the Gl
`
ories dataset covers
one of the neighbourhoods of the city of Barcelona.
The results related to the most representative one,
Tenerife, are briefly presented here. Gl
`
ories is a very
small dataset, containing only 20351 PSs only and
covering a much smaller area, so it was used primarly
to test the correctness of the application taking almost
no time to obtain results (about 2 s); it will not be
presented here.
The main parameters defining the dataset and how
it was processed follow (please, refer to (Barra et al.,
2017) for a detailed description of their meaning):
• Number of PSs in the input file: 926,916.
• Standard deviation of the velocity of the whole set
of PSs (σ
v
): 2.35 mm/year. The factor to apply to
σ
v
to obtain the stable/ moving threshold: 2.
• Points are considered isolated when having only 1
or no neighbours.
• Mimimum set of a cluster of points to be an ADA
candidate: 5.
• ADA radius: 40 m.
The results are shown in Figures 6a and 6b. The
left side of the figure depicts the distribution of PSs
and their velocities. On the right side, the 72 ADAs
detected by ADAfinder are shown. Note the QI (qual-
ity index) values is measuring the reliability (cer-
tainty) of the detection process. The meangins of
these values are: (1, red): very reliable; (2, orange):
reliable; (3, yellow): not so reliable; (4: green): not
reliable.
It is important to remark that the results obtained
by ADAfinder with this (and any other real) dataset
are the same than those obtained when computing the
results in a manual way.
Figure 7: Location of the test sites for the ADAclassifier
and los2hv tools.
The situation of ADAclassifier and los2hv is dif-
ferent. These applications are much newer and no
previous real datasets were at hand, so, at the time
of writing this paper, still no actual results based on
real datasets were available. Nonetheless, the Univer-
sity of Alicante, in cooperation with the University of
Florence, and using datasets kindly provided by this
last institution, is currently and actively testing these
tools. The areas covered are Zeri, Abbadia San Salva-
tore and Campiglia Marittima, all of them located in
Italy (see Figure 7).
Unlike formal tests, where it is possible to predict
the outcomes of the tools because of a controlled set
of input data, real datasets pose a much more difficult
challenge due to the complexity of the information
they contain. Therefore, the expertise of seasoned ex-
perts in the field is required; validating the correctness
of the output is a slow task; furthermore, obtaining
data to check the six different deformation processes
is not easy—inventories, for instance, are very hard to
find.
However, and although it is not possible to pub-
lish any definitive conclusions now, the preliminary
results obtained up to now are very promising—
confirming, at least for the time being, the positive
results of the formal tests.
8 CONCLUSIONS
The toolset presented in this paper, in either of its
three incarnations (library, command-line or GUI ap-
plication) is an efficient way to automate the detection
and classification of ADAs in very short times, free-
A Toolset to Detect and Classify Active Deformation Areas using Interferometric SAR Data
173

ing their users from the error-prone, manual process
required when a GIS tool is used to put into practice
the underlying methodologies—(Barra et al., 2017;
Tom
´
as et al., 2018). For instance, the ADAfinder
tool, for which former references existed, is at least
10 times faster than a regular GIS operator.
The tools are also flexible, being able to adapt
themselves to variations in the format of the input
shapefiles thanks to the use of the so-called ”read-map
files.”
Speed, flexibility and adequate GUI interfaces
make the toolset a very apt tool for research activ-
ities, where different scenarios—usually defined by
variations on the input parameters—may change the
results. On the other side, the availability of the
command-line versions of the tools makes possible to
integrate them in more production-oriented environ-
ments, thanks to the use of option files. Furthermore,
it is possible to use the toolset as a black box to in-
clude it in higher level software components, since
C++ classes have been included in the library imple-
menting the logic of the three applications. Last, but
not least, the tools, in their GUI versions, may be
integrated quite easily in either ArcGIS or Quantum
GIS—there is no need to modify the source code; this
may be done using the mechanisms provided by these
GIS tools. In this way, the applications become an
extra set of tools available in the regular work envi-
ronment of a GIS operator.
The toolset has undergone a very strict testing pro-
cess, using either real datasets and the comparison of
manual and automated results to check their validity
or synthetic ones when these were not available—that
is, for ADAclassifier and los2hv. In this case, how-
ever, the software is being actively tested nowadays,
and, although no results are available yet, the partial
outcomes are promising, thus confirming, at the time
being, the positive results of the formal validation pro-
cess.
ACKNOWLEDGEMENTS
This work has received funding from the Shift2Rail
Joint Undertaking under the European Union’s Hori-
zon 2020 research and innovation programme, with
grant agreement No 777630, project MOMIT, “Multi-
scale Observation and Monitoring of railway Infras-
tructure Threats”.
REFERENCES
Barra, A., Solari, L., B
´
ejar-Pizarro, M., Montserrat, O.,
Bianchini, S., Herrera, G., Crosetto, M., Sarro, R.,
Gonz
´
alez-Alonso, E., Mateos, R. M., Lig
¨
u
´
erzana, S.,
L
´
opez, C., and Moretti, S. (2017). A methodology to
detect and update Active Deformation Areas based on
Sentinel-1 SAR images. Remote Sensing, 9(10):1002.
MOMIT (2017). Multi-scale observation and monitor-
ing of railway infrastructure threats. Home | MOMIT
project consortium. http://www.momit-project.eu/.
Web page; accessed 4-December-2018.
Navarro, J. A. and Cuevas, M. (2018a). los2hv -
Compute horizontal and vertical components of the
movement. http://www.momit-project.eu/results-and-
publications. MOMIT project technical note. Online;
accessed 4-December-2018.
Navarro, J. A. and Cuevas, M. (2018b). ADAfinder - A
tool to automate the detection of Active Deformation
Areas. http://www.momit-project.eu/results-and-
publications. MOMIT project technical note. Online;
accessed 4-December-2018.
Navarro, J. A., Cuevas, M., Barra, A., and Crosetto, M.
(2018a). Detection of Active Deformation Areas
based on Sentinel-1 imagery: an efficient, fast and
flexible implementation. In Proceedings of 18th
International Scientific and Technical Conference
(RACURS 2018), Crete, Greece.
Navarro, J. A., Cuevas, M., and Crosetto, M. (2018b).
ADAclassifier - Classify ADAs automati-
cally. http://www.momit-project.eu/results-and-
publications. MOMIT project technical note. Online;
accessed 4-December-2018.
Navarro, J. A., Cuevas, M., and Crosetto, M.
(2018c). SW data processing components test
plan. http://www.momit-project.eu/results-and-
publications. MOMIT project deliverable. Online;
accessed 4-December-2018.
Navarro, J. A., Tom
´
as, R., Cuevas, M., and Crosetto,
M. (2018d). SW data processing components
test report. http://www.momit-project.eu/results-and-
publications. MOMIT project deliverable. Online; ac-
cessed 4-December-2018.
Notti, D., Herrera, G., Bianchini, S., Meisina, S., Garc
´
ıa-
Davalillo, J. C., and Zucca, F. (2014). A methodol-
ogy for improving landslide PSI data analysis. Inter-
national Journal of Remote Sensing, (35):2186–2214.
doi: 10.1080/01431161.2014.889864.
Tom
´
as, R., Cano, M., Pastor, J. L., and Riquelme, A. (2018).
Automatic classification of Active Deformation
Areas. http://www.momit-project.eu/results-and-
publications. MOMIT project technical note. Online;
accessed 4-December-2018.
GISTAM 2019 - 5th International Conference on Geographical Information Systems Theory, Applications and Management
174
