
Securing Cargo during Transport on Roads of Different Quality
Martin Vlkovský
1
and Hana Vlachová
2
1
Department of Logistics, University of Defence, Kounicova 65, Brno, Czech Republic
2
Study Office, University of Defence, Kounicova 65, Brno, Czech Republic
Keywords: Transport Experiment, Road Safety, Cargo Securing, Shocks, Acceleration Coefficients, Statistical
Hypotheses Tests.
Abstract: The article compares the magnitude of shocks generated by the Tatra T-810 on two types of roads (high-
quality – highway and lower-quality – roads paved with granite blocks). As the primary data, sets of
acceleration coefficients in the three axes (x, y and z) were used as part of a transport experiment using a
three-axis accelerometer with a datalogger and a calibration certificate – OM-CP-ULTRASHOCK-5-CERT.
Data analysis is performed using descriptive statistics. The mean values and variations of measured
acceleration coefficients on the roads we examined are compared. The graphical comparison of the roads
studied is covered in a separate section. The results of the transport experiment show that the magnitude of
generated shocks is even higher at a lower average transport speeds on a low-quality roads. The distribution
of acceleration coefficient values also differs for both roads.
1 INTRODUCTION
Within the European Union (EU), over 76% of cargo
is transported using road transport (Fenollar-Solvay
et al., 2016). Over the last ten years (2008-2017), a
total of 147,047,868,000 tons of freight was
transported across the EU, an annual average of
14,704,787,000 tons of transported cargo
(EUROSTAT, 2018).
Due to these large volumes of cargo transported
by road, a high number of roads are overloaded.
According to the Road Transport Services Center,
established by the Ministry of Transport of the
Czech Republic, over a half of all vehicles are
overloaded during weight checks, which amount to
over 2,000 per year in the Czech Republic (CSPSD,
2014).
According to the Regional Road Administration
and Road Maintenance statistics, a single truck will
damage a road more than 10,000 passenger cars
(AKTUALNE, 2018). Cargo transport makes high
demands on road infrastructure that is more quickly
worn out (damaged). Annual maintenance is not
always able to ensure its required quality.
Quality of roadways directly affects the
magnitude of the inertial forces that affect cargo
during transport. Generally, on a damaged road,
characterized by a large amount of unevennesses
(holes, seals, etc.), higher values of acceleration
coefficients (shocks) that directly affect the
magnitude of inertial forces are assumed. On the
basis of the assumed size of inertial forces acting on
transport, it is necessary to choose appropriate
methods of securing (fastening) cargo and
evaluating the lashing capacity of the respective
fastening means.
Determining the magnitude of the inertia in the
actual transport is possible by using a suitable
measuring device (accelerometer) and the
appropriate calculation, mainly by using the
formulas from the norms, eg. EN 12195-1:2011
(UNMZ-EN 12195-1, 2011). Selected cargo
shippers and carriers use accelerometers to detect
undesirable shocks (acceleration) during shipment of
particularly fragile or otherwise sensitive goods
(dangerous goods etc.). These are, for example,
multinational companies DHL (DHL, 2018), GEIS
(GEIS, 2018) or TNT (TNT, 2018).
Exceptions do not even apply in an advanced
army, such as the United States Army, which
complements its transport and transport means
(mainly containers) with a set of measuring devices
that monitor (among others) the cargo space (SAVI
TECHNOLOGY, 2014). The temperature, relative
humidity, acceleration in individual axes, etc. are
determined in the respective transport means.
Vlkovský, M. and Vlachová, H.
Securing Cargo during Transport on Roads of Different Quality.
DOI: 10.5220/0007617900250032
In Proceedings of the 5th International Conference on Vehicle Technology and Intelligent Transport Systems (VEHITS 2019), pages 25-32
ISBN: 978-989-758-374-2
Copyright
c
2019 by SCITEPRESS – Science and Technology Publications, Lda. All rights reserved
25
From the point of view of inertial forces
influencing cargo, the key values of acceleration
coefficients in individual axes are primarily
influenced by the following three basic factors:
vehicle,
driver,
road (Lerher, 2015 and Vlkovský et al., 2018).
In the case of a vehicle, it is also important
whether it is moving with or without cargo. The key
technical factors of the vehicle are its tires, chassis,
structure of the vehicle hull and its connection with
the chassis, including the age of the vehicle and its
individual components, etc. The driver's driving
style is a significant factor, especially the speed of
the vehicle as well as driver skills, experience and
mental condition (Vlkovský et al., 2016 and
Vlkovský and Šmerek, 2018).
The purpose of this article is to prevent problems
associated with incorrect or insufficient cargo
securing through knowledge of the transport
parameters – the roads before it starts – and thus
increase transport safety. The risks associated with
inertia forces on cargo are generally higher for
specific shipments that are carried by the military or
components of the Integrated Rescue System
(Vlkovský et al., 2018).
2 TRANSPORT EXPERIMENT
The transport experiment was carried out on two
types of roads using a Tatra T-810 6x6 (T-810) with
less than 45,000 km. The first type of highway was
the D1 highway, measured from Brno to Vyškov and
back. The second type was a lower quality transport
road (third class road); a paved road measured from
the Vyškov to Vyškov-Dědice training polygon and
back.
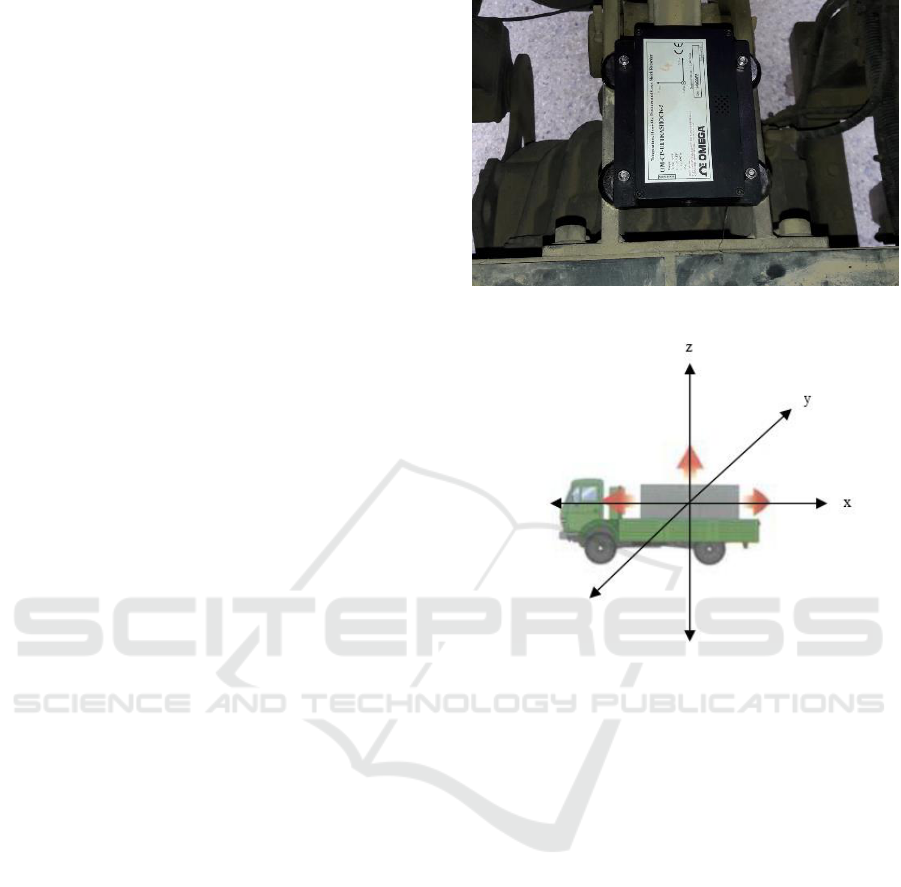
The transport experiment was undertaken by one
professional driver and a 3-axis accelerometer with a
datalogger and a calibration certificate – OMEGA-
OM-CP-ULTRASHOCK-5 (see the Figure 1).
A measuring range of ±5g was used to obtain the
values of the acceleration coefficients. A sampling
rate of 512 Hz was used with a record for every
second of the highest (or possibly) lowest value of
the respective acceleration coefficient in the given
axis (x, y and z) (Grzesica, 2018). The axes are
designated according the Figure 2: x – longitudinal,
y – transverse and z – vertical.
Figure 1: Mounting of the measuring device.
Figure 2: Axes designation (PRORIDICE, 2019).
The accelerometer was mounted on the steel
center frame of the vehicle body in the front of the
T-810 load compartment and the transport
experiment was carried out without any load.
Optimal climatic conditions included dry roads,
excellent visibility, absence of congestion and
rainfall. Outdoor temperature was in the range of 7-
11° C.
2.1 Methods
To accomplish a comparison of the above described
roads, as specified in section 2.2, descriptive
statistics were used and basic descriptive
characteristics were found (mean values – arithmetic
mean, modus and median, scattering, slope
coefficients and kurtosis). Comparison also includes
the detection of extreme values in individual axes
(both positive and negative). The selected values are
compared with the use of one and two-choice tests
of statistical hypotheses on the equivalence of mean
values (arithmetic mean) and variance (part 2.3).
In a separate section (2.4) a graphical
comparison of the distribution of measured values of
VEHITS 2019 - 5th International Conference on Vehicle Technology and Intelligent Transport Systems
26
acceleration coefficients on the examined roads is
shown.
2.2 Basic Descriptive Characteristics of
Measured Data Files
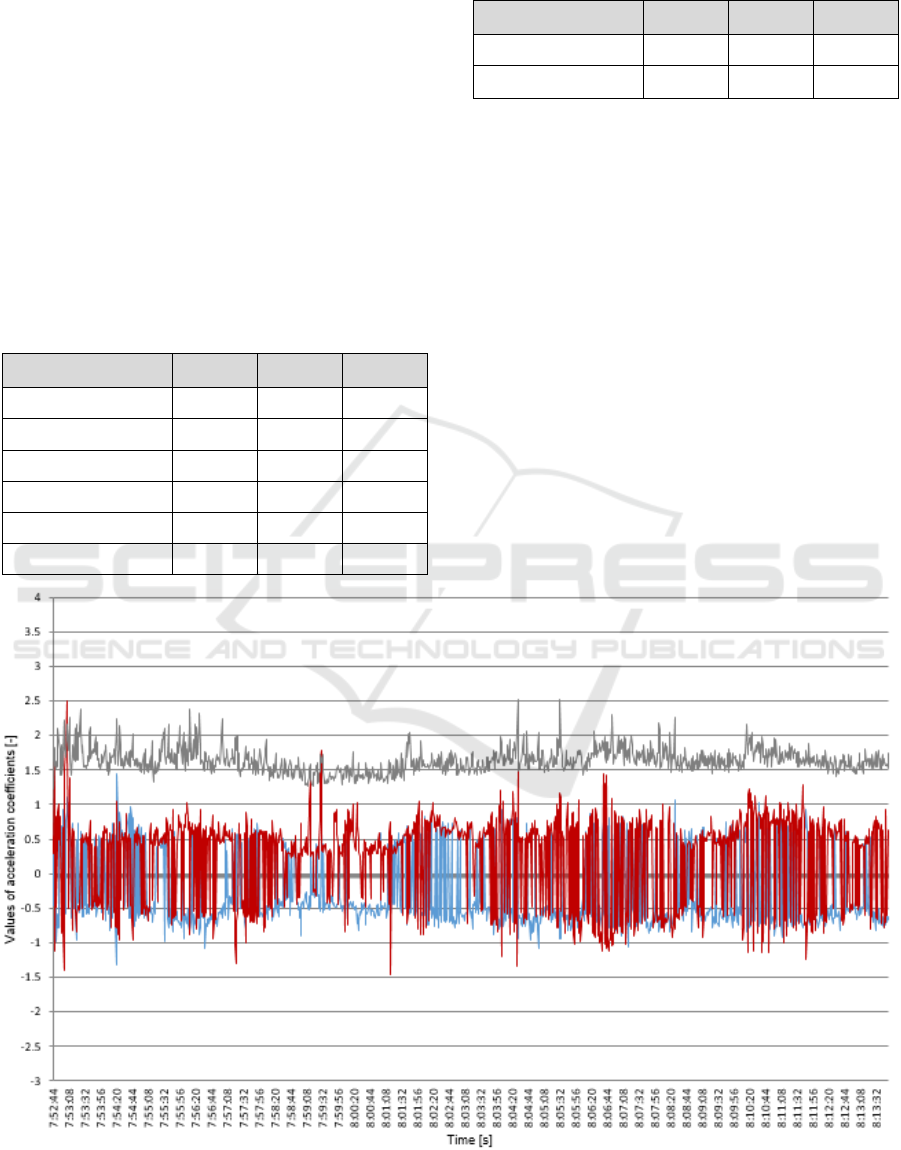
The first data file (formally marked as dataset 1) was
obtained on the Brno-Vyškov (highway) route (see
the Figure 3 with raw data). In a stretch of 27.0 km
long, a total of 3,804 values of acceleration
coefficients were recorded and the average vehicle
speed was 76.66 km·h
–1
. The basic descriptive
characteristics of dataset 1 as well as the extremes in
the individual axes, in both positive and negative
directions are illustrated in Tables 1 and 2.
Table 1: Dataset 1 – Basic descriptive characteristics.
Characteristics
x
y
z
Arithmetic Mean
–0.2953
0.2284
1.6381
Modus
–0.6100
0.5100
1.6000
Median
–0.5400
0.5000
1.6200
Variance
0.2923
0.4059
0.0304
Skewness Coeff.
1.0464
–0.5862
1.0127
Kurtosis Coeff.
–0.5327
–0.7773
2.2971
Table 2: Dataset 1 – Extremes of measured acceleration
coefficient values.
Extremes
x
y
z
Positive
1.4400
2.5100
1.5300
Negative
–1.3200
–1.4700
–
According to Table 1, a higher value of z-axis acuity
can be identified which is slightly elevated
(positive), while in the other two axes, the values are
less than 0. This is due, among other things, to the
displacement of the coordinate axis due to gravity
acceleration.
Z-axis scatter is also more than 13 times smaller
than the y-axis, respectively almost 10× in the x-
axis. Extremes – the highest and lowest values of the
acceleration coefficients in the individual axes are
given in Table 2.
The highest value of the acceleration coefficient
was in the y-axis where the measured value c
y
=
2.51, corresponding to 2.5 times the gravity
acceleration g.
The second data file (formally identified with
Dataset 2) was obtained on the route Vyškov – Brno
(highway). In a 27.0 km long section, a total of
4,059 values of acceleration coefficients were
recorded and the average speed of the vehicle was
Legend: blue – x axis, red – y axis, grey – z axis.
Figure 3: Dataset 1 – Raw data.
Securing Cargo during Transport on Roads of Different Quality
27

71.84 km·h
–1
. The basic descriptive characteristics
of Dataset 2 and the extremes in the individual axes,
in the positive and negative directions, are presented
in Tables 3 and 4.
Table 3: Dataset 2 – Basic descriptive characteristics.
Characteristics
x
y
z
Arithmetic Mean
–0.2530
0.2226
1.7075
Modus
–0.6500
0.6900
1.6700
Median
–0.5900
0.5700
1.6900
Variance
0.4330
0.5169
0.0291
Skewness Coeff.
0.7439
–0.5277
1.1093
Kurtosis Coeff.
–1.1524
–1.2530
5.5130
Table 4: Dataset 2 – Extremes of measured acceleration
coefficient values.
Extremes
x
y
z
Positive
1.6700
2.3100
1.9600
Negative
–1.3600
–1.2900
–
Table 3 shows a higher coefficient of kurtosis in
the z-axis. The highest measured value within
Dataset 2 (Table 4) was in the y-axis (c
y
= 2.31),
roughly equivalent to 2.3 times the gravity
acceleration g.
A third data set (formally marked with Dataset 3)
was obtained on the Vyškov – training polygon
Vyškov-Dědice (the road paved with granite blocks).
Over a 4.3 km long section, a total of 1,182
acceleration coefficient values were recorded and
the average vehicle speed was 39.29 km·h
–1
. The
basic descriptive characteristics of Dataset 3 and the
extremes in the individual axes, in the positive and
negative directions, are presented in Tables 5 and 6.
Table 5: Dataset 3 – Basic descriptive characteristics.
Characteristics
x
y
z
Arithmetic Mean
–0.1904
0.0730
1.9924
Modus
0.4500
0.4100
1.6000
Median
–0.5150
0.4500
1.9500
Variance
0.7927
1.0016
0.1784
Skewness Coeff.
0.1441
–0.2296
0.9992
Kurtosis Coeff.
–1.1163
–1.0862
1.9430
Table 6: Dataset 3 – Extremes of measured acceleration
coefficient values.
Extremes
x
y
z
Positive
1.8300
2.2800
3.1100
Negative
–3.0800
–2.4400
–
Table 5 identified higher kurtosis in the z-axis.
The highest measured value within Dataset 2 (Table
6) was in the z axis (c
z
= 3.11), roughly equivalent to
more than 3.1 times the gravity acceleration g.
A fourth data set (formally marked with Dataset
4) was obtained on the training polygon Vyškov-
Dědice – Vyškov (road paved with granite blocks).
Along a 4.3 km long section, a total of 1,203
acceleration coefficient values were recorded and
the average speed of the vehicle was 38.60 km·h
–1
.
The basic descriptive characteristics of Dataset 4 and
extremes in individual axes, positive and negative,
are given in Tables 7 and 8.
Table 7 shows the difference in variance of the z
axis, which is significantly lower than that of the
other two axes. The highest measured is in the y-axis
(c
z
= 2.70), which corresponds to 2.7 times the
gravitational acceleration g.
Table 7: Dataset 4 – Basic descriptive characteristics.
Characteristics
x
y
z
Arithmetic Mean
–0.4425
0.0562
2.0047
Modus
–0.8000
0.8300
2.0000
Median
–0.7300
0.4500
1.9500
Variance
0.7532
1.1867
0.1742
Skewness Coeff.
0.9505
0.0755
0.8825
Kurtosis Coeff.
–0.1423
–1.1141
0.7597
Table 8: Dataset 4 – Extremes of measured acceleration
coefficient values.
Extremes
x
y
z
Positive
1.9700
2.7000
2.6300
Negative
–2.3000
–2.4200
–
2.3 Statistical Hypotheses Tests
For the purpose of comparing a high-quality road
(highway) with a poor quality road (paved with
granite blocks), partial zero and alternative
hypotheses were formulated to compare the
individual datasets (d
1
– d
4
) in pairs. Two single-
VEHITS 2019 - 5th International Conference on Vehicle Technology and Intelligent Transport Systems
28

choice tests of partial statistical hypotheses were
used for testing:
mean values compliance test,
variances compliance test.
The zero hypothesis is assumed to be valid (resp.
partial zero hypotheses for the respective dataset
pairs) concerning the parity of the relevant dataset
parameters, for the mean values
µ = µ
0
, resp.
variances σ
2
= σ
2
0
. For an alternative hypothesis in
the double – side test applies µ ≠ µ
0
, resp. σ
2
≠ σ
2
0
.
Subsequently, one-sided tests are performed to
determine whether µ ˃ µ
0
or µ ˂ µ
0
, resp. σ
2
˃ σ
2
0
or
σ
2
˂ σ
2
0
.
For test purposes, a critical value range was
constructed and a test criterion value calculated.
To test the hypothesis an appropriate statistic T =
T(x
1
, x
2
, . . . , x
n
) is used, the so-called test criterion
that has, when the zero hypothesis is valid, known
probability distribution (Student's or t distribution).
The area of these values of statistics is divided
into two disjoint fields:
W
1−α
is the domain of accepting a zero
hypothesis – a set of values that testify in
favor of a zero hypothesis,
W
α
is a critical domain (domain of zero
hypothesis rejection) – that testify in favor of
an alternative hypothesis.
For example, for the hypothesis test of the mean
value µ of the normal distribution zero hypothesis: µ
= µ
0
→ alternative hypothesis: µ > µ
0
will be critical
domain W
α
= {t,t ≥ t
1−α
(ν)}, where µ
0
is the expected
value of the parameter µ, t is the value of the test
criterion and t
1−α
(ν) is quantile of Student's
distribution – so-called critical value (Neubauer, et
al., 2016). Tests for variances are performed
analogously. For all tests, the level of significance
chosen was α = 0.05.
On the basis of these tests, the individual partial
zero hypotheses were verified, from which the
relevant conclusions are subsequently formulated.
A normality test was performed prior to
statistical analysis. Normality was verified
graphically using Q-Q plots (Johnson and Wichern,
2007), including the determination of skewness and
kurtosis coefficients. Minor deviations from
normality were found, especially when testing the
kurtosis of distribution. However, the graphical
analysis did not show significant deviations from
normality, theoretical quantil and the corresponding
empirical quantils were approximately on a straight
line (Vlkovský et al., 2017).
The Stat1 software tool was used to perform
statistical hypothesis tests. (Neubauer et al., 2016).
In individual partial tests (Table 9), the
hypotheses on equivalence of the mean values are
always tested (arithmetic means in absolute value)
µ
i(abs)
for given values of acceleration coefficients in
individual axes (c
x
, c
y
and c
z
). Analogously,
variances in acceleration coefficients in individual
axes are tested. The aim of the tests is to find out
whether the individual data sets (d
1
– d
4
)
significantly statistically differ at the α = 0.05 level
of significance.
Table 9 shows that, using a mean value
(arithmetic averages in absolute values), there is a
statistically significant difference between individual
datasets with the exception of d
3
– d
4
. Where it
shows the similarities of both files found on the
same road in the opposite direction. A statistically
significant difference between d
3
and d
4
was shown
only in the axes x and y.
Table 9: Comparison of mean values (in absolute values)
of acceleration coefficients in all three axes.
Characteristics
µ
i(abs)
Coef.
Dataset
c
x
c
y
c
z
d
1
–d
2
µ
1
<µ
2
µ
1
<µ
2
µ
1
<µ
2
d
1
–d
3
µ
1
<µ
3
µ
1
<µ
3
µ
1
<µ
3
d
1
–d
4
µ
1
<µ
4
µ
1
<µ
4
µ
1
<µ
4
d
2
–d
3
µ
2
<µ
3
µ
2
<µ
3
µ
2
<µ
3
d
2
–d
4
µ
2
<µ
4
µ
2
<µ
4
µ
2
<µ
4
d
3
–d
4
µ
3
<µ
4
µ
3
<µ
4
NO
Note: NO indicates the non-demonstration of a
statistically significant difference between the monitored
data files at the level of significance α = 0.05. Greens are
marked with statistically significant differences
demonstrated for all three axes.
From partial hypothesis tests it follows that, from
the point of view of the mean values (arithmetic
averages in absolute values), there is a statistically
significant difference at the level of significance α =
0.05 between a high-quality road (highway) and a
lower quality road (paved with granite blocks). The
conclusion is valid in both directions. Because it is
valid, it means that values are statistically
significantly lower (in all three axes) for datasets 1
and 2 compared to datasets 3 and 4.
Securing Cargo during Transport on Roads of Different Quality
29
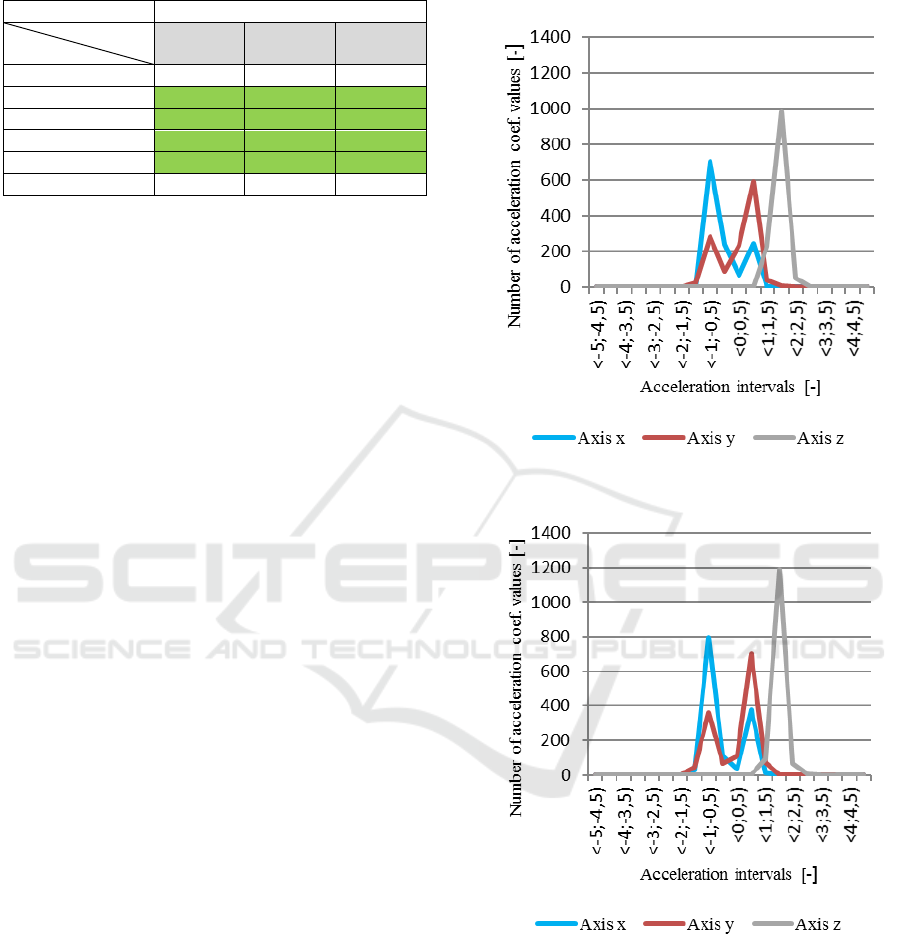
Table 10: Comparison of variances acceleration
coefficients across all three axes.
Characteristics
σ
i
2
Coef.
Dataset
c
x
c
y
c
z
d
1
–d
2
σ
1
2
<σ
2
2
σ
1
2
<σ
2
2
NO
d
1
–d
3
σ
1
2
<σ
3
2
σ
1
2
<σ
3
2
σ
1
2
<σ
3
2
d
1
–d
4
σ
1
2
<σ
4
2
σ
1
2
<σ
4
2
σ
1
2
<σ
4
2
d
2
–d
3
σ
2
2
<σ
3
2
σ
2
2
<σ
3
2
σ
2
2
<σ
3
2
d
2
–d
4
σ
2
2
<σ
4
2
σ
2
2
<σ
4
2
σ
2
2
<σ
4
2
d
3
–d
4
NO
NO
NO
Note: NO indicates the non-demonstration of a
statistically significant difference between the monitored
data files at the level of significance α = 0.05. Greens are
marked with statistically significant differences
demonstrated for all three axes.
Table 10 shows that, by using variances, there is
a statistically significant difference between
individual datasets with the exception of d
1
and d
2
,
respectively d
3
and d
4
. Where the similarity can be
seen in both pairs of files found on the same traffic
path in the opposite direction. Statistically
significant difference d
1
– d
2
is only shown in the
axes x and y. Between the d
3
– d
4
datasets a
statistically significant difference was not
demonstrated in either of the axes
Partial hypothesis tests show that, from the point
of view of the variances, there is a statistically
significant difference in the level of significance α =
0.05 between a high-quality transport road
(highway) and a lower quality road (paved with
granite blocks). The conclusion is valid in both
directions, because the results show that variances
are statistically significantly lower (in all three axes)
for dataset 1 and 2 compared to dataset 3 and 4. For
some axes, it can be assumed that a statistically
significant difference between the pairs of the
dataset with a higher test strength (at the level of
significance α = 0.01) would be demonstrated.
2.4 Graphical Comparison of Roads
The individual datasets (d
1
– d
4
) can be viewed in
terms of the number of values of the acceleration
coefficients in the individual axes that fall within the
respective intervals. Figures 4 – 7 show the
frequencies of acceleration coefficients in individual
axes, divided into intervals of multiples of
gravitational acceleration (0.5g).
It can be seen from Figures 4 – 7 that the
character of the distribution of values at individual
intervals differs significantly between the tested
roads. Although the frequencies of the acceleration
coefficients differ, it is possible to illustrate the
different character of the high-quality road
(highway) and the lower quality road (road paved
with granite blocks).
Figure 4: Dataset 1 – Frequency of acceleration
coefficients.
Figure 5: Dataset 2 – Frequency of acceleration
coefficients.
This conclusion can be demonstrated by the
number of intervals in which the values of the
coefficients of acceleration in the individual axes
fall. While for dataset 1 it is 6 in the x-axis, 8 in the
y-axis and 4 in the z-axis, respectively 7, 8 and 4 for
dataset 2, on lower quality road it is for the dataset 3
in the x-axis 10, in the y-axis 10 and in the z-axis 7,
respectively 9, 11 and 6 for dataset 4.
VEHITS 2019 - 5th International Conference on Vehicle Technology and Intelligent Transport Systems
30
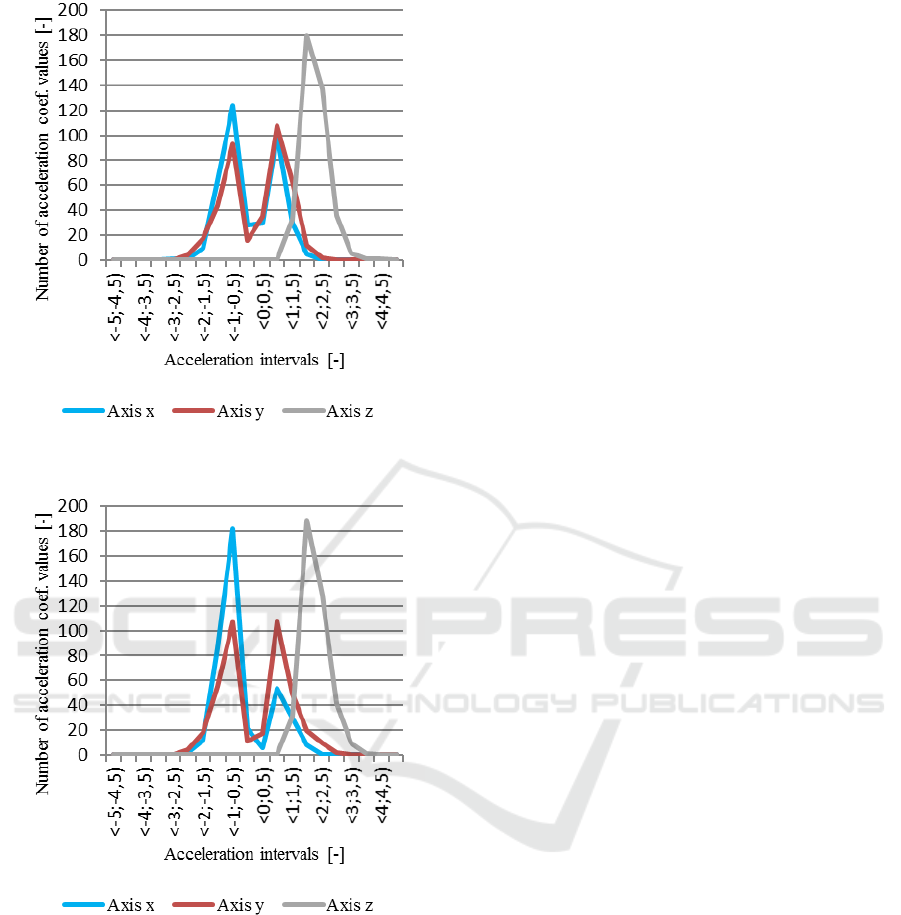
Figure 6: Dataset 3 – Frequency of acceleration
coefficients.
Figure 7: Dataset 4 – Frequency of acceleration
coefficients.
3 RESULTS AND DISCUSSION
On the basis of these comparisons, it is obvious that
even at a lower average speed (about half) there is a
statistically significant difference between the tested
roads at the significance level α = 0.05. This
conclusion applies to both tested basic descriptive
characteristics (mean values in absolute values as
well as variance of values of acceleration
coefficients in all three axes).
It can be concluded that the T-810 vehicle
generates on lower quality road (third class road) in
average greater shocks (higher values of acceleration
coefficients) even at about half the average transport
speed. At higher speeds on a lower quality road,
even greater differences in shocks can be expected.
Generated shocks can be quantified as inertial forces
that act not only on the cargo but also on the vehicle
and the driver.
The graphical comparisons show a different
distribution of values for each type of road.
Primarily the graphical view of their variance in
single intervals of 0.5g differs significantly.
Whereas for dataset 1 and 2 there is an average
variance at 6 intervals, for datasets 3 and 4 it is
almost at 9 intervals.
4 CONCLUSIONS
The shocks generated by trucks significantly
influence the life of the road and the vehicle. In the
short term, there is a key impact on the cargo, that
can be released or damaged by the effect of the
shocks (the magnitude of the acceleration
coefficients exceeding normative values according
to EN 12195-1:2011). In addition, the unfastening of
the cargo may carry secondary risks such as damage
to the vehicle, other technical means on the vehicle,
cause a traffic accident involving personal injury,
damage to the environment or other property
damage (Vlkovský et al., 2017).
The results of the analysis presented by the
article can be mainly used to optimize the fastening
of cargo by choosing a more suitable fastening
system, or fasteners with the corresponding lashing
capacity. Lashing capacity must correspond to actual
shocks (the magnitude of the acceleration
coefficients, respectively resulting inertial forces),
rather than simply theoretical assumptions of the
standards.
A specific area of transport is the shipping of
dangerous items, especially those that are directly
affected by the shocks. These primarily include
various types of explosives (Vlkovský and Rak,
2017), that are transported by the army using their
own or contracted vehicles. Transportation of
various fragile cargoes can also be considered as
problematic in this respect. Despite the use of
special packaging and vehicles for transport, types
of cargo more vulnerable to the negative effects of
shocks are mentioned.
In further research, the spectral analysis enable to
transform the data (signal) of the time series into a
Securing Cargo during Transport on Roads of Different Quality
31

frequency domain, which allows examination of
other aspects of transport – cargo securing (Grzesica
and Wiecek, 2016).
ACKNOWLEDGEMENTS
The paper was written with the support of the project
of long-term strategy of organization development:
ROZVOLOG: Development of Capabilities and
Sustainability of Logistics Support (DZRO
ROZVOLOG 2016–2020), funded by the Ministry
of Defense of the Czech Republic.
REFERENCES
Fenollar-Solvay, A. et al., 2016. New Intermodal Loading
Units in the European Transport Market. In
Automation, Communication and Cybernetics in
Science and Engineering. Springer. DOI: 10.1007/9
78-3-319-42620-4_52
EUROPEAN COMMISION – EUROSTAT. Ec.europa.eu.
(2018). Goods Transport by Road. [online] Available
at: http://ec.europa.eu/eurostat/tgm/table.do?tab=table
&init=1&language=en&pcode=ttr00005&plugin=1
[Accessed 12 Nov. 2018]
CENTER OF ROAD TRANSPORT SERVICES.
Cspsd.cz. (2014) [online]. Mobile Expert Units.
Available at: http://www.cspsd.cz/mobilni-expertni-
jednotky [Accessed 10 Nov. 2018]
AKTULANE – AUTO. Aktualne.cz (2018) [online]. One
Overloaded Truck Destroys the Road More than
10,000 Cars. Available at: https://zpravy.aktualne.cz/
ekonomika/auto/jeden-pretizeny-kamion-znici-silnici-
vic-nez-10tisic-osobnic/r~ed413f3a900011 e89f80ac1f
6220ee8/?redirected=1535978107 [Accessed 25 Sep.
2018]
EN 12195-1, 2011. Load Restraining on Road Vehicles –
Safety – Part 1: Calculation of Securing Forces.
UNMZ.
DHL. Dhl.com. (2018) [online]. Transportation
Managements. Available at: http://www.dh l.com/en/
logistics/industry_sector_solutions/consumer_logistics
/transportation_management.html#.WtiCQtRua70
[Accessed 05 Nov. 2018]
GEIS. Geis-group.com. (2018) [online]. Global Logistics.
[online]. Available at: https://www.geis-group.com/en
/ltl-and-ftl [Accessed 06 Nov. 2018]
TNT. Analysis.tu-auto.com. (2018) [online]. Express and
Fleet Tlematics. Available at: http://analysis.tu-
auto.com/fleet-and-asset-management/tnt-express-and-
fleet-telematics [Accessed 06 Nov. 2018]
SAVI TECHNOLOGY. Savi.com. (2018) [online]. Get
Better Asset Data Using Proven Sensor and Reader
Hardware. Available at: http://www.savi.com/wp-cont
ent/ uploads/Hardware_Overview_Final.pdf [Accessed
01 Nov. 2018]
Lerher, T., 2015. Cargo Securing in Road Transport
Using Restraining Method with Top-over Lashing.
New York: Nova. ISBN 978-1-61122-002-5.
Vlkovský, M. et al., 2018. Cargo Securing and its
Economic Consequences. In Transport Means 2018 –
Proceedings of the 22nd International Scientific
Conference Part I. Kaunas University of Technology.
ISSN 1822-296X.
Vlkovský, M. et al., 2016. The Cargo Securing based on
European Standards and its Applicability in Off-road
Transport Conditions. In ICTTE Belgrade 2016 –
Proceedings of the Third International Conference on
Traffic and Transport Engineering. Transport Means
2018 – Proceedings of the 22nd International
Scientific Conference Part I. City Net Scientific
Research Center Ltd. ISBN 978-86-916153-3-8.
Vlkovský, M., Šmerek, M., 2018. Statistical Analysis of
Driving Style and its Effect on Cargo Securing. In:
ICTTE Belgrade 2018 – Proceedings of the Fourth
International Conference on Traffic and Transport
Engineering. City Net Scientific Research Center Ltd.
ISBN 978-86-916153-X-X.
Vlkovský, M. et al., 2018. Wavelet Based Analysis of
Truck Vibrations during Off-road Transportation. In:
VETOMAC XIV – The 14th International Conference
on Vibration Engineering and Technology of
Machinery. MATEC Web of Conferences.
Grzesica, D. et al., 2018. Measurement and Analysis of
Truck Vibrations during Off-road Transportation. In:
VETOMAC XIV – The 14th International Conference
on Vibration Engineering and Technology of
Machinery. MATEC Web of Conferences.
PRORIDICE. Proridice.eu. (2019) [online]. Cargo
Securing – Basic Information. Available at:
http://soubory.proridice.eu/naklady/upevneni_nakladu
CZ.pdf [Accessed 10 Jan. 2019]
Neubauer, J. et al., 2016. Principles of Statistics:
Applications in Technical and Economic Disciplines.
Grada. Prague, 1
st
edition. ISBN 978-80-247-5786-5.
Johnson, R. A., Wichern, D. W., 2007. Applied
multivariate Statistical Analysis. Prentice-Hall
International. ISBN 0130418072.
Vlkovský, M., et al., 2017. Cargo Securing During
Transport Depending on the Type of a Road. In
WMCAUS 2017 IOP Conference Series: Materials
Science and Engineering. IOP Publishing Ltd. ISSN
1757-8981.
Vlkovský, M., et al., 2017. Cargo Securing During
Transportation – Using Extreme Values. In Applied
Technical Sciences and Advanced Military Tech-
nologies. Nicolae Balcescu Land Forces Academy.
ISSN 1843-682X. ISBN 978-973-153-275-2.
Vlkovský, M., Rak, L., 2017. Cargo Securing in Selected
Vehicles and Transport of Explosives. Perner's
Contacts, 2017, Vol. XII, No. 3. ISSN 1801-674X.
Grzesica, D., Wiecek, P., 2016. Advanced Forecasting
Methods Based on Spectral Analysis. In WMCAUS
2016: Procedia Engineering. Elsevier. ISSN 1877-
7058.
VEHITS 2019 - 5th International Conference on Vehicle Technology and Intelligent Transport Systems
32
