
Laser Induced Breakdown Spectroscopy of Diesel Particulate
Matter Exhaust Emissions Generated from on Road Diesel Engine:
Light Duty Vehicles
Richard Viskup, Christoph Wolf and Werner Baumgartner
Institute of Biomedical Mechatronics, Johannes Kepler University Linz, Altenberger str. 69, 4040 Linz, Austria
Keywords: Laser Induced Plasma, Laser Induced Breakdown Spectroscopy, LIBS, Laser Induced Plasma Spectroscopy,
LIPS, Optical Emission Spectroscopy, Particulate Matter, PM, DPM, Soot, Black Carbon, Carbon Black,
Diesel Combustion Engine, Engines, Emissions, Diesel Emissions, Diesel Exhaust, Diesel, Diesel Engine,
WHO, Air Quality.
Abstract: In this research we apply Laser Induced Breakdown Spectroscopy (LIBS) technique for high resolution
spectrochemical analysis of Diesel Particulate Matter - DPM exhaust emissions. DPM has been collected
from real, on road - Light - Duty Vehicles, driven by combustion Diesel engine. We have been concerned
with the main chemical elements, presents in various type of real Diesel particulate matter. From LIBS
measurements, it has been shown, that the plasma electron density can be use for the basic classification of
different types of DPM matrices. The excitation temperatures of atoms and ions in plasma can be use for
further quantitative analyses of diverse Diesel Particulate Matter. The aim of this study is to reveal the
compounds, which are mostly dominant in the Diesel engine exhaust emissions and can affect the overall
composition of the DPM. The presence of these elements in exhaust emission may point to different
processes, mainly to fuel quality, insufficient engine combustion process, incomplete catalytic reaction,
inefficient Diesel particulate filtering technique, or failure of the Diesel engine.
1 INTRODUCTION
Diesel combustion engine driven vehicles are
currently failing to follow the Euro 6 vehicle
emission standards in real driving environment, due
to the strict emission norms (Ntziachristos, 2016;
Zacharof, 2016; Commission Regulation EU
2016/646). The current existing emission standards
Euro 6 (Commission Regulation EC 692/2008;
Regulation EC 715/2007), Tier 3 (United States
Environmental Protection Agency, Regulations) or
LEV III (California Environmental Protection
Agency), for Diesel engine passenger vehicles are
the norms for hydrocarbons, carbon monoxide,
nitrogen oxides and for particulate matter (PM) from
Diesel exhaust emissions, as the total number of all
particles.
However, there are no other emission standards
for additional compounds or chemical elements
contained in the exhaust gas, Diesel particulate
matter, PM, or in the soot formed from the Diesel
combustion engine. Even though these chemical
elements additional to Carbon, present in the
particulate matter, forms very significant fraction of
the total DPM or the soot emissions content.
In this research we apply Laser Induced
Breakdown Spectroscopy technique (Noll, 2012;
Miziolek, 2006; Cremers, 2006) for diagnostics of
DPM, formed from combustion Diesel engine
exhaust emissions, mainly concerning the detection
of main chemical elements presents in various DPM
matrices.
Laser Induced Breakdown Spectroscopy is an
emerging measurement technique (Hahn, 2012) for
rapid qualitative (Noll, 2014) and sensitive
quantitative compositional analysis (Fortes, 2013;
Wang, 2016) of various forms of materials like
solids (Viskup, 2012), liquids (Samek, 2000), gases
(Effenberger, 2010), powders (Stehrer, 2009) or
nanoparticles (Viskup, 2008).
The aim of this study is to measure the main
compounds, that are present in these exhaust
emissions and can mostly affect the chemical
composition of the DPM. The presence of these
elements in exhaust emissions may point to different
processes, mainly to insufficient engine combustion
308
Viskup, R., Wolf, C. and Baumgartner, W.
Laser Induced Breakdown Spectroscopy of Diesel Particulate Matter Exhaust Emissions Generated from on Road Diesel Engine: Light Duty Vehicles.
DOI: 10.5220/0007618203080314
In Proceedings of the 7th International Conference on Photonics, Optics and Laser Technology (PHOTOPTICS 2019), pages 308-314
ISBN: 978-989-758-364-3
Copyright
c
2019 by SCITEPRESS – Science and Technology Publications, Lda. All rights reserved
process, unburned Diesel, incomplete catalytic
reaction, inefficient Diesel particulate filtering
technique, or failure of the Diesel engine.
2 EXPERIMENTAL SECTION
LIBS Setup
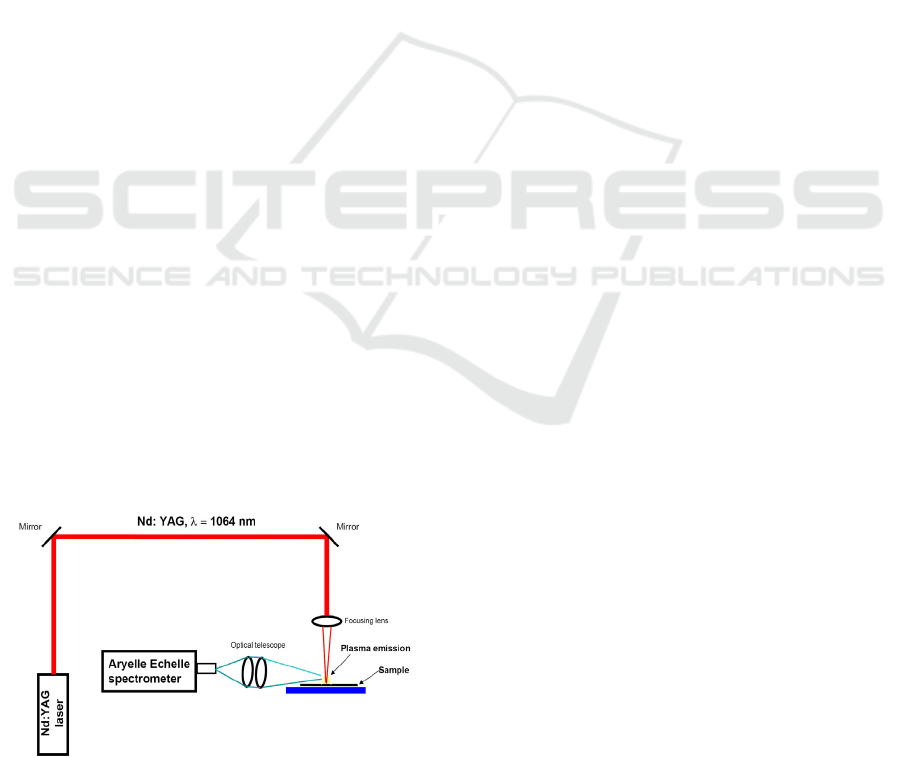
For Laser Induced Breakdown, the Nd:YAG solid
state laser from Quantel has been used. It has been
operated at the fundamental laser wavelength
1064nm with 8.5ns pulse duration and laser energy
300mJ per pulse. The laser radiation has been
focused with 10cm focusing lens into the plane solid
target surface to create plasma. Optical emission
from plasma has been collected perpendicularly via
optical telescope into the high resolution Echelle
spectrograph model Aryelle Butterfly from LTB
Berlin equipped with ICCD detector. Spectrometer
consists of two separate spectrographs, one part for
UV range from 190nm to 440nm and the second part
for VIS optical spectrum in range 440nm to 800nm.
Spectral resolution capability is from 3pm to 7pm
for VUV part and from 4pm to 8pm for VIS part,
thus providing spectral information of a broad
spectral range with very high resolution and
variability. Optical emission from plasma has been
collected from VUV as well as from VIS parts, thus
the total spectral window from 190nm to 800nm
wavelength has been recorded. The delay time 1μs
after the laser trigger and gate width 2μs were
always kept constant, as well as all experimental
parameters during the measurements. In earlier delay
time as 1μs the black body radiation is dominating
in laser plasma, while in time later than 3μs the
atomic and ionic emissions are decaying. The LIBS
emission has been recorded in open air atmosphere
under atmospheric pressure and at room
temperature.
Figure 1: Layout of LIBS experimental setup.
Sample Preparation and Collection
More than 60 different samples from real Diesel
engine passenger vehicles of major brand car
producers in Europe have been analysed by LIBS.
Diesel Particulate Matter has been collected from the
tail pipe at the end of the exhaust manifold, after the
Diesel Particulate Filter (DPF), if it was applied.
Selections of the vehicles were performed randomly
and no company was given preference. The results
presented here are the selections of eight diverse
DPM matrices. Laser induced plasma spectroscopy
reveal optical emission lines that are characteristic
for UV and VIS spectral region. The collected
particulate matter from Diesel engine Light - Duty
vehicles exhaust has been mechanically pressed into
pellets with flat disc shape. Each displayed LIBS
spectrum has been averaged over twelve laser shots.
3 RESULTS AND DISCUSSION
3.1 Identification of the Main Matrix
Elements in DPM
Optical emission spectras from Laser Induced
Breakdown Spectroscopy measurement of Diesel
particulate matter obtained from selected eight
matrices, are shown in the Figure 2(a-h).
Diesel particulate matter is characterised by
strong optical emission from a) Carbon, b) Iron, c)
Magnesium, d) Aluminium, e) Chromium, f) Zinc,
g) Sodium and h) Calcium. Spectra shown here are
characteristic optical emission lines, dominating in
the LIBS spectral signal from 200nm to 800nm.
From figures 2(a-h) it is evident that the
chemical composition of selected eight matrices
differ considerably from each other. This is due to
the different origin of each DPM sample, and due to
the unique composition of the exhaust emissions
from Diesel engine vehicles. In fact, the source of
different compositions is the combination of the
Diesel fuel quality, composition of the intake air,
quality of the combustion process, type of the
engine, or performance of the engine. Other parts
that influence the total composition of DPM are
applied aftertreatment devices, like Diesel particle
filters (DPF) or catalysts like Selective Catalytic
Reduction devices. All count to the final chemical
composition of DPM.
Laser Induced Breakdown Spectroscopy of Diesel Particulate Matter Exhaust Emissions Generated from on Road Diesel Engine: Light Duty
Vehicles
309
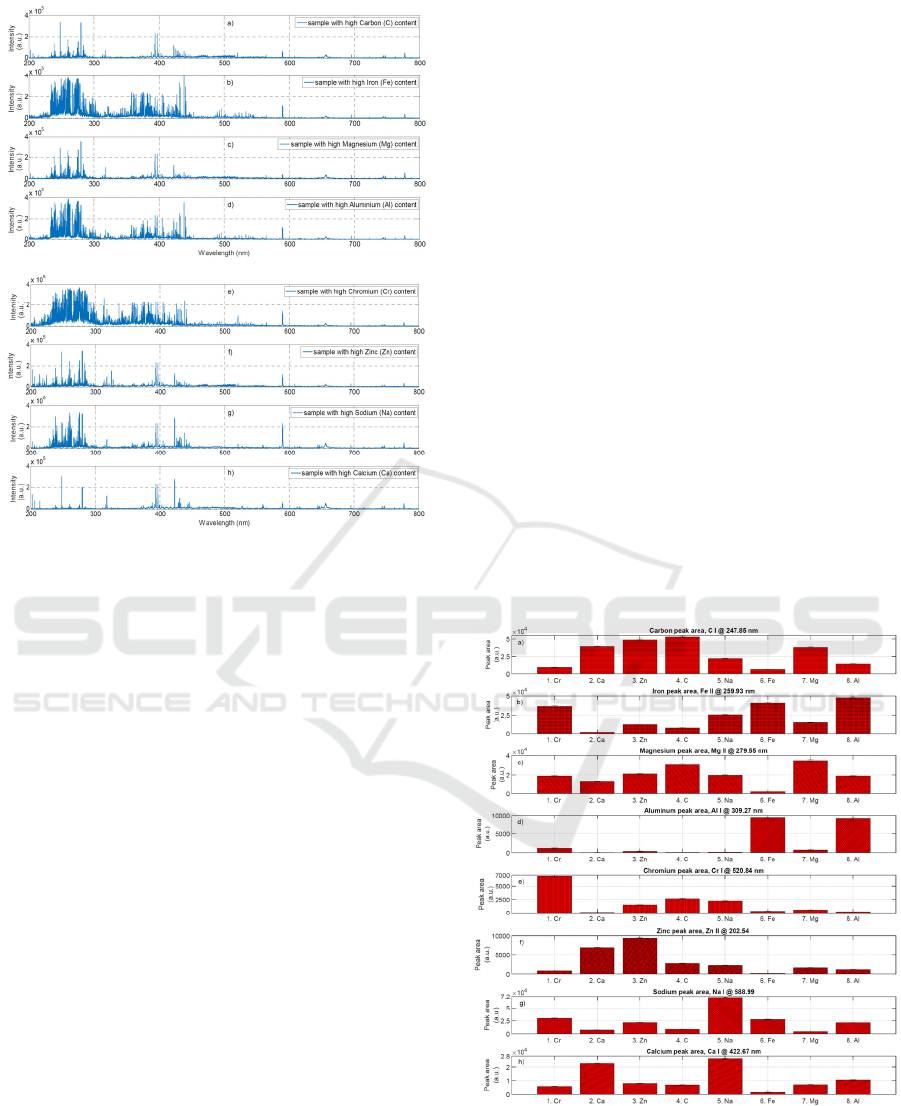
Figure 2: Optical emission spectras generated from Diesel
particulate matter measured by high resolution laser
induced plasma spectroscopy shows high content of: a)
Carbon, b) Iron, c) Magnesium. d) Aluminium, e)
Chromium, f) Zinc, g) Sodium and h) Calcium species.
3.2 Comparison of Different Diesel
Particulate Matter
From the optical emission spectra shown in the
Figure 2(a-h) we selected atomic and/or ionic
spectral lines that have a major impact to the line
intensity for each Diesel particulate matter matrix. In
the Figure 3(a-h) comparison of DPM samples with
high measured content of 1. Cr, 2. Ca, 3. Zn, 4. C, 5.
Na, 6. Fe, 7. Mg, 8. Al and calculated spectral peak
area of: a) Carbon, b) Iron, c) Magnesium, d)
Aluminium, e) Chromium, f) Zinc, g) Sodium, h)
Calcium - atomic or ionic lines are shown. Here, an
individual bar represents calculated peak area of
selected spectral atomic or ionic line. These have
been obtained after base line correction and
calculation of the fitted peak area under the spectral
line. From the bar graphs Figure 3, it is possible to
obtain relative values of the concentration of
chemical elements, presents in the DPM samples.
Two types of information can be obtained, by either
horizontal or vertical reading of this bar graph.
From horizontal reading of bar graph - Figure
3(a-h) it is possible to observe that Carbon (a)
content is not constant in DPM samples, but its
concentration rather change in the individual
samples (1-8). Iron (b) concentration also varies
from low to high in different matrices. Magnesium
(c) content is almost always high. Two DPM
matrices ( 6.Fe, 8.Al ) posses high value of
Aluminium (d). Chromium (e) as well as Zinc (f)
content plays important role within the DPM
matrices too. Diesel particulate matter contains also
Sodium (g) and Calcium (h), and its concentration
can be relatively high too.
From vertical reading of this bar graph Figure
3(a-h) it is possible to obtain information about
relative concentration of different elements in each
DPM matrix. Particularly, sample 1 consists of
relatively high level of Iron (b) and Chromium (e).
Sample 2: high level of Carbon (a), Zinc (f) and
Calcium (h). Sample 3: high level of Carbon (a),
Magnesium (c) and Zinc (f). Sample 4: higher level
of Carbon (a) and Magnesium (c). Sample 5
relatively high level of Iron (b), Magnesium (c),
Sodium (g) and Calcium (h). Sample 6: higher level
of Iron (b) and Aluminium (d). Sample 7: higher
level of Carbon (a), Iron (b) and Magnesium (c).
Sample 8: higher level of Iron (b) and Aluminium
(d).
Figure 3: Comparison of eight Diesel particulate matter
samples with mostly pronounced content of 1. Cr, 2. Ca, 3.
Zn, 4. C, 5. Na, 6. Fe, 7. Mg, 8.Al. Number indicate the
sample #, and element name indicate the main element
content in DPM matrix.
PHOTOPTICS 2019 - 7th International Conference on Photonics, Optics and Laser Technology
310
3.3 Calculation of the Plasma Electron
Density
In the case of thermal plasma, and in first
approximation, the total width of the line profile
mainly depends on electron density (Griem, 1997).
Thus a direct measurement of line profile, for which
the Stark effect is predominant, leads to electron
density, independent of the local thermal equilibrium
condition. Calculation of the plasma electron density
n
e
can be obtained from Stark broadening of H(α)
line by applying following formula (Gigosos, 2003):
(
)
0.67965
23 3
0.549
10
e
n
FWHA nm
m
−
=×
(1)
where FWHA shows the full width high amplitude
of the H(α) line broadening at 656.27 nm. Profiles
of H alpha spectral lines obtained from individual
DPM matrices with high C, Fe, Mg, Al, Cr, Zn, Na,
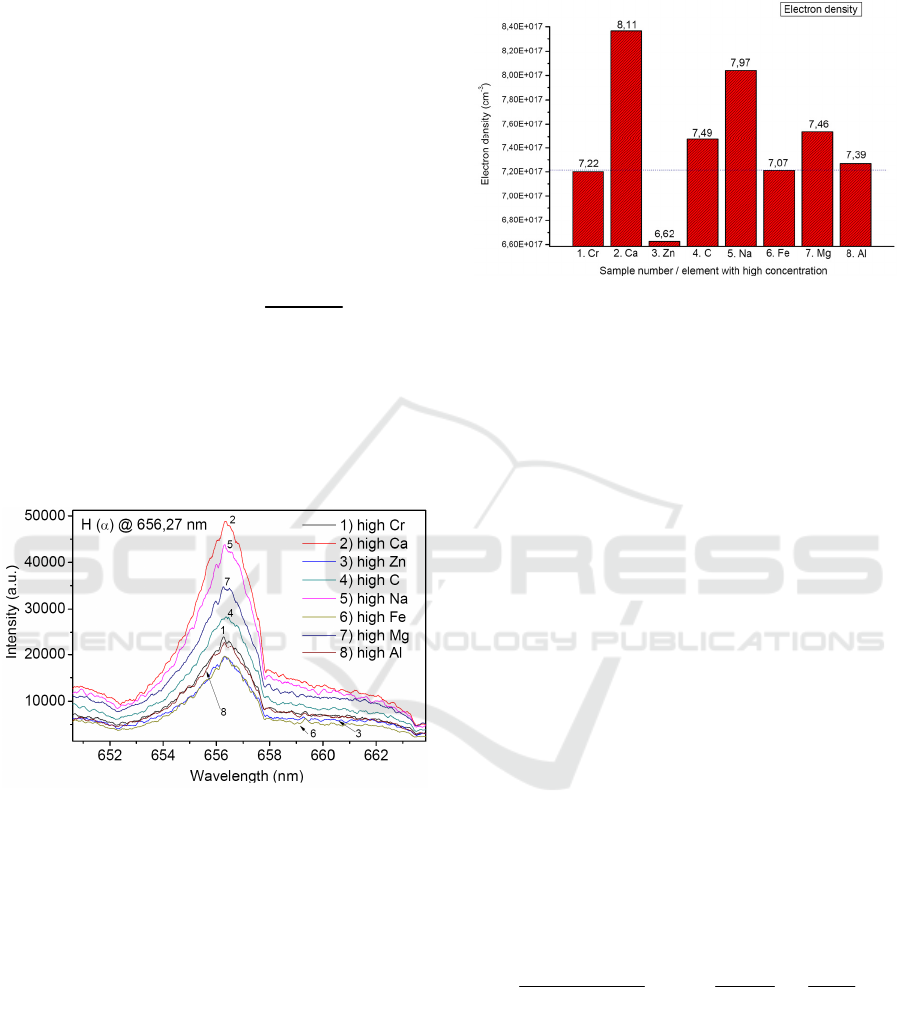
Ca content are shown in Figure 4.
Figure 4: Comparison of H alpha lines for various DPM
matrices.
From H(α) line broadening in the Figure 4 and
equation (1), the electron concentration n
e
has been
calculated in interval from 6.6 x 10
17
cm
-3
to 8.1 x
10
17
cm
-3
. Highest electron concentration n
e
= 8.11
x 10
17
cm
-3
and n
e
= 7.97 x 10
17
cm
-3
has been
obtained from sample with high content of Calcium
and Sodium respectively. Moderate electron density
from plasma were measured in samples with high
content of Magnesium n
e
= 7.46 x 10
17
cm
-3
, Carbon
n
e
= 7.49 x 10
17
cm
-3
, Aluminium n
e
= 7
.39 x
10
17
cm
-3
, Iron n
e
= 7.07 x 10
17
cm
-3
and Chromium
n
e
= 7.22 x 10
17
cm
-3
. Low electron concentration in
plasma was obtained from sample with high content
of Zinc n
e
= 6.62 x 10
17
cm
-3
. The comparison of
reached electron density in laser induced plasma
from Diesel particulate matter is shown in Figure 5.
Figure 5: Comparison of electron density n
e
from laser
produced plasma obtained from eight different DPM
matrices. (numbers shown in bar graph are in 10
17
cm
-3
).
From the Figure 4 and 5 we can observe that
Diesel particulate matter respond to the same laser
irradiation conditions with different electron density.
This point to distinct type of plasma property for
each DPM matrix. However, very similar value of
electron density has been measured in case of 1.Cr,
6.Fe and 8. Al samples (shown with dotted line in
Figure 5). These are the samples, with measured
high concentration of Fe content. Here we can
conclude that electron density in laser-produced
plasma is alternating according to the matrix type
and chemical composition of DPM. Therefore, it can
be use for basic classification of different DPM
matrices.
3.4 Calculation of the Excitation
Temperature
If we assume the local thermal equilibrium in laser
plasma, excitation temperature T
exc
can be obtained
from the slope of the Boltzmann plot by calculating
the ratio of the relative atomic line intensities,
emitted from different excited energetic levels by
using the following formula:
,
.
ln ln
... ()
ul
iu
i
i u ul ul i exc
I
E
Fn
gAh ZT kT
λ
ν
=−
(2)
where I
λ
u ,l
is optical emission line intensity, g
i,u
is
the statistical weight of the upper excited state of the
chemical species i, A
u,l
is the corresponding
transition probability per unit time, h is the Planck’s
constant; ν
u,l
is the frequency of the photons emitted
due to transition from upper excited level u to the
Laser Induced Breakdown Spectroscopy of Diesel Particulate Matter Exhaust Emissions Generated from on Road Diesel Engine: Light Duty
Vehicles
311
lower level l; F is the factor depending upon
experimental setup; n
i
is the concentration of the
chemical species i; Z
i
is the partition function of the
chemical species i calculated at T
exc
, E
i,u
is the
energy of the upper excited state of the chemical
species i; k is the Boltzmann constant. For
calculation of excitation temperature T
exc
the
background corrected relative intensity of iron
atomic lines, emitted at three different excited
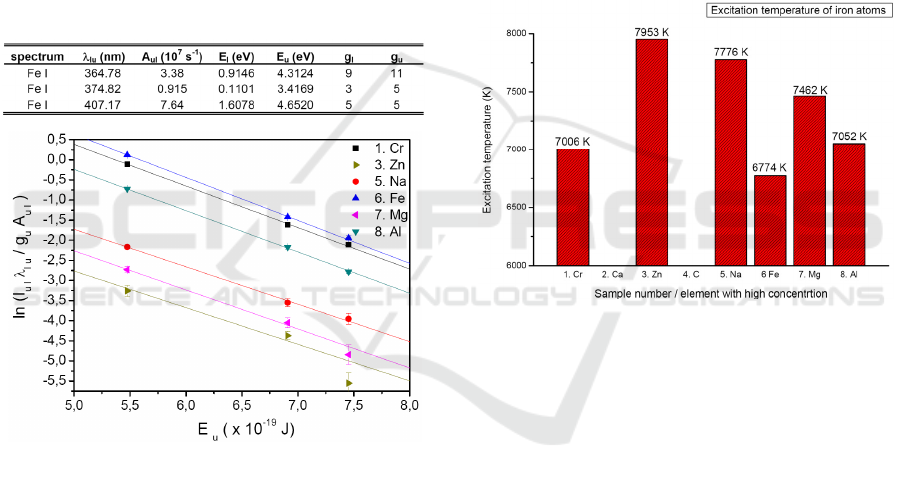
energetic levels have been used. In Table 1
spectroscopic parameters of atomic iron used for
construction of Boltzmann plot are given. Data have
been obtained from NIST atomic spectra database
(Kramida, 2015). In Figure 6, different Boltzmann
plots for DPM samples with high content of Cr, Zn,
Na, Fe, Mg and Al are shown.
Table 1: Spectroscopic parameters used for Boltzmann
plot.
Figure 6: Boltzmann plots and linear fit for determination
of T
exc
for Iron atoms, from DPM samples with high Cr,
Zn, Na, Fe, Mg and Al content.
From Boltzmann plot, in Figure 6 we can
observe that one sample with increased Zinc content
(3. Zn), data point lie outside of the linear curve.
This is due to the relatively weak iron spectral line,
measured at this wavelength. With lower
concentration of iron species in this sample, the
spectral line intensity decreases and became less
pronounced. Therefore, it was not possible to
construct the Boltzmann plot and calculate the
excitation temperature for the 2. Ca and 4. C sample,
where the concentrations of iron species are even
lower. It would be necessary to consider different
spectral lines. Figure 7 shows the comparison of
plasma excitation temperatures obtained for iron
atoms from DPM samples. From the linear fit and
slopes of the Boltzmann plots, plasma excitation
temperature T
exc
for Fe atoms has been calculated in
interval from 6774 K to 7953 K. Samples with
higher concentration of Fe species have lower
excitation temperature e.g. T
exc
(6. Fe) = 6774 K
compared to samples with low concentration of Fe,
where temperature needed for excitation of these
atoms was T
exc
(3. Zn) = 7953 K. The excitation
temperature of Fe atoms in plasma is related to the
Iron concentrations in the Diesel Particulate Matter.
Therefore T
exc
parameter can be use for quantitative
measurements of DPM. However calculation of the
Boltzmann plots and calibration functions are
necessary preconditions for each element present in
the DPM matrix.
Figure 7: Comparison of the calculated excitation
temperature of iron atoms from eight DPM matrices with
high measured Cr, Zn, Na, Fe, Mg and Al content.
4 CONCLUSIONS
We have performed laser induced breakdown
spectroscopy (LIBS) measurements from more than
60 different samples of Diesel Particulate Matter.
DPM were obtained from real, on road - Light -
Duty Diesel engine vehicles. Selections of on road
passenger vehicles were performed randomly from
major brand car producers in Europe. We found that
DPM does not consist of purely / mainly carbon
particles. However DPM contains many additional
compounds - chemical elements with various
concentrations. Indeed, we can classify Diesel
Particulate Matter into samples with high
concentration of Carbon, Iron, Magnesium,
Aluminium, Chromium, Zinc, Sodium and Calcium
content. These elements, form major compounds of
DPM matrix. With the use of laser induced
PHOTOPTICS 2019 - 7th International Conference on Photonics, Optics and Laser Technology
312

breakdown spectroscopy, we can very precisely
measure elements that are majorly presents in
different DPM. The major compounds that are well
presents in the DPM are Carbon, Magnesium,
Sodium and Calcium. The other major compounds
that are also presents in the DPM are Iron,
Aluminium, Chromium and Zinc. The
concentrations of these elements are changing
according to the Diesel engine vehicle. In this paper,
quantitative elemental analysis of DPM was not an
object. Instead rather qualitative, showing the major
chemical elements of different DPM matrices. We
have shown individual LIBS spectra's from eight
matrices. These are characterised with high
concentration of C, Fe, Mg, Al, Cr, Zn, Na and Ca
content. We have shown the basic laser plasma
properties obtained from various DPM matrices, and
we found that electron density n
e
in laser induced
plasma varies according to the DPM matrix.
Therefore it can be use for basic classification of
different types of DPM. This has been confirmed by
the calculating of the excitation temperature T
exc
of
iron atoms in DPM plasma from Boltzmann plots.
The excitation temperatures of atoms and ions in
plasma can be use for further quantitative analyses
of diverse Diesel Particulate Matter.
Here we have revealed the main chemical
elements presents in the various DPM matrices.
However further research is necessary to obtain
detail picture about the quantitative composition of
these elements. Understanding the chemical
composition of DPM can help to better control the
engine, as well as combustion process and thus
reduce unwanted emissions generated from Diesel
engine vehicles to meet future environmental
emission standards.
ACKNOWLEDGEMENTS
Authors would like to thank to the Austrian Science
Fund - FWF for providing financial support under
the project number [FWF, P 27967]. Additionally
authors would like to thank to Dr. Maria Rusnak for
the proofreading and for the corrections.
REFERENCES
Ntziachristos, L. et al. 2016. Implications of Diesel
emissions control failures to emission factors and road
transport NOx evolution, Atmospheric environment
141 542-551. doi: 10.1016/j.atmosenv.2016.07.036
N. Zacharof, et al. 2016. Type approval and real-world
CO2 and NOx emissions from EU light commercial
vehicles, Energy Policy 97 540-548. doi: 10.1016/
j.enpol.2016.08.002
Commission Regulation (EU) 2016/646. Commission
Regulation (EU) 2016/646 of 20. April 2016
amending Regulation (EC), (No 692/2008) as regards
emissions from light passenger and commercial
vehicles (Euro 6), http://eur-lex.europa.eu/eli/reg/
2016/646/oj
Commission Regulation (EC) 692/2008. Commission
Regulation (EC) 692/2008 of 18 July 2008
implementing and amending Regulation (EC) No
715/2007 of the European Parliament and of the
Council on type-approval of motor vehicles with
respect to emissions from light passenger and
commercial vehicles (Euro 5 and Euro 6) and on
access to vehicle repair and maintenance information,
[Online]. Available: http://eur-lex.europa.eu/eli/reg/
2008/692/oj
Regulation (EC) No 715/2007. Regulation (EC) No
715/2007 of the European Parliament and of the
Council of 20 June 2007 on type approval of motor
vehicles with respect to emissions from light
passenger and commercial vehicles (Euro 5 and Euro
6) and on access to vehicle repair and maintenance
information, [Online]. Available: http://eur-
lex.europa.eu/eli/reg/2007/715/oj
United States Environmental Protection Agency,
Regulations for Emissions from Vehicles and Engines,
Tier 3 Motor Vehicle Emission and Fuel Standards,
https://www.epa.gov
California Environmental Protection Agency, Low-
Emission Vehicle Program - LEV III,
https://www.arb.ca.gov/
Noll R. 2012. Laser-Induced Breakdown Spectroscopy,
Fundamentals and Applications, Springer-Verlag
Berlin Heidelberg, ISBN 978-3-642-20667-2
Miziolek A. W. et al. 2006. Laser-Induced Breakdown
Spectroscopy (LIBS), Fundamentals and Applications,
Cambridge University Press, ISBN 978-0-521-85274-6
Cremers D. A., Radziemski L. J., 2006. Handbook of
Laser-Induced Breakdown Spectroscopy, John Wiley
& Sons Inc, ISBN 978-0-470-09299-6
Hahn D.W., Omenetto N., 2012. Laser-Induced
Breakdown Spectroscopy (LIBS), Part II: Review of
Instrumental and Methodological Approaches to
Material Analysis and Applications to Different
Fields, Applied spectroscopy, 66 4 (2012) 347-419.
doi: 10.1366/11-06574
Noll R. et al. 2014. Laser-induced breakdown
spectroscopy expands into industrial applications,
Spectrochimica Acta Part B: Atomic Spectroscopy,
41–51 doi: 10.1016/j.sab.2014.02.001
Fortes, F.J., et al. 2013. Laser-Induced Breakdown
Spectroscopy, Analytical Chemistry, 85 2 (2013) 640-
669. DOI: 10.1021/ac303220r
Wang Z.Z., et al. 2016. Laser-induced breakdown
spectroscopy in Asia, Frontiers of Physics, 11 6
(2016) 114213 doi: 10.1007/s11467-016-0607-0
Viskup R., 2012. Single and Double Laser Pulse
Laser Induced Breakdown Spectroscopy of Diesel Particulate Matter Exhaust Emissions Generated from on Road Diesel Engine: Light Duty
Vehicles
313

Interaction with Solid State – Application to Plasma
Spectroscopy, Nd:YAG Laser, ed. D.C. Dumitras,
InTech, Rijeka, Croatia (2012) ISBN: 978-953-51-
0105-5., open access, http://www.intechopen.com/
books/nd-yag-laser
Samek O., et al. 2000. Application of laser-induced
breakdown spectroscopy to in situ analysis of liquid
samples, Optical Engineering, 39 8, 2248-2262. doi:
10.1117/1.1304855
Effenberger A. J., Scott J.R., 2010. Effect of Atmospheric
Conditions on LIBS Spectra, Sensors 10 5 4907-4925.
doi:10.3390/s100504907
Stehrer T., et al. 2009. Laser-induced breakdown
spectroscopy of iron oxide powder, Journal of
Analytical Atomic Spectrometry 24 , 973 – 978. doi:
10.1039/b817279j
Viskup R., et al. 2008. Plasma plume photography and
spectroscopy of Fe-Oxide materials, Applied Surface
Science, 255, 5215-5219. doi: 10.1016/j.apsusc.2008.
08.092
Griem H. R., 1997. Principles of Plasma Spectroscopy,
Cambridge University Press, ISBN 0521619416 .
Gigosos M. A., et al. 2003. Computer simulated balmer-
alpha, -beta and -gamma stark line profiles for non-
equilibrium plasmas diagnostics, Spectrochim. Acta,
Part B 58 (2003) 1489-1504.
Kramida, A., et al. 2015. NIST Atomic Spectra Database,
National Institute of Standards and Technology,
Gaithersburg, MD.
PHOTOPTICS 2019 - 7th International Conference on Photonics, Optics and Laser Technology
314
