
CPD: Crowd-based Pothole Detection
Florian Wirthmueller
1,3 a
, Jochen Hipp
1
, Kai-Uwe Sattler
2 b
and Manfred Reichert
3
1
Daimler AG, 71034 B
¨
oblingen, Germany
2
Databases and Information Systems Group, Ilmenau University of Technology, 98693 Ilmenau, Germany
3
Institute of Databases and Information Systems, Ulm University, 89081 Ulm, Germany
Keywords:
Road Surface Monitoring, Connected Vehicles, Template Matching, Spatial Aggregation, Big Data and
Vehicle Analytics, Real-World Sensor Data, Real-time Incident Detection, Vehicular Networks.
Abstract:
Potholes and other damages of the road surface constitute a problem being as old as roads are. Still, potholes
are widespread and affect the driving comfort of passengers as well as road safety. If one knew about the
exact locations of potholes, it would be possible to repair them selectively or at least to warn drivers about
them up to their repair. However, both scenarios require their detection and localization. For this purpose, we
propose a crowd-based approach that enables as many of the vehicles already driving on our roads as possible
to detect potholes and report them to a centralized back-end application. Whereas each single vehicle provides
only limited and imprecise information, it is possible to determine these information more precisely when
collecting them at a large scale. These more exact information may, for example, be used to warn following
vehicles about potholes lying ahead to increase overall safety and comfort. In this work, this idea is examined
and an offline executable version of the desired system is implemented. Additionally, the approach is evaluated
with a large database of real-world sensor readings from a testing fleet and therefore its feasibility is proved.
Our investigation shows that the suggested CPD approach is promising to bring customers a benefit by an
improved driving comfort and higher road safety.
1 INTRODUCTION
The automated detection of potholes and other road
damages constitutes a challenging task, which, for
example, needs to be accomplished by road author-
ities to monitor road conditions and manage the re-
construction of damaged road parts. According to
(Eisenbach et al., 2017b), the current process for cop-
ing with potholes on German highways is as follows:
First of all, images are collected with special camera-
equipped vehicles. Nowadays, the collected images
are then manually evaluated. The evaluation process
is supposed to be automated, but the procedure as a
whole will remain time-consuming. Currently, it may
take up to several months between the collection and
the evaluation of the images. Finally, the duration be-
tween evaluation and the execution of the repair activ-
ity needs to be added on top. Moreover, correspond-
ing test drives may only take place in a four year cy-
cle.
a
https://orcid.org/0000-0002-9732-2561
b
https://orcid.org/0000-0003-1608-7721
As potholes can at least partially exist for a longer
time, one would like to warn drivers about the pot-
holes lying ahead until their repair in order to increase
drivers’ comfort and make driving more safe. To cre-
ate a real benefit, it becomes necessary to detect road
damages nearly in real time or at least on a daily or
weekly basis. Dedicated measurement vehicles are
therefore not an adequate option, when considering
the huge road network to be covered. Instead, it is
worth enabling a fleet of already existing and driv-
ing vehicles to detect and report potholes. Thereby
one can take the fact into account that many vehicles
are already equipped with numerous sensors com-
bined with computational power and therefore form a
source for crowd data that solely has to be collected.
Hence this paper focuses the development and
prototypical implementation of a system that is able
to detect road damages in individual vehicles based on
already shored standard in-vehicle sensors (especially
wheel speed and spring deflection sensors). Further-
more the individual detections are shared and aggre-
gated by a back-end application.
The paper is organized as follows: In Section 2,
related work in the field of pothole detection and road
Wirthmueller, F., Hipp, J., Sattler, K. and Reichert, M.
CPD: Crowd-based Pothole Detection.
DOI: 10.5220/0007626700330042
In Proceedings of the 5th International Conference on Vehicle Technology and Intelligent Transport Systems (VEHITS 2019), pages 33-42
ISBN: 978-989-758-374-2
Copyright
c
2019 by SCITEPRESS – Science and Technology Publications, Lda. All rights reserved
33

condition monitoring systems is discussed. Section 3
introduces the developed system. Section 4 explains
the used evaluation metrics and discusses the results
of our work. Finally Section 5 concludes the paper
with a summary and an outlook on future work.
2 RELATED WORK
The topic of detecting potholes and speed bumps has
been considered in research for quite some time. Ac-
cordingly, a large number of research works with
varying motivations and used sensor setups exist.
Visual approaches, such as (Eisenbach et al.,
2017b; Eisenbach et al., 2017a; Seichter et al., 2018;
Jang and Park, 2016; Murthy and Varaprasad, 2014;
Mikhailiuk and Dahnoun, 2016), are based on the use
of 2D- or 3D-camera systems for detecting road dam-
ages. The techniques to assess the graphical mate-
rial are manifold, ranging from deep learning methods
(Eisenbach et al., 2017b; Eisenbach et al., 2017a) to
the intelligent separation of the pictures in foreground
and background parts (Jang and Park, 2016; Murthy
and Varaprasad, 2014).
An alternative way of detecting road damages is
the use of acoustic sensors (Mednis et al., 2010; Festa
et al., 2013). Thereby, it is monitored whether the
sound level (or acoustic pressure) close to the wheels
exceeds a given threshold. In the later case, it is con-
cluded that there must be a road damage in that loca-
tion.
Another wide-spread technique is the use of
smartphones as sensor platforms (Ghadge et al., 2015;
Mednis et al., 2011), which involves the advantages of
high sensor frequencies (partially > 300 Hz - see (Fox
et al., 2017)) and the availability of sensors for accel-
eration (in 3 axis) and positioning (GPS), as well as
computational power. These approaches mostly rely
on a threshold on vertical accelerations.
Methodically very close to those approaches are
(Chen et al., 2013; Jang et al., 2015; Eriksson et al.,
2008; Masino et al., 2017). As opposed to the afore-
mentioned works, these approaches use specific sen-
sor boxes as a data source.
Only few approaches use in-vehicle sensors. For
example, (Fox et al., 2017) presents a detection sys-
tem that tries to determine road bank and incline angle
in order to estimate accelerations expected in that lo-
cation. If the measured accelerations differ too much
from the expected ones, the location is labeled as pot-
hole. As the approach was tested with simulated data,
however, it is unclear whether the data can be ob-
tained in the needed quality when using real sensors.
In (Oppermann, 2011), a detection approach based
on a velocity-dependent wheel speed threshold is pre-
sented.
(Hsu et al., 2016) tries to construct a robust de-
tection system based on the use of multiple dif-
ferent sensors. The system consists of a three-
axis-accelerometer, a laser sensor and a 2D-camera.
The detection is accomplished similarly to other ap-
proaches for the individual sensors. The results are
then aggregated with a decision making system. It
could be shown that the combination of different sen-
sors improves detection rates significantly.
As opposed to most of the discussed works, the
idea behind our approach is to avoid the use of
specially sensor-equipped vehicles for collecting the
data. In contrast, we suggest to use standard in-
vehicle sensors, which are already available in a broad
range of today’s cars. From this approach we expect
that it will become possible to analyze road damages
on a big scale. The approach not only allows working
with single measurements, but with multiple measure-
ments at specific geo-locations. Through this crowd
of sensor data considerable advantages for the valida-
tion and localization quality can be achieved.
The only group of approaches, which also have
an adequate customer distribution are the ones based
on smartphone sensors. However, it is challenging
to get the needed data from smartphone users, since
their agreement is necessary to use the localization
via GPS, what most users avoid most of the time. Ac-
cording to a recent survey (Statista, 2015), only 48 %
of the smartphone users in Germany allow a position-
ing via GPS, whereas 50 % of the interviewees allow
it rarely or never. Thus, it is a better option to roll
the pothole alert system out based on the already ac-
cessible in-vehicle sensors. Thereby it is easier to get
users agreement as one is able to reward the users data
with a service which is directly generating use for the
driver. This means information consumption and con-
tribution should be bundled in one single application
to get as much users as possible, what is essential to
create a substantial benefit. In the case of a smart-
phone based system the direct use (information con-
sumption) is hardly achievable as one could also dis-
play alerts on the smartphones screen but as the driver
is not allowed to look at it while driving he would not
have a benefit from the alert. Hence the bundeling of
information consumption and contribution is not as
easy to implement as it is with in-vehicle techniques,
such as the multimedia system.
As most of the discussed approaches apply thresh-
old techniques, they have to be taken into account
in the design of our system. Essentially, only the
camera-based approaches propose a fundamentally
differing approach. In our opinion, these approaches
VEHITS 2019 - 5th International Conference on Vehicle Technology and Intelligent Transport Systems
34
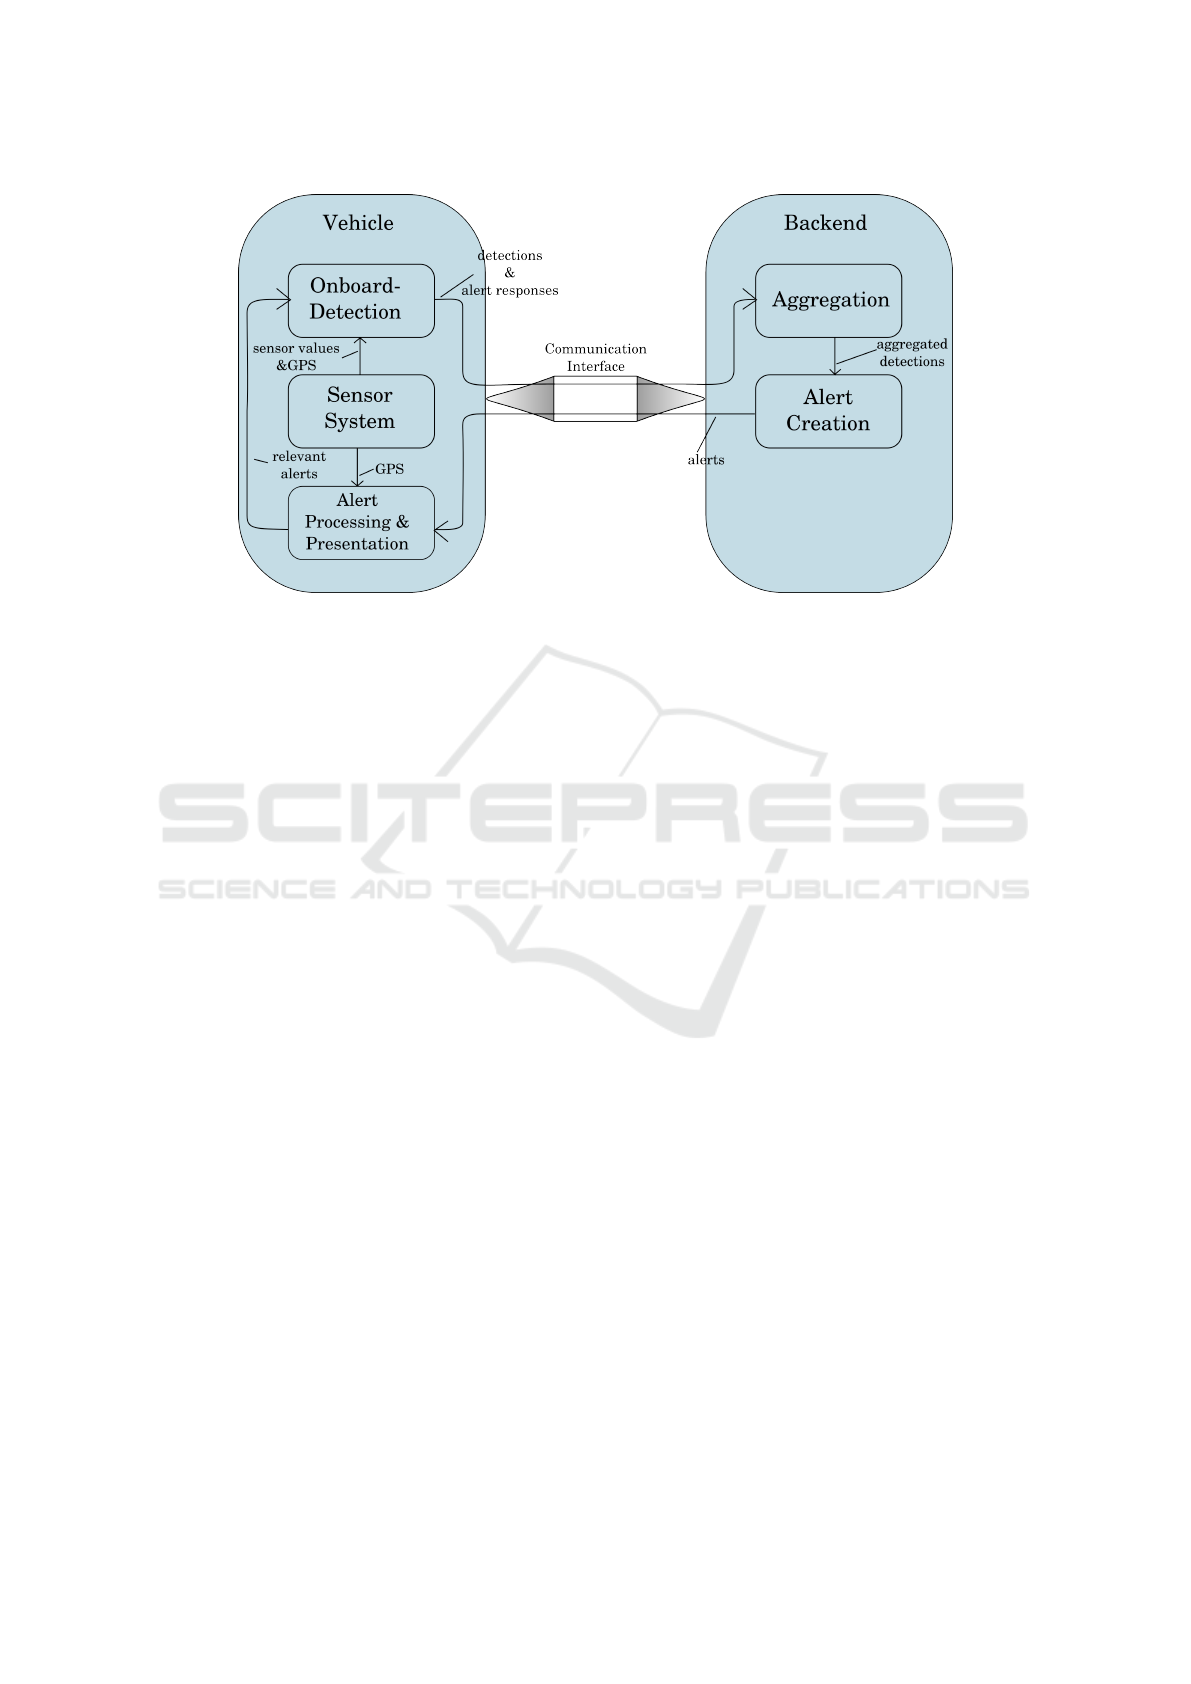
Figure 1: Introduced pothole detection approach in connection with the communication interface.
are also inadequate, due to the fact that cameras that
focus the road surface rarely occur in series vehicles.
3 CROWD-BASED POTHOLE
DETECTION
The purpose of the detection system to be designed
is its use in a crowd-based road damage alert sys-
tem. As can be seen in Figure 1, the system con-
sists of a sensor-based detection component in each
of the vehicles, a centralized back-end and a commu-
nication interface between them. Whenever an indi-
vidual vehicle detects a road damage, its parameters
are transmitted to the back-end, where, in turn, single
detections are aggregated. The term single detection
thereby means a detection, that was constituted based
on one drive by a single car.
That is an important step, as the sensor data and
thereby the detections of each single vehicle, are sub-
jected to uncertainty. For example, uncertainties are
introduced by sensor noise intrusions, vehicles just
passing by potholes or only touching their borders, or
insufficient sensor frequencies. Poor frequencies may
produce a unfavorable sampling between the peaks
one is interested in.
Obviously due to the huge number of sensor-
equipped vehicles these effects can be reduced
through aggregating the detections of the individual
vehicles. Therefore each individual vehicle of the
crowd contributes to a more exact and more up-to-
date view of the world. Based on these aggregated
detections, alerts will be created in the back-end and
transmitted to all concerned vehicles. Whether the
alert is relevant for a specific vehicle has to be de-
cided individually, depending on the geo-location. If
necessary, the vehicles can then notify the driver.
The techniques for the detection (cf. Section 3.1),
validation (cf. Section 3.2) and criticality assessment
(cf. Section 3.3) of road damages, which need to be
provided for each individual vehicle, are designed in
the following. Moreover, methods enabling the ag-
gregation through spatial clustering (cf. Section 3.4)
in the back-end have to be specified. Actually, the
communication interface also needs to be developed,
but this component is out of the scope of this paper.
Instead, this work tries to initially evaluate the general
feasibility of the described system and, thus, focuses
on the detection and aggregation tasks. Apart from
this such communication techniques are already avail-
able in series vehicles (see (Mercedes-Benz, 2018)).
3.1 Onboard Detection Algorithm
The algorithm for the in-vehicle detection of potholes
and road damages is the centerpiece of the entire sys-
tem. To properly design the system, three differ-
ent algorithms were implemented and evaluated thor-
oughly. Thereby, only such information should be
used as detection features that originate from stan-
dard in-vehicle sensors. Therefore, the implemented
algorithms mainly use the outputs of the wheel speed
and spring deflection sensors of all four wheels and
their derivatives as detection features. As the wheel
speed indicates how much turns the wheel performs
per time, the spring deflection sensor measures the
deflection of the spring between chasis and wheel.
That corresponds to the distance between the chas-
sis and the road surface and is therefore also called
CPD: Crowd-based Pothole Detection
35
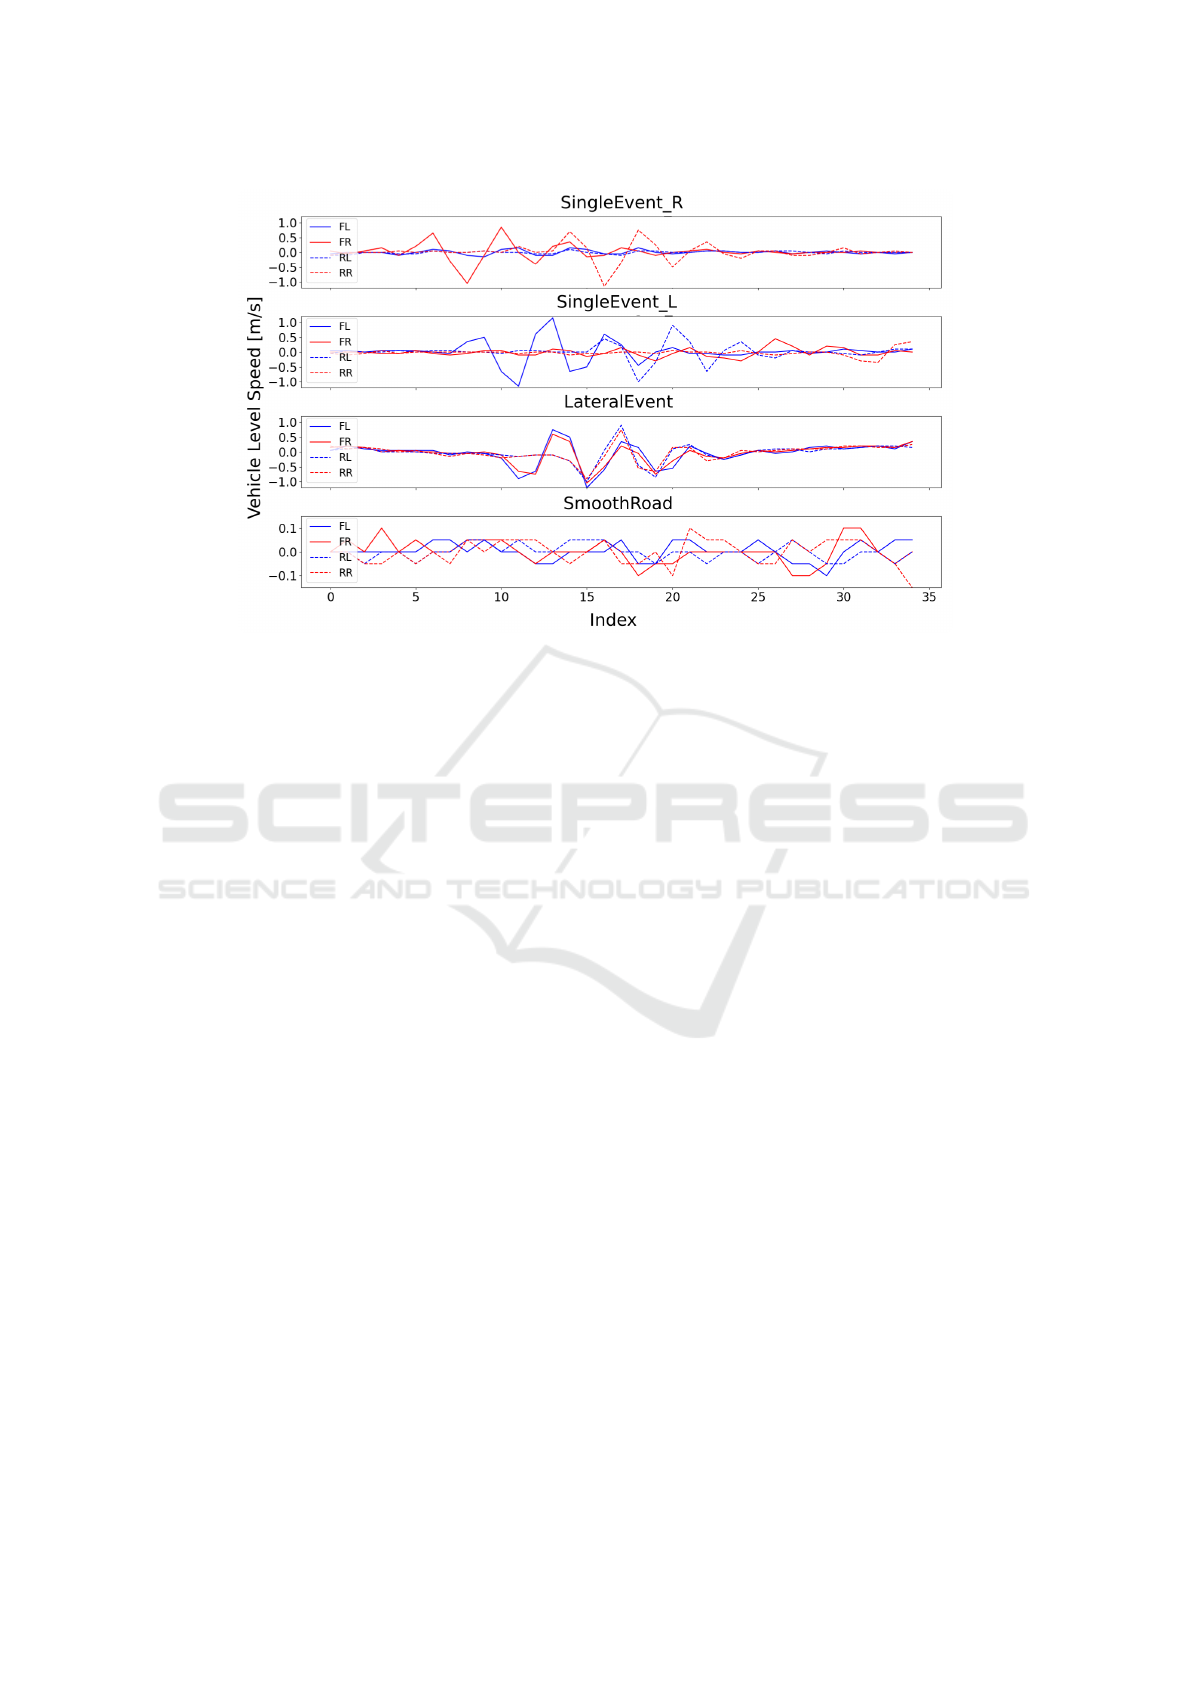
Figure 2: Examples for sensor readings of all four wheels (FL: front left; FR: front right; RL: rear left; RR: rear right;) in case
of the three different road event types and for the case of a smooth road with no occuring events. Note that the index runs
across 35 sequent measurements and that the scale of the y-axis in the smooth road example differs from the others.
vehicle level. Note that the acceleration in horizontal
direction, most approaches in literature rely on, are
not available at the necessary frequency over a broad
range of vehicle models. Only the accelerations in
lateral and longitudinal directions are available.
Furthermore our detection algorithms distin-
guishes between three road event types to ease the
later aggregation task. The three types are lateral, left-
sided and right-sided road damages. Theoretically
one could also differentiate between bumps and holes,
but for the used features the sensor reading sequences
are nearly the same for both of them. In addition to
that for alerting the information is not important.
However, Figure 2 exemplarily shows values of
the derivations of the vehicle levels (subsequently de-
noted as vehicle level speeds) for the three different
types and gives a smooth road example. The deriva-
tives of the wheel speeds (subsequently denoted as
wheel accelerations) would look very similar and will
be skipped at this point. Note that the index on the
x-axis runs across 35 sequent measurements, with a
sensor frequency of 50 Hz. Additionally it has to be
remarked that the scale of the y-axis in the smooth
road example differs from the others.
Moreover, it has to be noticed that our selected
sensor readings are not only affected by a pothole at
a single point of time, as horizontal accelerations. In
contrast, a pothole gets the whole vehicle body to os-
cillation, what can be observed in our features for a
few seconds (cf. Figure 2). This is crucial as most of
the in-vehicle sensors sample only with a frequency of
50 Hz. For high velocities this leads to a rough sam-
pling in the location range. For example when driving
with a velocity of 70 km/h the distance between sub-
sequent measures constitutes approximately 0.4 m.
Therefore it is very likely to miss potholes when only
regarding single points of time. In contrast to that, our
features make it less probable to miss potholes. In ad-
dition to that the work with the sensor readings of all
four wheels makes a validation by reasoning about the
spatio-temporal relation between the individual sen-
sor values possible (cf. Section 3.2). These relations
can also be observed in Figure 2. Therein it becomes
obvious, that the highest peaks for the wheel speeds at
the back wheels follow them at the front wheels with
a certain time gap, as expected.
3.1.1 Algorithm 1: Velocity-Dependent
Thresholding
The first implemented detection algorithm has been
adopted from (Oppermann, 2011). The detection
works as follows: First, the data set is limited to ve-
locities below 60 km/h as the approach is velocity-
dependent and would not work properly with the same
parameter set across that border. Second for each data
point and each wheel, it is checked whether the wheel
acceleration exceeds a velocity-dependent threshold.
Thereby the parametrization of the threshold was cho-
sen as proposed in (Oppermann, 2011). In the case of
a threshold exceedance the associated measurement is
treated as detection candidate and further processed
VEHITS 2019 - 5th International Conference on Vehicle Technology and Intelligent Transport Systems
36

in the validation step (cf. Section 3.2). This step, is
for example, necessary to suppress implausible detec-
tions or multiple detections of the same road event.
To distinguish between the different road event types,
it is subsequently evaluated whether thresholds were
exceeded just at one side or at both sides of the vehi-
cle.
3.1.2 Algorithm 2: Improved
Velocity-Independent Thresholding
The second algorithm implemented improves the first
variant according to the proposed method in (Eriks-
son et al., 2008). As opposed to (Eriksson et al.,
2008) the detection features are no horizontal accel-
erations in our adapted version. Instead the wheel
accelerations and vehicle level speeds are used as in
Algorithm 1. On that basis, all measurements with a
wheel acceleration or vehicle level speed being within
a lower and an upper bound are selected. Thereby,
the lower bounds purpose is to detect potential pot-
holes, the upper bounds are for the suppression of im-
plausible changes in the sensor readings. The con-
crete parametrization of the thresholds was achieved
by analyzing the histograms over the particular vari-
able. Through the use of two independent sensors for
all four wheels as data source, considerable improve-
ments of the detection rates can be expected (accord-
ing to(Hsu et al., 2016)). As opposed to the first de-
tection algorithm, no data sets with high velocities
need to be skipped, since the used threshold is not
velocity-dependent and, therefore, works for all vehi-
cle speeds. The validation and differentiation between
the road event types is then executed like in the first
algorithm (cf. Algorithm 1).
3.1.3 Algorithm 3: Template Matching
As an alternative to the two other detection algorithms
a Template Matching strategy, similar to the one in
(Niennattrakul et al., 2012), is proposed. In (Nien-
nattrakul et al., 2012) the algorithm was not used to
detect potholes, but with few adaptations it becomes
possible to employ it for this task.
The essential algorithm works as follows: For ev-
ery road event type and for each sensor, a template
has to be created in advance. In this paper, we restrict
ourselves to use a meaningful example for each road
event type as template. Then, in the application phase,
the sequence of currently observed sensor readings
are compared with the created templates using a dis-
tance measure.
For this purpose we use the Dynamic Time Warp-
ing (DTW) distance. As introduced in (M
¨
uller, 2007,
p. 69 ff.), the DTW distance is a distance measure
that enables a comparison of two time-dependent se-
quences by trying to find an optimal alignment be-
tween the two sequences i.e., one tries to correlate
the sequences as best as possible by compressing
or stretching the values over time (see Figure 3).
The less adaptations are required in this context, the
smaller the calculated distance value will be.
Figure 3: Visualization of the DTW alignment (originally
published on Wikimedia - see (Cross, 2018)).
Taking these considerations into account the cur-
rent sequence will be assigned to that road event type,
which has the lowest distance value between sensor
reading and template. As opposed to (Niennattrakul
et al., 2012) our approach enables to access several
sensor channels at the same time. Consequently, our
implementation of the Template Matching algorithm
goes beyond (Niennattrakul et al., 2012), summing up
the differences of the individual sensors. In the case
of different sensors of the same type, this procedure
is valid. However, for sensors that measure different
variables this would lead to an undesired behavior as
the difference values to be summed up might be in dif-
ferent ranges. There are two options to prevent this:
either to normalize the difference values to the same
range of values or to solely use the values of equal
sensors. For the sake of simplicity, we select the sec-
ond option and only use the four vehicle level speeds
in this algorithm.
To reduce computation times for comparing the
templates and sensor readings, our algorithm per-
forms the comparison in a sliding window manner.
Thereby, overlapping windows are preferred to pre-
vent the system from missing detections. This way of
data processing will produce a most likely road event
type for each window. In turn, this requires creating
an additional template for the case of a smooth road
(cf. Figure 2).
The thereby generated detections are subsequently
processed further in the criticality assessment step.
CPD: Crowd-based Pothole Detection
37

3.2 Validation Step
As the threshold detection algorithms produced many
false positive detections, a validation component is
needed that discovers and oppresses implausible de-
tections. In addition to that, there might be faulty sen-
sor readings, which should also not trigger any de-
tection. This behavior can be achieved by examining
those sensor readings not exceeding the given thresh-
old. For example, if the value of the vehicle level at
the wheel on the front right side exceeds the thresh-
old, it should be checked whether the vehicle level at
the wheel on the back right side also changes signifi-
cantly (but below the threshold) when it arrives at the
specific location.
As the Template Matching algorithm itself oper-
ates on the values for all wheels, and therefore incor-
porates an implicit validation, no further validation is
required.
Another task to be accomplished in this context
is to suppress double or multiple detections of the
same road event. For example, in succeeding mea-
surements a threshold might be exceeded, resulting in
two (or even more) nearby detections. To obtain only
one of these detections and preferably the most dan-
gerous one, only the detection with the largest abso-
lute value within a specified time window is processed
further.
This step can be skipped for the Template Match-
ing algorithm, since it is applied in a sliding window
manner which already performs the described win-
dowing, as well.
3.3 Criticality Assessment
The next step, following the validation of the detec-
tions, is the criticality assessment. The later is re-
quired as not every detectable pothole is as danger-
ous that one would like to warn the driver. A na
¨
ıve
approach would be to measure the depth or height of
the pothole or bump. As that is only one out of many
aspects the severity of a pothole depends on (others
are, for example, shape or position on the track), it
would not be adequate as criticality measure. More-
over, it is also not simply feasible to assess the height
based on the available sensors. A criterion incorpo-
rating all external impacts is in our opinion the jerk,
which measures exactly what the passengers inside a
car experience. To be more precise, the jerk is defined
as the derivation of the acceleration and also consti-
tutes a widespread optimization criterion for smooth
and comfortable trajectories (see (Ziegler, 2015)). As
already mentioned, in our case the chassis accelera-
tion is only available in longitudinal (X) and lateral
(Y) direction. Thus the jerk is also only accessible
in these directions. As the impact a pothole performs
on the vehicle is anyway subsequently expressed by
these two dimensions, this is not a problem at this
point.
Please note that although we consider the jerk to
be the paramter describing an already identified pot-
hole best possible, the jerk is not a good feature to
detect them in a first step. The reason therefor is that
also other causes than potholes such as accelerating
or braking maneuvers or gear shifts can have similar
effects on the jerk values what would confuse a jerk
based pothole detection system.
To calculate the resulting jerk, the independent
values for the two directions are added via vector ad-
dition according to Equation 1.
Jerk
XY
=
q
Jerk
2
X
+ Jerk
2
Y
(1)
The criticality is then calculated as maximum
value of all resulting jerks within a window of a few
seconds (marked as vector) before and after the time
of the detection according to Equation 2.
Crit = max(
−−−−→
Jerk
XY
) (2)
Afterwards the remaining and assessed single de-
tections can be summarized in the aggregation step.
3.4 Aggregation
The aggregation of the single detections comprises
two subtasks: Spatial Clustering and Aggregation
of Attribute Values.
3.4.1 Spatial Clustering
The clustering of the single detections is achieved
with the DB-SCAN algorithm (Ester et al., 1996),
which is based on a distance matrix. The later ma-
trix is calculated with the help of the Vincenty Dis-
tance (Vincenty, 1975), which constitutes a measure
for the distance (in meters) between two arbitrary geo-
locations. We enhanced the distance matrix in order
to not only incorporate spatial distance, but also the
driving direction and road event type. In addition, we
parametrized the DB-SCAN to ensure the construc-
tion of clusters containing at least a minimal num-
ber of single detections. In summary, the single de-
tections are validated over all detections at that geo-
location.
VEHITS 2019 - 5th International Conference on Vehicle Technology and Intelligent Transport Systems
38
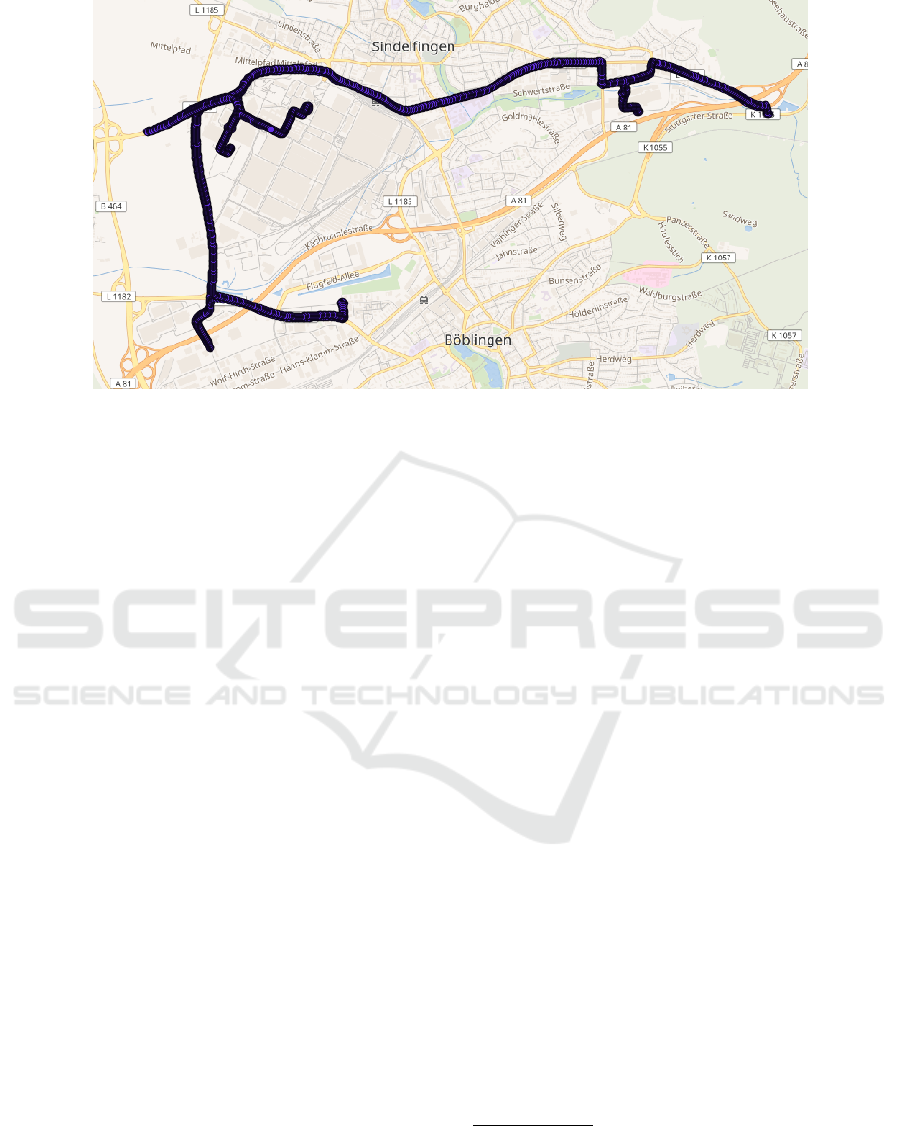
Figure 4: Selected test track in and around Sindelfingen (map data according to Wikimedia Maps - see (Wikimedia Maps,
2018)).
3.4.2 Aggregation of Attribute Values
Aggregating the attribute values in each cluster com-
prises two steps. First, the geo-coordinates of each
cluster have to be estimated based on the geo-
coordinates of the single detections. For this purpose,
the averaging of geo-locations of all detections be-
longing to the specific cluster is calculated. In addi-
tion to that, it becomes necessary to specify the crit-
icality of the clusters. As different approaches were
considered, it became clear that the use of a quan-
tile (here the 0.8-quantile) was favorable. In particu-
lar, one can ensure that a pothole, which was classi-
fied as potentially dangerous for at least a few cases
is classified as dangerous in the aggregated criticality
assessment as well. Moreover, the quantile is consid-
erably more robust according to noise than the maxi-
mum value.
4 EVALUATION
The following Section deals with the evaluation of the
designed and implemented algorithms. Section 4.1
focuses on the generation of the ground truth and
Section 4.2 introduces the considered data set. Both
are used for evaluating the implemented algorithms.
Section 4.3 presents the metrics, we used to system-
atically evaluate the three alternative detection algo-
rithms. Finally, Section 4.4 summarizes and discusses
the evaluation results.
4.1 Ground Truth
For generating the ground truth, a 24 km long test
track in and around Sindelfingen (Germany) was se-
lected. Regarding this track most of the testing fleet’s
data (cf. Section 4.2) as well as an appropriate num-
ber of road damages
1
exists (cf. Figure 4). In par-
ticular, for several parts of the selected track there
are more than 1 000 independent measurements in the
evaluation data. In several test drives on this track we
then annotated all detectable road damages manually
on a map.
4.2 Data Set
For testing and evaluating the three algorithms, we
use a large database with measurements collected by a
fleet of testing vehicles. More precisely, this database
comprises measurements of different vehicles, vehi-
cle models, drivers and seasons. Each of the vehi-
cles is thereby equipped with a data logger, which is
able to record the internal bus communication
2
. Al-
though the driven routes were not restricted most of
the time the vehicles stayed in the region where the
testing fleet is located. Therefore a large amount of
vehicle crossings at the same routes is on hand, what
makes it possible to reason about the performance of
the detection system and the aftwerwards applied ag-
1
The rather low absolute number of investigated road
damages in the evaluation stems from the fact, that road
damages occur much less than is commonly thought.
2
As the data set could be used to reverse-engineer the
communication system, it is unfortunately not possible to
make it publicly available.
CPD: Crowd-based Pothole Detection
39
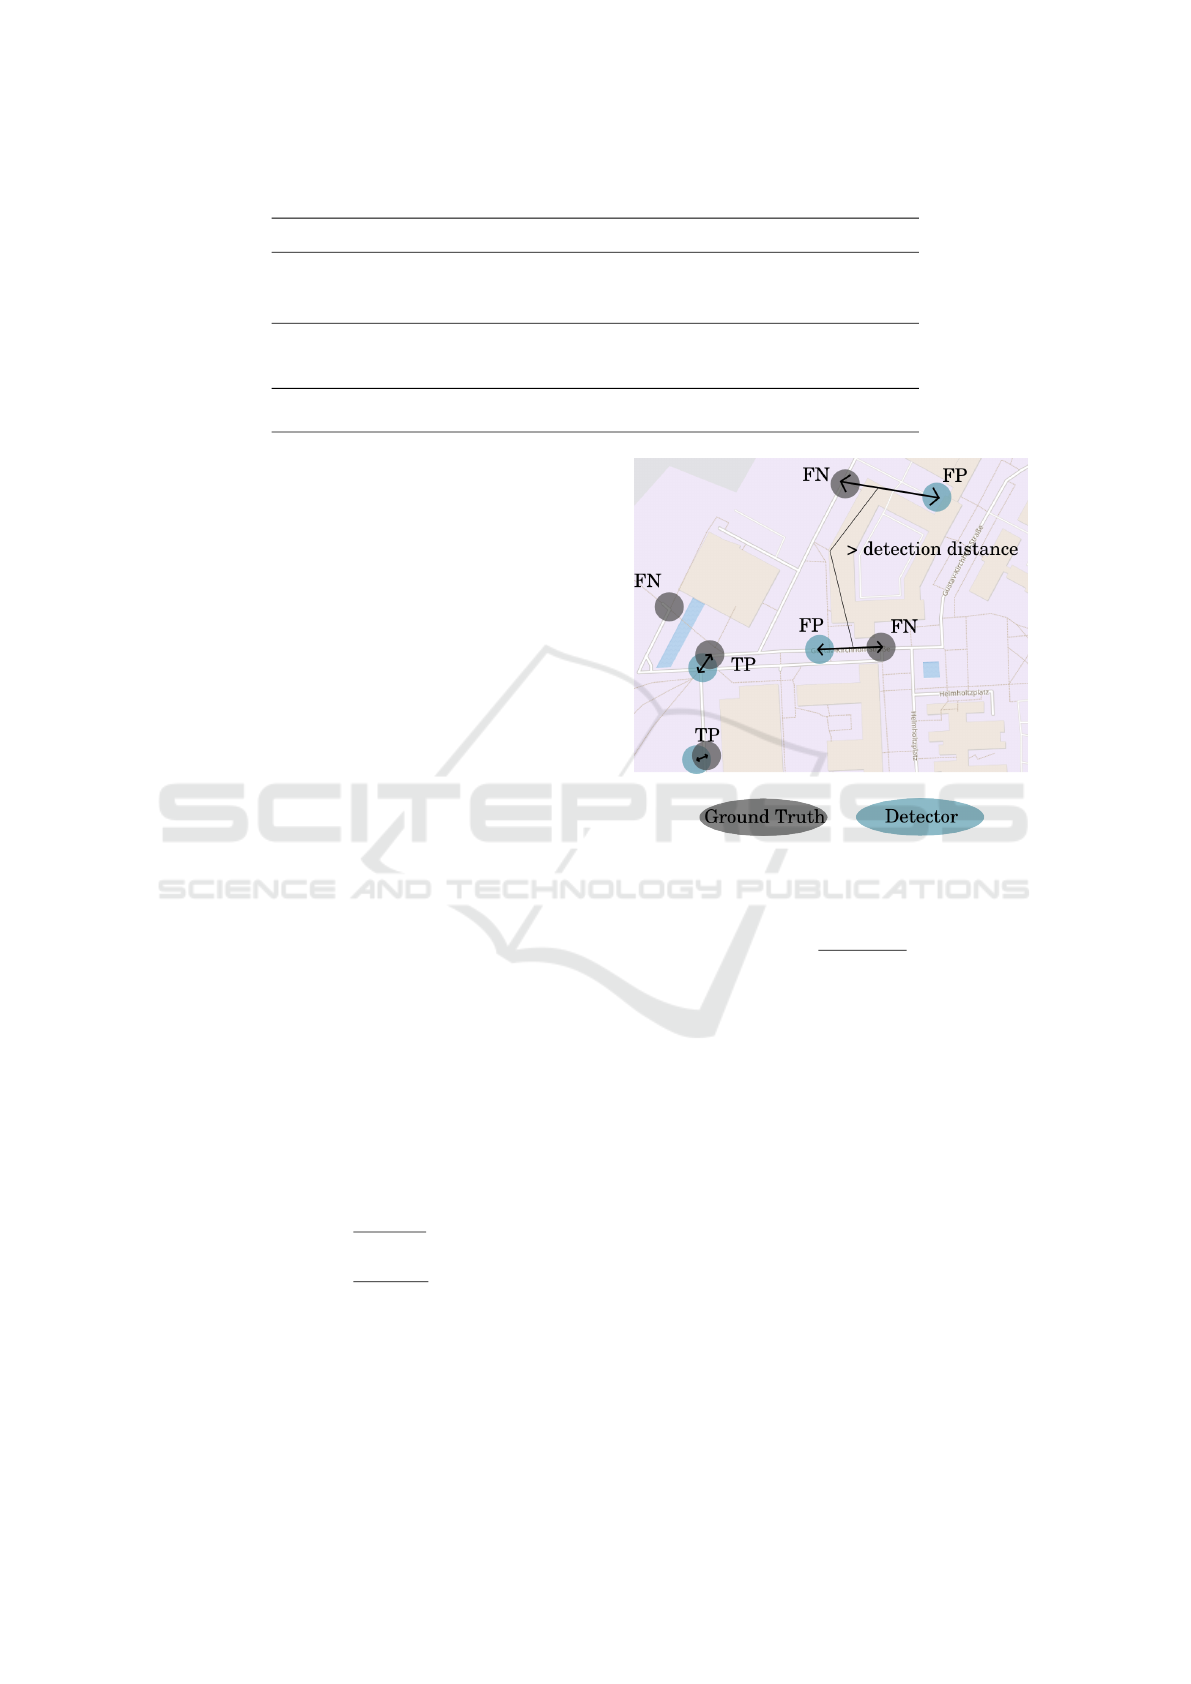
Table 1: Evaluation results of the implemented detection algorithms.
Algorithm FP TP FN Precision Recall F
1
-Score
Algorithm 1:
Velocity-Dependent 0 20 34 1.00 0.15 0.26
Thresholding
Algorithm 2:
Improved Velocity- 14 36 18 0.72 0.67 0.69
Independent Thresholding
Algorithm 3:
7 37 17 0.84 0.69 0.76
Template Matching
gregation. The data we selected from the overall data
pool approximately covers 450 000 road kilometers.
As aforementioned, for these real-world data it must
be taken into account that sensor readings might be
erroneous due to sensor noise or other random fail-
ures.
4.3 Metrics
We employed all three detection algorithms combined
with the subsequent processes (3.2 - 3.4) to the de-
scribed test data set and compared the results with the
constructed ground truth, resulting in quantities for
true positives (TP), false positives (FP) and false neg-
atives (FN). As can be seen from Figure 5, a FP oc-
cures, if no truly existing road damage event lies in a
defined detection distance around a detection induced
by one of the algorithms. Regarding a FN, in turn, it
is the same the other way around. In contrast to that a
TP exists if a detection can be found close to a really
existing road damage event in the ground truth.
Additionally it would have been possible to de-
termine true negatives (TN). As in our view the real-
world is continous and not divided into grid cells,
which can be labeled as road damage or not, there
would theoretically exist a infinite number of TN’s.
Hence we decided to not rely on TN’s for the evalua-
tion of our algorithms.
Numerical values for Precision and Recall, which
are widespread metrics for assessing detectors, can be
determined according to Equations 3 and 4 (see (Mur-
phy, 2012, p. 181 ff.)).
Prec =
T P
T P + FP
(3)
Rec =
T P
T P + FN
(4)
To unify these two metrics to one single value,
which makes it possible to easily compare the algo-
rithms with each other, the F
1
-Score is used (cf. Equa-
tion 5). It can be interpreted as the harmonic mean
between Precision and Recall (see (Murphy, 2012, p.
181 ff.)).
Figure 5: Exemplary illustration of TP, FP and FN on a map
(map data according to Wikimedia Maps (see (Wikimedia
Maps, 2018)).
F
1
= 2 ·
Prec · Rec
Prec + Rec
(5)
4.4 Results
As can be seen in Table 1, the Template Matching al-
gorithm delivers the best results, with respect to the
detection quality when applied in our system. Ad-
ditionally, it provides the best algorithm concerning
detection occurence, which can be observed in indi-
vidual cases. For example, there are parts of the test
track with more than 1 000 collected measurements,
where the two threshold algorithms could only de-
tect a road damage in a few of them. By contrast,
the Template Matching algorithm could detect one in
more than 100 cases, which is already much better.
For the later application in the road damage alert sys-
tem this means that a damage in the road surface will
be detected much earlier and, therefore, following ve-
hicles can be alerted earlier. Note that the fact that
detections cannot be made in all measurements is not
surprising as it often happens that a vehicle passes a
pothole without driving straight through it or by just
VEHITS 2019 - 5th International Conference on Vehicle Technology and Intelligent Transport Systems
40

touching its borders. As another positive aspect of the
Template Matching algorithm, it needs no additional
validation component, but verifies detections implic-
itly (cf. Section 3.2). Moreover it is not necessary to
determine thresholds, as templates can easily be gen-
erated from examples. Thus, this algorithm is easier
to implement and understand.
5 CONCLUSIONS AND
OUTLOOK
This work provides a first feasibility study regarding a
crowd based road damage alert system. Thereby, we
showed that Template Matching strategies are more
favorable than the widely used threshold algorithms.
As a next step, the in-vehicle components of the
system have to be adapted to vehicle-specific con-
straints. This requires to transfer the approach on a
suitable control unit while optimizing it to consume
a minimum of computational power and memory. In
principle, the system should nearly run in real-time.
Afterwards the system can go live and bring real cus-
tomers an added value.
In addition we work on further improving the de-
tection rates. We conducted therefore first promis-
ing experiments with the MD-DTW distance (see (ten
Holt et al., 2007)) as an alternative to the used DTW
distance. The MD-DTW allows computing the dis-
tance of several sensor channels synchronously. This
way, a more exact distance measure compared to ag-
gregation of the DTW distances can be achieved, re-
sulting in improved detection results. Of course at the
cost of a higher computational complexity.
REFERENCES
Chen, K., Lu, M., Tan, G., and Wu, J. (2013). CRSM:
Crowdsourcing based road surface monitoring. In
Proceedings of the 2013 IEEE International Confer-
ence on High Performance Computing and Communi-
cations (HPCC) & Proceedings of the 2013 IEEE In-
ternational Conference on Embedded and Ubiquitous
Computing (EUC). pp. 2151–2158.
Cross, X. (2018). Diffference in matching between
euclidean and dynamic time warping. Web
Content: https://commons.wikimedia.org/wiki/File:
Euclidean vs DTW.jpg. (accessed 03-01-2018).
Eisenbach, M., Stricker, R., Debes, K., and Gross, H.-
M. (2017a). Crack Detection with an Interactive
and Adaptive Video Inspection System. In Abschrift
Arbeitsgruppentagung Infrastrukturmanagement. pp.
94–103.
Eisenbach, M., Stricker, R., Seichter, D., Amende, K.,
Debes, K., Sesselmann, M., Ebersbach, D., Stoeck-
ert, U., and Gross, H.-M. (2017b). How to get pave-
ment distress detection ready for deep learning? A
systematic approach. In Proceedings of the 2017 IEEE
International Joint Conference on Neural Networks
(IJCNN). pp. 2039–2047.
Eriksson, J., Girod, L., Hull, B., Newton, R., Madden, S.,
and Balakrishnan, H. (2008). The pothole patrol: Us-
ing a mobile sensor network for road surface monitor-
ing. In Proceedings of the 2008 International Confer-
ence on Mobile Systems, Applications, and Services
(MobiSys). pp. 29–39.
Ester, M., Kriegel, H.-P., Sander, J., and Xu, X. (1996).
A density-based algorithm for discovering clusters in
large spatial databases with noise. In Proceedings of
the 2nd International Conference on Knowledge Dis-
covery and Data Mining (KDD). vol. 96, no. 34, pp.
226–231.
Festa, D. C., Mongelli, D. W. E., Astarita, V., and Giorgi,
P. (2013). First results of a new methodology for
the identification of road surface anomalies. In Pro-
ceedings of the 2013 IEEE International Conference
on Service Operations and Logistics, and Informatics
(SOLI). pp. 192–197.
Fox, A., Kumar, B. V. K. V., Chen, J., and Bai, F. (2017).
Multi-lane pothole detection from crowdsourced un-
dersampled vehicle sensor data. IEEE Transactions on
Mobile Computing (TMC). vol. 16, no. 12, pp. 3417–
3430.
Ghadge, M., Pandey, D., and Kalbande, D. (2015). Machine
learning approach for predicting bumps on road. In
Proceedings of the 2015 International Conference on
Applied and Theoretical Computing and Communica-
tion Technology (iCATccT). pp. 481-485.
Hsu, Y.-W., Perng, J. W., and Wu, Z. H. (2016). Design and
implementation of an intelligent road detection system
with multisensor integration. In Proceedings of the
2016 International Conference on Machine Learning
and Cybernetics (ICMLC). vol. 1, pp. 219–225.
Jang, D.-W. and Park, R.-H. (2016). Pothole detection us-
ing spatio-temporal saliency. IET Intelligent Trans-
port Systems (ITS). vol. 10, no. 9, pp. 605–612.
Jang, J., Smyth, A. W., Yang, Y., and Cavalcanti, D.
(2015). Road surface condition monitoring via mul-
tiple sensor-equipped vehicles. In Proceedings of the
2015 IEEE Conference on Computer Communications
Workshops (INFOCOM). pp. 43-44.
Masino, J., Levasseur, G., Frey, M., Gauterin, F., Mikut,
R., and Reischl, M. (2017). Charakterisierung
der Fahrbahnbeschaffenheit durch Data Mining von
gemessenen kinematischen Fahrzeuggr
¨
oßen. at-
Automatisierungstechnik. vol. 65, no. 12, pp. 867–
877.
Mednis, A., Strazdins, G., Liepins, M., Gordjusins, A., and
Selavo, L. (2010). RoadMic: Road surface monitoring
using vehicular sensor networks with microphones. In
Proceedings of the second International Conference
on Networked Digital Technologies (NDT). Springer.
vol. 2, pp. 417–429.
CPD: Crowd-based Pothole Detection
41

Mednis, A., Strazdins, G., Zviedris, R., Kanonirs, G., and
Selavo, L. (2011). Real time pothole detection us-
ing android smartphones with accelerometers. In Pro-
ceedings of the 2011 International Conference on Dis-
tributed Computing in Sensor Systems and Workshops
(DCOSS). pp. 1–6.
Mercedes-Benz (2018). Car-to-x communication. Web
Content: https://www.mercedes-benz.com/en/
mercedes-benz/innovation/car-to-x-communication/.
(accessed 02-28-2018).
Mikhailiuk, A. and Dahnoun, N. (2016). Real-time pothole
detection on TMS320c6678 DSP. In Proceedings of
the 2016 IEEE International Conference on Imaging
Systems and Techniques (IST). pp. 123–128.
M
¨
uller, M. (2007). Information retrieval for music and mo-
tion. Springer. vol. 2.
Murphy, K. P. (2012). Machine learning: a probabilistic
perspective. MIT press.
Murthy, S. B. S. and Varaprasad, G. (2014). Detection
of potholes in autonomous vehicle. IET Intelligent
Transport Systems (ITS). vol. 8, no. 6, pp. 543–549.
Niennattrakul, V., Srisai, D., and Ratanamahatana, C. A.
(2012). Shape-based template matching for time se-
ries data. Knowledge-Based Systems (KNOSYS), 26.
pp. 1–8.
Oppermann, F. (2011). Entwicklung eines Offline-
Algorithmus zur Erkennung von Hinder-
nis
¨
uberfahrten aus Fahrbahnunebenheitsprofilen
anhand des Radfederweges. Diploma Thesis,
Technische Universit
¨
at Braunschweig.
Seichter, D., Eisenbach, M., Stricker, R., and Gross, H.-M.
(2018). How to improve deep learning based pave-
ment distress detection while minimizing human ef-
fort. In Proceedings of the 2017 IEEE International
Conference on Automation Science and Engineering
(CASE). pp. 63–70.
Statista (2015). Wie h
¨
aufig lassen sie eine (GPS-
) Ortung zu? Web Content: https://sta.cir-
mcs.e.corpintra.net/statistik/daten/studie/455346/
umfrage/nutzungshaeufigkeit-der-ortungsfunktion-
gps-durch-smartphone-besitzer/.
ten Holt, G. A., Reinders, M. J., and Hendriks, E. (2007).
Multi-dimensional dynamic time warping for gesture
recognition. In Proceedings of the thirteenth annual
conference of the Advanced School for Computing and
Imaging. vol. 300, pp. 23–32.
Vincenty, T. (1975). Direct and inverse solutions of
geodesics on the ellipsoid with application of nested
equations. Survey review. vol. 23, no. 176, pp. 88–93.
Wikimedia Maps (2018). Web Content: https://maps.
wikimedia.org/. (accessed 02-26-2018).
Ziegler, J. (2015). Optimale Bahn- und Trajektorienplanung
f
¨
ur Automobile. PhD Thesis, Karlsruhe Institute of
Technology (KIT).
VEHITS 2019 - 5th International Conference on Vehicle Technology and Intelligent Transport Systems
42
