
Skill Confidence Ratings in a MOOC: Examining the Link between Skill
Confidence and Learner Development
Karen von Schmieden, Thomas Staubitz, Lena Mayer and Christoph Meinel
Hasso Plattner Institute, University of Potsdam, Prof.-Dr.-Helmert-Strasse 2-3, 14482 Potsdam, Germany
Keywords: Online Learning, MOOC, Learner Skill Confidence, Learner Development.
Abstract:
This paper explores the development of perceived learner skill confidence in a programming MOOC by apply-
ing and analyzing a new Skill Confidence Rating (SCR) survey. After cleaning datasets, we analyze a sample
of n = 1689 for the first course module and n = 1147 for the second course module. Results show that on av-
erage, learners perceive their skills more confidently after taking a module. The initial confidence per module
differs. We could not find a correlation between perceived learner confidence and learner performance in this
course.
1 INTRODUCTION
Massive Open Online Courses (MOOCs) have great
potential for learners worldwide by offering unre-
stricted access to educational resources, both inside
and outside of higher education (Yuan and Powell,
2013). Unfortunately, course instructors often strug-
gle to create meaningful digital learning experiences
(Mackness et al., 2010; Haggard et al., 2013). With
massive numbers of learners attending, course in-
structors have little opportunity to gather informa-
tion about learner development, and how learners per-
ceive the development of their skills. We propose
the assessment of learner skill confidence to better
understand the development of learners in MOOCs,
and to consequently improve the effectiveness of dig-
ital learning experiences. To explain this endeavor,
we will first contextualize the terms of ”skill” and
”learner confidence” in literature to clarify the pur-
pose, development and testing of our Skill Confidence
Rating (SCR) survey. Next, we describe the experi-
mental setup and results of the SCR in a MOOC on
Java for beginners, which consisted of several mod-
ules. We set out to assess the link between per-
ceived skill confidence and learner development in
this MOOC.
1.1 Research Question
Can we draw conclusions about learner development
in a programming MOOC based on learners’ per-
ceived skill confidence? a) Is there a mean increase
in learner skill confidence between pre and post as-
sessment per module? b) Is there a shift in the initial
skill confidence (pre survey) from module 1 to mod-
ule 2? c) Did learners with a high skill confidence
gain from pre to post survey receive a high amount of
points during the course?
2 SKILL ACQUISITION
The term ’skill’ generally describes a proficiency
developed through training or experiences (Annett,
1989). Knowledge, in comparison, is regarded as
the theoretical or practical understanding of a sub-
ject. Stuart E. Dreyfus and Hubert L. Dreyfus de-
veloped a five-step model of skill acquisition by ex-
emplifying the learning process of language learn-
ers, chess players, and pilots (Dreyfus and Dreyfus,
1980) and later by describing driving lessons. In their
model, a student passes through the stages of ’novice,
advanced beginner, competence, proficiency, and ex-
pert’. An increase in proficiency is marked by a dis-
association from rigid adherence to rules and the de-
velopment of an intuitive reasoning (Dreyfus, 2004).
Decision-making thus becomes a tacit action. Al-
though students in a focused online course may only
pass through one of these defined phases for a skill,
an increase in skill proficiency is possible. With re-
gard to the temporal position of skill development
in training phases, we postulate that skill acquisition
takes place in the ”during training phase” as defined
by Salas et al. (Salas et al., 2012); while the ”after
von Schmieden, K., Staubitz, T., Mayer, L. and Meinel, C.
Skill Confidence Ratings in a MOOC: Examining the Link between Skill Confidence and Learner Development.
DOI: 10.5220/0007655405330540
In Proceedings of the 11th International Conference on Computer Supported Education (CSEDU 2019), pages 533-540
ISBN: 978-989-758-367-4
Copyright
c
2019 by SCITEPRESS – Science and Technology Publications, Lda. All rights reserved
533

training phase” marks learners’ skill transfer. In the
following, we refer to findings from a study by Bell
and Kozlowski (Bell and Kozlowski, 2010) to illus-
trate this point. They establish self-regulation systems
as a component affecting the junction between a train-
ing intervention and training outcomes. They outline
”practice behaviors”, ”self-monitoring”, and ”self-
evaluation reaction” as the paramount elements for
creating learner-centered training designs. ”Practice
behaviors” as a behavioral component refers to ”how
[learners] allocate effort [...] during practice aimed at
skill improvement” (p. 267). ”Self-monitoring” as a
cognitive component refers to ”how [learners] focus
their cognitive attention and reflect on their progress
toward desired objectives” (p. 267). ”Self-evaluation
reaction” as an affective component refers to learn-
ers’ ”affective reactions to goal progress”, e.g., self-
efficacy (p. 267, see also (Salas et al., 2012).
3 LEARNER CONFIDENCE
In this research, we are interested in learners’ confi-
dence regarding their skill acquisition. Albert Ban-
dura explored the concept of learner confidence by
coining the term self-efficacy. In the context of learn-
ing, self-efficacy describes the learner’s belief that
their abilities and knowledge are sufficient to suc-
ceed at a task (Bandura, 1986). Learner confidence
is thus not a fixed state. Scholars generally describe
it as situation-specific, meaning that it can be influ-
enced by internal and external factors (Moller, 1993).
While Bandura deems ”confidence” a colloquial term
to approach self-efficacy, he did use the word in his
surveys to make survey items understandable to par-
ticipants. Other scholars, such as John Keller, apply
the term of learner confidence throughout their work.
According to Keller (Keller, 1987), confidence is the
interplay between learners’ desire for or expectancy
of success, and their fear of failure. Keller and Suzuki
summarize the learner confidence term by building on
Weiner’s attribution theory (Weiner, 1974). They ar-
gue that learners need to ”attribute their successes to
their own abilities and efforts rather than to luck or
the task being too easy or difficult” (2014, p. 231).
Keller and Suzuki’s confidence concept (and corre-
sponding course design recommendations within their
learner motivation model) has been applied and vali-
dated in online learning (Keller and Suzuki, 2004).
For this paper, we are exploring the concepts of skill
(acquisition) and Keller’s and Bandura’s concepts of
learner confidence by examining the development of
learner confidence of specific skills. In the con-
text of (online) learning and Massive Open Online
Courses, Bandura’s scale of perceived self-efficacy is
often used to measure the extent ”to which an individ-
ual learner feels confident in their ability to engage
with and complete learning activities” (Hood et al.,
2015). It is furthermore often used in the context of
self-regulated learning (Bandura, 2006; Usher and Pa-
jares, 2008). In assessing learner skill confidence, we
deviate from Bandura’s self-efficacy scale for two rea-
sons: Firstly, we focus on learner’s confidence with
specific skills, and not the entirety of efficacy with
the course’s learning activities. Secondly, we are in-
terested to see how this confidence develops through-
out learning units and the whole course, and if this
development allows us to draw conclusion for course
design and learner support.
3.1 SCR Survey Development
We developed, piloted and tested the Skill Confi-
dence Rating survey for a skill-based Design Think-
ing
1
MOOC prototype. This course ran as a proto-
type in a closed setting on the German MOOC plat-
form openHPI in November 2016 (Taheri et al., 2018)
MOOC prototype. Findings from the course indicated
the usefulness of the SCR, reinforcing us to conduct
the survey with a larger MOOC audience. We opted
for adapting the SCR in a course on object-oriented
Programming in Java. Similar to the Design Thinking
course, this course has a focus on learning skills and
competences rather than on teaching knowledge. The
conveyed programming skills are tied closely to cod-
ing exercises and assignments. This allowed us to put
a focus on learner development.
4 METHODS
4.1 Testing Environment
The SCR surveys were an integral part of the MOOC
on Object-Oriented Programming in Java, which also
ran on the openHPI. Next to an introduction to the
Java programming language and syntax and some ba-
sic programming constructs, the scope of the course
focused on object-oriented techniques and concepts,
such as inheritance and polymorphism. Furthermore,
it included an excursus on object-oriented modeling,
in which the participants were asked to work in teams
1
Design thinking is a user-centered approach for prob-
lem solving and idea development. Stanford University ini-
tially extended and developed Design Thinking education
programs. The approach has been implemented in organi-
zations internationally (Martin, 2009).
CSEDU 2019 - 11th International Conference on Computer Supported Education
534

to create a class diagram and code skeleton for a given
task. At the course middle, 9242 learners
2
had en-
rolled for this four-week online course. To keep the
number of surveys in this course at an acceptable
amount, we grouped Week 1 + 2 and Week 3 + 4 in
two modules for measuring skill confidence develop-
ment. These weeks formed a pair with regard to their
content. Besides these two modules, the excursus on
object-oriented modeling formed a third module. The
surveys were positioned before and after the learn-
ing content of all three learning modules (Module 1:
week 1 + 2, Module 2: week 3 + 4, and Module 3:
Excursus).
4.2 SCR Setup
The online course contained three coherent learning
modules, therefore the SCR consisted of three pre
and post tests. The pre SCR questions marked the be-
ginning of a new learning module (e.g., start of week
1) and the post SCR followed at the end of a learning
module (e.g., end of week 2). Participants estimated
their confidence with skills that were central to the
methods covered in each module before and after
taking the module. The example below shows a
question from the survey (in English translation).
Example for question item 1, module 1
Question 1, German:
pre: Wie sicher fuehlst du dich Methoden in Java
zu deklarieren und aufzurufen?
post: ...nach Woche 1 und 2?
Question 1, English Translation:
pre: How confident do you feel with declaring and
invoking methods in Java?
post: ... after week 1 and 2?
The Likert response scale for every question
ranged from 1 (”ueberhaupt nicht sicher”, english:
”not at all confident”) to 10 (”absolut sicher”, english:
”absolutely confident”).
2
We consider the enrollment number at the course mid-
dle as our reference point, as only those participants have
the option to finish the course with an acceptable result.
While we issue a certificate to all participants who have
achieved more than 50% of the available points in the
graded exercises, we know from statements of our users that
many of them only consider a result of 80-100% as accept-
able. Until the end of the course, the number of enrolled
learners had increased to 10,402.
5 ANALYSIS
As a first step, we cleaned all data sets. We only
considered subjects who had filled in both the pre
and post questions per module. We also elimi-
nated subjects with missing values for either pre or
post SCR questions. In the following, we refer to
cleaned datasets that only include subjects who filled
in both pre and post ratings in one module as ”merged
per module”. Likewise, we cleaned datasets that
only include subjects who filled in the pre and post
SCR in both modules (module 1 and 2) as ”merged
across modules”. Subsequently, we calculated means
with standard deviations and confidence intervals for
cleaned and merged datasets per module. Next, we
analyzed the relation between SCR values and per-
formance measures. For performance measures we
looked at learners’ total points received in the course,
and the number of issued records of achievement. To
explore this issue, we use the term ”relative confi-
dence gain (RCG)” in this paper. We introduce this
new dimension because the plain difference between
the pre SCR and the post SCR values neglects to take
into account how much perceived confidence a par-
ticipant possibly might have gained or lost between
the surveys. Due to the scale of the survey questions
(1-10), a participant that has started with a pre SCR
of 1 can increase her confidence by 9 points. A par-
ticipant who has started with a pre SCR of 5, how-
ever, can increase their confidence by only 5 points, a
participant who started with 10 cannot increase their
confidence at all. The same applies for a possible de-
crease in the other direction. Hence, if we use the
plain difference between pre and post SCR, the result
would be distorted. The difference would be the same
for a user who starts with pre SCR 1 and ends with
post SCR 2 as for a user who starts with pre SCR 9
and ends with post SCR 10. The first user, however,
only increased their confidence by 11% of the poten-
tially possible increase. The second user, in contrast,
increased their confidence by 100% of the potentially
possible increase. The RCG takes this into account by
including the maximum possible increase or decrease.
Below are the equations for determining the learner’s
gain or loss:
100
max − pre
×
post − pre
max
(1)
100
pre − min
×
pre − post
max
(2)
Equation 1 became effective when the learner had a
gain in confidence, equation 2 became effective when
Skill Confidence Ratings in a MOOC: Examining the Link between Skill Confidence and Learner Development
535
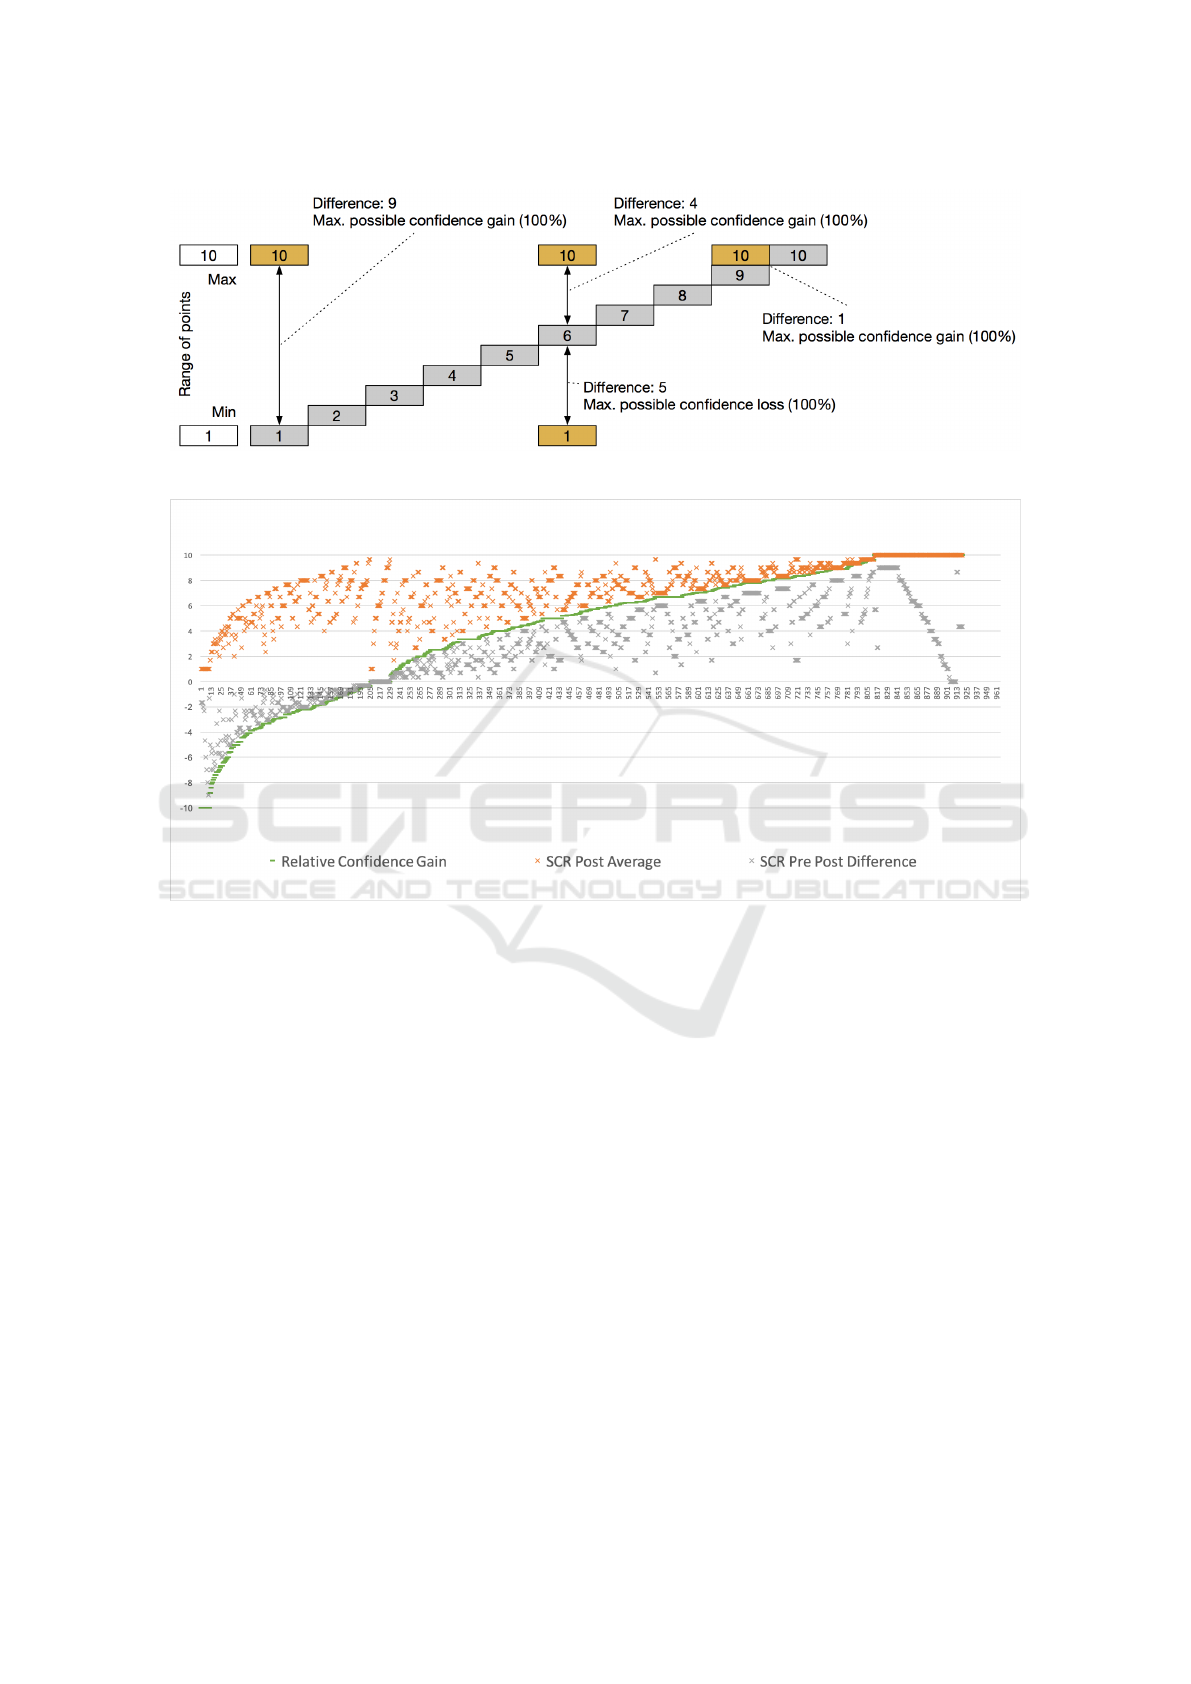
Figure 1: Visualization of the Relative Confidence Gain (RCG).
Figure 2: Comparison of difference measure with relative confidence gain analysis for module 1. Y-axis: relative confidence
gain or loss, X-axis: individual participants. (Values are ordered from low to high relative confidence gain (RCG).)
Relative Confidence Gain: The relative confidence gain (RCG) of the participant for module 1.
SCR Post Average: The result of a participant in the post module 1 SCR survey (average of the three questions per participant).
SCR Pre Post Difference: The difference between the average pre- and post-SCR survey results in module 1.
the learner had a loss in confidence. In comparison to
established models, like the normalized gain used by
Hake (Hake, 1998), the RCG also accounts for loss
in students’ perceived confidence, and uses individual
student values instead of the student average. See Fig-
ure 1 for a visualization of the RCG model, and Figure
2 for a course data graph which shows that the RCG
is more informative than the plain difference, particu-
larly for participants that started with a very high skill
confidence rating in the pre module survey, as it takes
the possible gain of experience into account.
6 RESULTS
6.1 Sample
9242 participants enrolled in the online course, of
which 4501 filled in the pre SCR for the first learning
module. For module 2, 1961 learners filled in the pre
survey and for the additional learning module (’ex-
cursus’), 1536 learners finished the pre SCR. In all
three pre-post SCR evaluations fewer learners filled in
the pre than the post survey. The cleaned and merged
dataset per module offered a sample of n = 1689 for
module 1 and n = 1147 for module 2. The cleaned
and merged dataset across all modules excluding the
excursus left a sample of n = 920. Since the group
work content of module 3 differed significantly from
CSEDU 2019 - 11th International Conference on Computer Supported Education
536
the individual work content of the first two models,
we only considered the SCR results of module 1 and
2 in our results section for this paper. Table 1 shows
an overview of all sample sizes.
6.2 Frequency Distribution
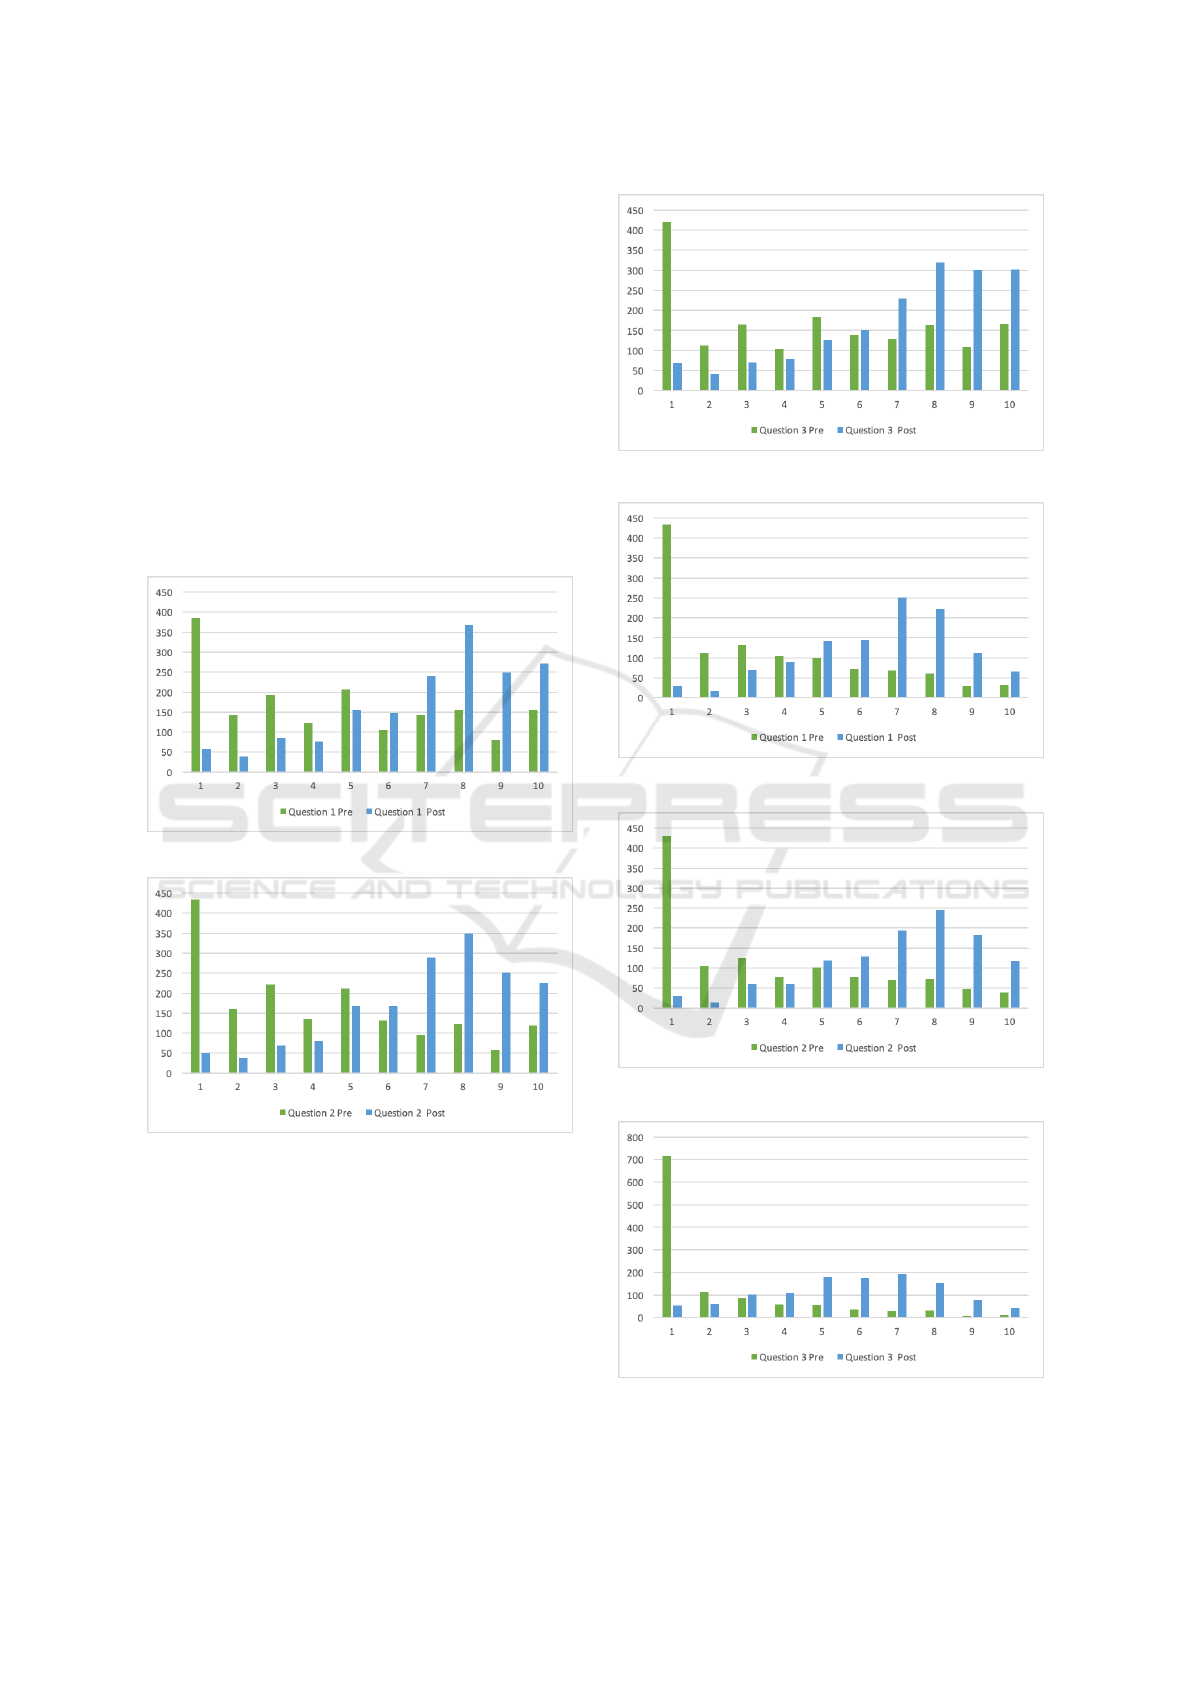
Figure 3 to 8 show the distribution of participants’
pre and post ratings per question for both modules.
The graphs show that participants’ skill confidence
perception was on average higher in the post mod-
ule survey than in the pre module survey. With skill
confidence ratings for questions within a module and
means being similar (see Table 2), we will visualize
the average value of all questions or means per mod-
ule in other graphs.
Figure 3: Module 1, Question 1: Pre and Post Values.
Figure 4: Module 1, Question 2: Pre and Post Values.
6.3 Mean Distribution
Table 2 contains the mean comparison of SCR ratings
for all questions, showing an increase of means from
pre to post rating. Confidence intervals for the data
show a small range of data points between upper limit
and lower limit, indicating that it is possible to check
for both between-person effects and within-person ef-
fects. Table 2 also shows lower initial skill confidence
ratings for module 2 than for module 1. Initial con-
fidence values in module 1 ranged from 4.24 to 4.82;
Figure 5: Module 1, Question 3: Pre and Post Values.
Figure 6: Module 2, Question 1: Pre and Post Values.
Figure 7: Module 2, Question 2: Pre and Post Values.
Figure 8: Module 2, Question 3: Pre and Post Values.
whereas initial confidence values for module 2 ranged
Skill Confidence Ratings in a MOOC: Examining the Link between Skill Confidence and Learner Development
537

Table 1: Overview of sample sizes in pre and post SCR tests for all learning modules.
Learning module Pre Post merged per module merged across
module 1 and 2
1 N = 4501 N = 1962 N = 1689 N = 920
2 N = 1961 N = 1283 N = 1147 N = 920
Excursus N = 1536 N = 477 N = 427
Table 2: Mean comparison between pre and post SCR for all question items per module, in datasets merged per module.
Pre Post
Module 1
1. How confident do you feel to define and call methods in Java (before
and after Module 1)?
M = 4.69 (n =
1689), 95% CI
[4.68, 4.69]
M = 7.07 (n =
1689), 95% CI
[7.06, 7.07]
2. How confident do you feel to define and instantiate classes and ob-
jects (with State and Behavior) in Java (before and after Module 1)?
M = 4.24 (n =
1689), 95% CI
[4.23, 4.24]
M = 7.01 (n =
1689), 95% CI
[7.00, 7.01]
3. How confident do you feel in using control structures (such as con-
ditions and loops) in Java (before and after Module 1)?
M = 4.82 (n =
1689), 95% CI
[4.81, 4.82]
M = 7.1 (n =
1689), 95% CI
[7.16, 7.17]
Module 2
1. How confident do you feel in your understanding of the concepts
of inheritance and polymorphism. Are you confident to apply these
concepts (before and after Module 2)?
M = 3.45 (n =
1147), 95% CI
[3.45, 3.46]
M = 6.47 (n =
1147), 95% CI
[6.47, 6.48]
2. How confident do you feel to apply the concept of encapsulation
and use visibility modifiers in object-oriented programming (before and
after Module 2)?
M = 3.65 (n =
1147), 95% CI
[3.64, 3.65]
M = 6.93 (n =
1147), 95% CI
[6.92, 6.93]
3. How confident do you feel to use Java Collections (before and after
Module 2)?
M = 2.25 (n =
1147), 95% CI
[2.24, 2.25]
M = 5.73 (n =
1147), 95% CI
[5.72, 5.73]
from 2.25 to 3.65; on average 1,47 scale points below
module 1.
6.4 Learner Skill Confidence and
Learner Performance
We looked at the relationship of learners’ relative con-
fidence gain (or loss) and their course points. Results
do not show a correlation between RCG and average
points reached: The correlation for RCG and aver-
age points in module 1 is r = -.06, with a p-value of
0.055; the correlation in module 2 is r = -.03789, with
a p-value of 0.025, which makes the correlation coef-
ficient statistically insignificant. Thereby, we cannot
prove a correlation between RCG and learner perfor-
mance. We consequently visualized the variables with
scatterplots, showing the trendlines for the respective
values (see 9). These suggest that there is no correla-
tion between the two variables. Furthermore, we visu-
alized different performance groups in the graph: low
performers, medium performers, and top performers
(categories based on the points gained in the course,
see Table 3). Likewise, results of learners in different
performance groups do not suggest correlation (see
Figure 9).
Table 3: Classification of Participant Performance.
Performance level Learner performance
Low performers less than 50% of total
course points (no certifi-
cate)
Medium performers more than 50% of total
course points, but not in
top 5%
Medium performers more than 50% of total
course points, but not in
top 5%
7 DISCUSSION
In the following, we discuss three main findings from
our results, which correspond to our research sub-
questions. When evaluating the SCR results for all
questions, we found a mean increase for all values
from pre to post rating. For module 1, confidence rat-
CSEDU 2019 - 11th International Conference on Computer Supported Education
538
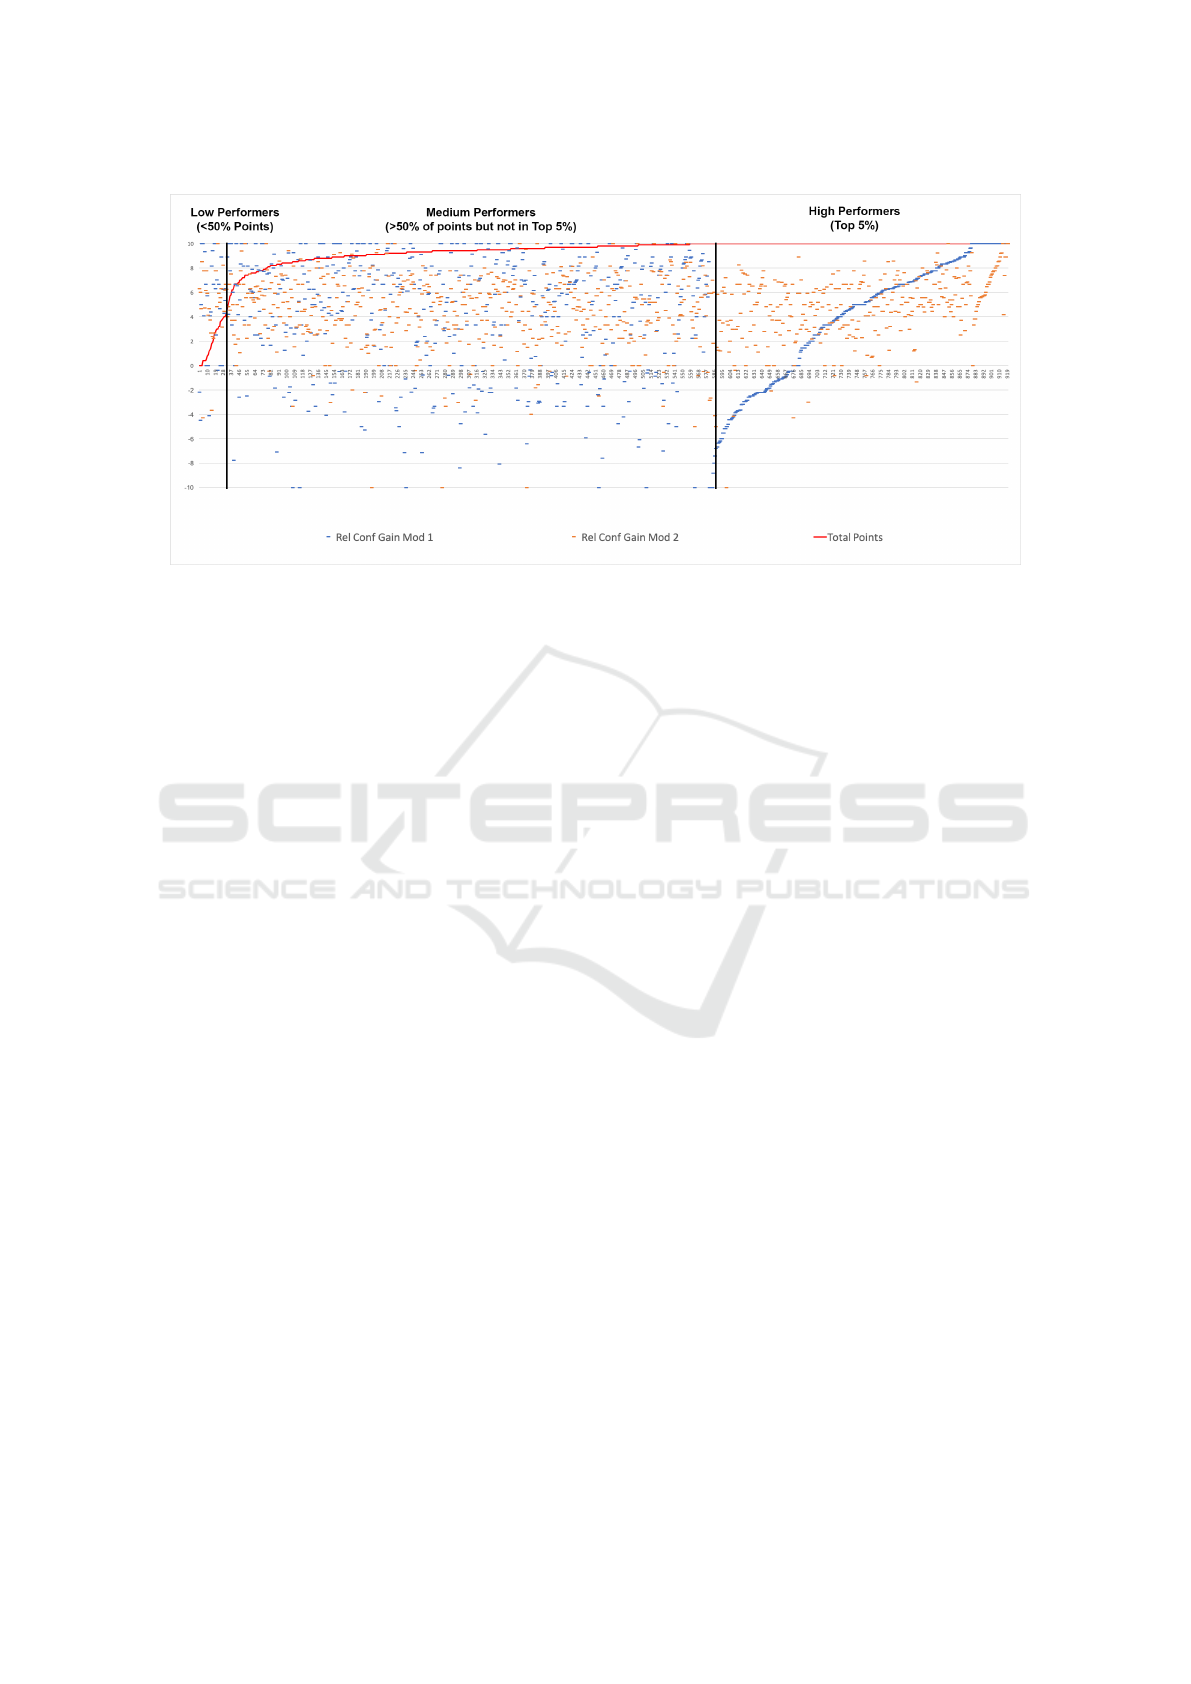
Figure 9: SCR and learner performance scatterplot. Y-axis: relative confidence gain or loss, X-axis: individual participants.
(Values are ordered by 1. Total Points; 2. Rel Conf Gain Week 1; 3. Rel Conf Gain Week 2) Rel Conf Gain Mod 1, 2: The
relative confidence gain for module 1 or 2 respectively. Total Points: The percentage points achieved by the participant in the
course.
ing means for each question increased more than 2.4
scale points on average. Ratings rose clearly for ques-
tion 2, describing the skill of ”defining and instantiat-
ing classes and objects”, with 2.77 scale points in dif-
ference. For module 2, means rose even more visibly:
3.2 scale points on average.
We assume that learners perceive an increase of
their skill confidence during the learning modules.
This might be due to the ongoing training experience
as such, or the satisfying quality of the learning con-
tent. Learners’ perception of their confidence may
also have changed due to course expectations or the
time that passed.
We found that initial skill confidence values were
on average lower for module 2 than for module 1.
This might be related to a shift in learners’ expecta-
tions of successfully finishing the first module. This
behavior would be in line with Bandura’s work on
self-efficacy (Bandura, 1977). Bandura argues that
confidence increases if the learner has a high ex-
pectancy of success, and decreases if the learners has
a low expectancy of success or fear of failure. Mod-
ules in this MOOC were blocks that build on one an-
other. The first module in this Object-Oriented Pro-
gramming in Java MOOC introduced learners to ba-
sic concepts with the goal of aligning novice, be-
ginner and more advanced learners. The topics of
the second module could be considered as more ad-
vanced. Learners who started the first module confi-
dently might have reduced their expectations after un-
derstanding the scope of the learning content, and thus
entered lower initial confidence ratings for the sec-
ond module in general. Furthermore, 304 participants
(33.04%) of the ’merged across all modules’ sample
stated ’expert’ or ’advanced’ skills in programming in
their platform profile. It is possible that these learn-
ers rated their initial skill confidence higher because
they were confident to succeed in the first module due
to their priorly acquired skills. Alternatively, learners
might have been familiar with the concepts of module
1 from prior experiences, but not with the concepts of
module 2. We assume that learners entered a lower
initial skill confidence rating for the second module
because they had a lower expectancy of success.
We could not find a correlation between learner skill
confidence and learner performance. Our findings did
not provide evidence for a relation between relative
confidence gain and performance outcome measures
(total points received). We thus need to explore this
issue further in upcoming research.
7.1 Implications
Our findings have different implications for the use of
the SCR survey in MOOCs. Firstly, the survey could
be used as a tool to assess if in general, learner confi-
dence with specific skills improves during the course.
Secondly, the survey could be used as a tool to assess
whether learners need more support in gaining a re-
alistic understanding of the tasks they are facing, and
whether they need additional help to adapt to the diffi-
culty. Both of these applications allow course instruc-
tors to intervene and react during the course if neces-
sary. Thirdly, we cannot draw any implications about
the survey’s use as a tool to correlate skill perception
and learner performance. To explore this further, we
Skill Confidence Ratings in a MOOC: Examining the Link between Skill Confidence and Learner Development
539

will conduct the survey repeatedly and explore rea-
sons for the (in)ability of learners to adequately as-
sess their skill level. We will also look into the pos-
sible effect of sources of self-efficacy as postulated
by Bandura, such as experiences of success or failure,
on the learner’s self-efficacy and resulting behavior
(Bandura, 1986), in between surveys, which may dif-
fer from their initial skill perception.
7.2 Limitations
Assessing learner (skill) confidence in surveys is a
challenging task: In a study with university students,
Dinsmore and Parkinson found that students’ confi-
dence ratings in a post-task survey include elements
on person and task characteristics, and often even
a combination of person and environment character-
istics (Dinsmore and Parkinson, 2013). Their data
proves that participants were taking into account mul-
tiple factors when rating their confidence. Their
findings reveal the problems in surveying confidence
ratings. While calibration focuses on the distance
between perceived and demonstrated levels of un-
derstanding, capability, competence, or preparedness
(Alexander, 2013) in comparison to our emphasis on
skill confidence, we will consider findings from the
discipline for our research, especially the scope of
calibration effects (Pieschl, 2009). In future vali-
dations and iterations of the skill confidence rating,
we will furthermore consider the possibility of using
other models of measuring (Dinsmore and Parkinson,
2013).
ACKNOWLEDGEMENT
We thank the course designers and instructors of our
case MOOC and the platform team.
REFERENCES
Alexander, P. A. (2013). Calibration: What is it and why it
matters? an introduction to the special issue on cali-
brating calibration. Learning and Instruction, 24:1–3.
Annett, J. (1989). Training skilled performance. Acquisition
and performance of cognitive skills, pages 61–84.
Bandura, A. (1977). Social Learning Theory. Prentice Hall
series in social learning theory. Prentice Hall.
Bandura, A. (1986). Social foundation of thought and ac-
tion: A social-cognitive view. Englewood Cliffs.
Bandura, A. (2006). Guide for constructing self-efficacy
scales. Self-efficacy beliefs of adolescents, 5(1):307–
337.
Bell, B. S. and Kozlowski, S. W. (2010). Toward a the-
ory of learner-centered training design: An integrative
framework of active learning. Learning, training, and
development in organizations, pages 263–300.
Dinsmore, D. L. and Parkinson, M. M. (2013). What are
confidence judgments made of? Students’ explana-
tions for their confidence ratings and what that means
for calibration. Learning and Instruction, 24:4–14.
Dreyfus, S. E. (2004). The five-stage model of adult skill
acquisition. Bulletin of Science, Technology & Soci-
ety, 24(3):177–181.
Dreyfus, S. E. and Dreyfus, H. L. (1980). A five-stage
model of the mental activities involved in directed
skill acquisition. Technical report, California Univer-
sity Berkeley Operations Research Center.
Haggard, S. et al. (2013). The maturing of the MOOC. bis
research paper no. 130.
Hake, R. R. (1998). Interactive-engagement versus tra-
ditional methods: A six-thousand-student survey of
mechanics test data for introductory physics courses.
American Journal of Physics, 66(1):64–74.
Hood, N., Littlejohn, A., and Milligan, C. (2015). Context
counts: How learners’ contexts influence learning in a
MOOC. Computers & Education, 91:83–91.
Keller, J. and Suzuki, K. (2004). Learner motivation and e-
learning design: A multinationally validated process.
Journal of Educational Media, 29(3):229–239.
Keller, J. M. (1987). Strategies for stimulating the motiva-
tion to learn. Performance Improvement, 26(8):1–7.
Mackness, J., Mak, S., and Williams, R. (2010). The ideals
and reality of participating in a MOOC. In Proceed-
ings of the 7th International Conference on Networked
Learning. University of Lancaster.
Martin, R. L. (2009). The design of business: Why design
thinking is the next competitive advantage. Harvard
Business Press.
Moller, L. A. (1993). The effects of confidence building
strategies on learner motivation and achievement.
Pieschl, S. (2009). Metacognitive calibration—an ex-
tended conceptualization and potential applications.
Metacognition and Learning, 4(1):3–31.
Salas, E., Tannenbaum, S. I., Kraiger, K., and Smith-
Jentsch, K. A. (2012). The science of training and de-
velopment in organizations: What matters in practice.
Psychological science in the public interest, 13(2):74–
101.
Taheri, M., Mayer, L., von Schmieden, K., and Meinel, C.
(2018). The DT MOOC prototype: Towards teaching
design thinking at scale. In Design Thinking Research,
pages 217–237. Springer.
Usher, E. L. and Pajares, F. (2008). Self-efficacy for self-
regulated learning: A validation study. Educational
and Psychological Measurement, 68(3):443–463.
Weiner, B. (1974). Achievement motivation and attribution
theory. General Learning Press.
Yuan, L. and Powell, S. (2013). MOOCs and open educa-
tion: Implications for higher education.
CSEDU 2019 - 11th International Conference on Computer Supported Education
540
