
Progress Monitoring in Primary Education using Levumi: A Case Study
Andreas M
¨
uhling
1
, Jana Jungjohann
2
and Markus Gebhardt
2
1
Department of Computer Science, Kiel University, Christian-Albrechts-Platz 4, 24116 Kiel, Germany
2
Department of Rehabilitation Sciences, Technische Universit
¨
at Dortmund,
Emil-Figge-Straße 50, 44227 Dortmund, Germany
Keywords: Learning Progressions, Progress Monitoring, Online Assessment, Assessment Tool, Primary Education,
Research-based Instruction, Data-driven Educational Research.
Abstract:
We present, as a case study, the web-based platform Levumi that enables teachers to easily monitor learning
progressions of children with a focus on elementary skills in reading, writing, and mathematics. Curriculum-
based measurements are used that can be administered economically in short time and - in many parts - in
parallel for multiple children. The system is built around exchanging data between schools and educational
research, such that data with high ecological validity can be collected anonymously in order to gain insights
into learning processes and in turn offer improved tests for teachers. For this case study, the acceptance and
use of the platform over the last years is evaluated with a focus on tests for reading abilities. The results show
how that many users are integrating the system in their daily teaching, learning progressions can be assessed
and that the data is even usable for validation purposes.
1 INTRODUCTION
In recent years, education in Germany has seen a
shift towards inclusive educational settings in which
children with and without special educational needs
(SEN) are mixed in classrooms. In 2009, this step
was mandated by legislative changes that followed the
UN-Convention on the Rights of Persons with Dis-
abilities.
Such fundamental changes in educational settings
need to be followed by changes in the education it-
self (Lindsay, 2007). In particular, the academic
performance in inclusive classrooms differs between
students with and without special educational needs
(Gebhardt et al., 2015). Consequently, in the first
years of primary education, teachers must take on
a much more personalized approach to education,
which provides a challenge in itself.
Learning progressions conceptualize the idea of
a person’s learning gain that can be measured reli-
ably and valid and visualized over time. Curriculum-
based measurements (CBMs) are a formative and em-
pirically tested approach to assessing learning pro-
gressions for basic academic skills, such as reading,
writing, and mathematics (Ardoin et al., 2013; Deno,
2003). One main characteristic of CBMs is that they
can be easily and very frequently administered dur-
ing regular lessons by teachers (Fuchs, 2017). After
multiple measurements, CBMs allow to graph chil-
drens’ learning slopes so that - based on this informa-
tion - teachers can evaluate the effectiveness of their
instruction and possibly select interventions for a par-
ticular learner. The effectiveness of such an interven-
tion can then, again, be identified based on the results
of the CBMs.
Digital technology can help in administering
CBMs, in visualizing the learning slopes, and in keep-
ing track of learning progressions over time (Maier
et al., 2016). Additionally, the results can be analyzed
in more detail and used for providing semi-automated
feedback for teachers, e.g. in the form of adaptive
testing, or automated suggestion of interventions and
teaching material.
In this article, we present a case-study and multi-
ple analyses of the platform Levumi that - as a cooper-
ative research project - strives to provide a data-driven
service at the cross-section of real-world teaching and
educational research.
2 DESCRIPTION OF LEVUMI
The platform Levumi (www.levumi.de - currently
only available in German) offers several CBM tests
Mühling, A., Jungjohann, J. and Gebhardt, M.
Progress Monitoring in Primary Education using Levumi: A Case Study.
DOI: 10.5220/0007658301370144
In Proceedings of the 11th International Conference on Computer Supported Education (CSEDU 2019), pages 137-144
ISBN: 978-989-758-367-4
Copyright
c
2019 by SCITEPRESS – Science and Technology Publications, Lda. All rights reserved
137

that teachers can use during their lessons. It is web-
based and can be used free of charge after registering.
We distinguish between three types of users: Teach-
ers, Researchers and Parents. We only analyze data
collected from teacher accounts, however. The back-
end of the platform is structured like a school - it of-
fers to create classes that contain students. Teach-
ers are asked to indicate for each student whether
they have any special educational needs and whether
they have immigrated to Germany. This data is used
to evaluate the fairness of the tests, in particular the
reading/writing tests. As data protecting is an impor-
tant topic for teachers, we have opted to completely
anonymize the student data. While teachers are reg-
istering the students with a name, this name is en-
crypted and decrypted within the browser using AES
and a password that is only stored as a hash in out
database.
Teachers can select any of the available tests for
each of their classes and conduct measurements as
often as desired. We suggest to use a fixed rhythm
for testing, e.g. every two weeks, to help in assess-
ing learning progressions. Currently, these tests are
available:
Reading. Recognizing characters, reading of sylla-
bles, reading of words, reading of pseudo-words,
reading of standard vocabulary, reading compre-
hension (fill in the blank)
Writing. Dictation of words
Mathematics. Reading numbers, identifying num-
bers on a number line, completing arithmetic tasks
(fill in the blank).
Most tests are available in several levels of diffi-
culty to allow teachers to select a suitable level for
either the complete class or individual students. For
example, for reading fluency, levels are based on sub-
sets of characters that are appearing in the items and
teachers can introduce a new level as soon as all the
necessary characters have been taught. Many tests
can be taken by the students on their own, using a
personal login that is created randomly by the plat-
form. The only exception are the tests for reading
fluency - as the teacher needs to judge the reading of
the student manually (as shown in Fig. 2). All tests
are based on competence models of the respective do-
main and are statistically evaluated using IRT models.
The tests either use a fixed itempool from which items
are drawn randomly, sometimes with restrictions, for
each new measurement. For other tests, items are gen-
erated based on rules instead.
The results are presented both on class level and
on an individual level for each student (see Fig. 1).
It is particular this personalized information that is
valuable in inclusive teaching settings. In addition
to this visual display of the learning progression, the
platform offers information on items that a student
frequently gets correct or incorrect to help teachers
in identifying potential problem spots. For reading,
this information can for example identify characters
or syllables that a student is struggling with.
The design of the platform is very simplistic to
prevent distraction of students with SEN that form a
major target group for CBMs. Children receive a vi-
sual feedback in form of a purple dragon that is either
happy or studying depending on whether the previous
test result has been better or worse than the current
one. All tests are using a font that is used in primary
education textbooks in Germany and fontsize can be
adapted for each child prior to testing.
In addition the tests, there is also the possibility
of offering teaching materials that are tailored to the
CBMs that teachers can use as a basis for interven-
tions, for example. Currently, we offer this material
for reading only, but more material for others tests
will follow. All Levumi materials and tests are or
will be published under a creative commons license
for free use or as open educational resources.
3 CASE STUDY AND DATA
COLLECTION
For this case study we are taking a look at the de-
velopment of the platform regarding users and how
test and learners perform using the data that has been
collected over the last three years since the platform
started.
The first users have registered right before the start
of the final quarter of 2015 and we collected all data
until the start of the final quarter in 2018 so that we
have a full three years of user data. Accounts that
are used for research, administrative purposes or for
teacher training are not taken into account here - only
accounts that teachers created themselves. Also, each
account has a “playground” class that exists right after
an account is created. We suggest that teachers use
this class to preview new tests or try creating students
and generally getting to know the platform. The data
collected within these classes are not exported and not
used for the analyses here.
As exemplary tests for this case study, we focus
on the reading fluency test on a syllable level. The
are particularly important because reading fluency in-
fluences both the early reading acquisition and later
skills (NRP, ; Nation, 2011). There are six levels of
difficulty available in Levumi each with an associated
itempool. Each item is a (German) syllable (e.g. “ma”
CSEDU 2019 - 11th International Conference on Computer Supported Education
138
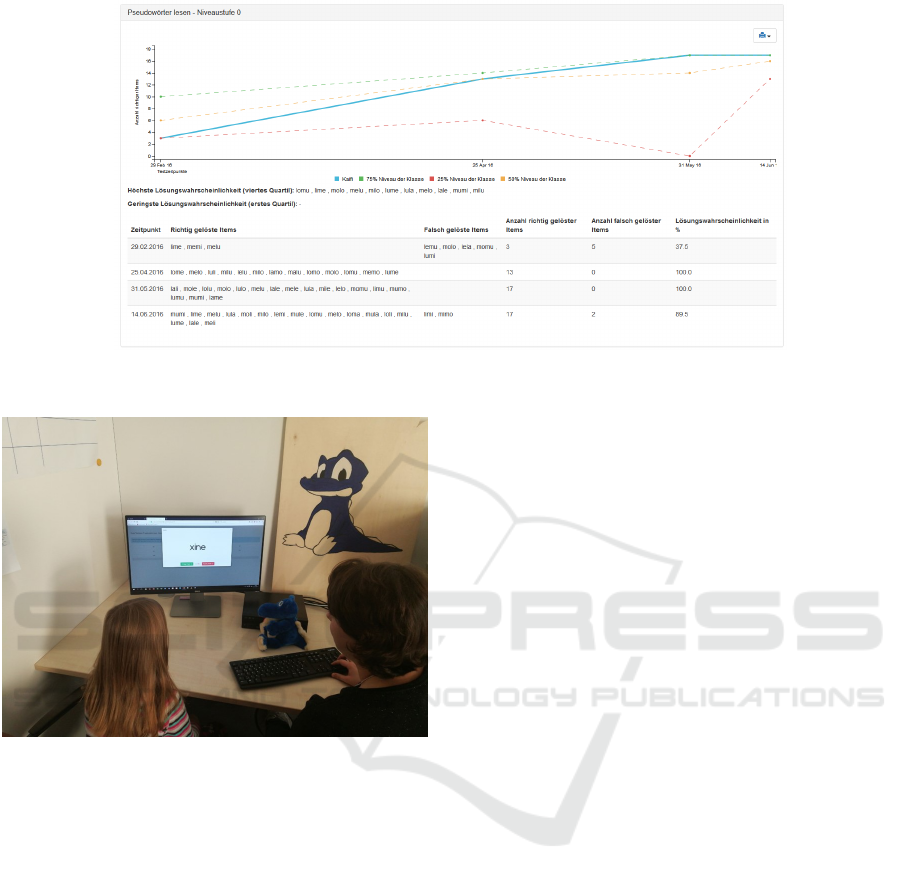
Figure 1: The visualization of results for a single student.
Figure 2: A reading fluency test using Levumi in the class-
room.
or “schu”). The tests have been adapted from a paper-
and-pencil version (Diehl and Hartke, 2011, in Ger-
man). Starting from these tests, there have been sev-
eral small improvements to achieve better homogene-
ity of the tests. The changes included removing items
and moving items to different levels. For the analyses
presented here, we are using the itempool of the latest
version of the tests and include all data collected for
each of the syllables in this pool in the corresponding
difficulty level. So for items that have been moved,
there are less measurements available than for items
that have been unchanged since the beginning - which
forms the vast majority of items.
The lowest level of difficulty is just a screening
test that has no time limit, all other levels are speed
tests with a duration of one minute each. For each first
measurement, the items are presented in a fixed order,
for all other measurements, they are drawn randomly
from the itempool. During testing, a child is presented
with an items and reads it aloud. The teacher assesses
the correctness of the reading by pressing either 0 or
1 on the keyboard which in turn leads to the next syl-
lable being displayed (Fig. 2. Teachers receive a writ-
ten training on how to assess the reading, for example
when a child hesitates during reading. Currently, we
are preparing an audio version of teacher training that
offers actual reading examples.
4 USER DEVELOPMENT AND
USAGE PATTERN
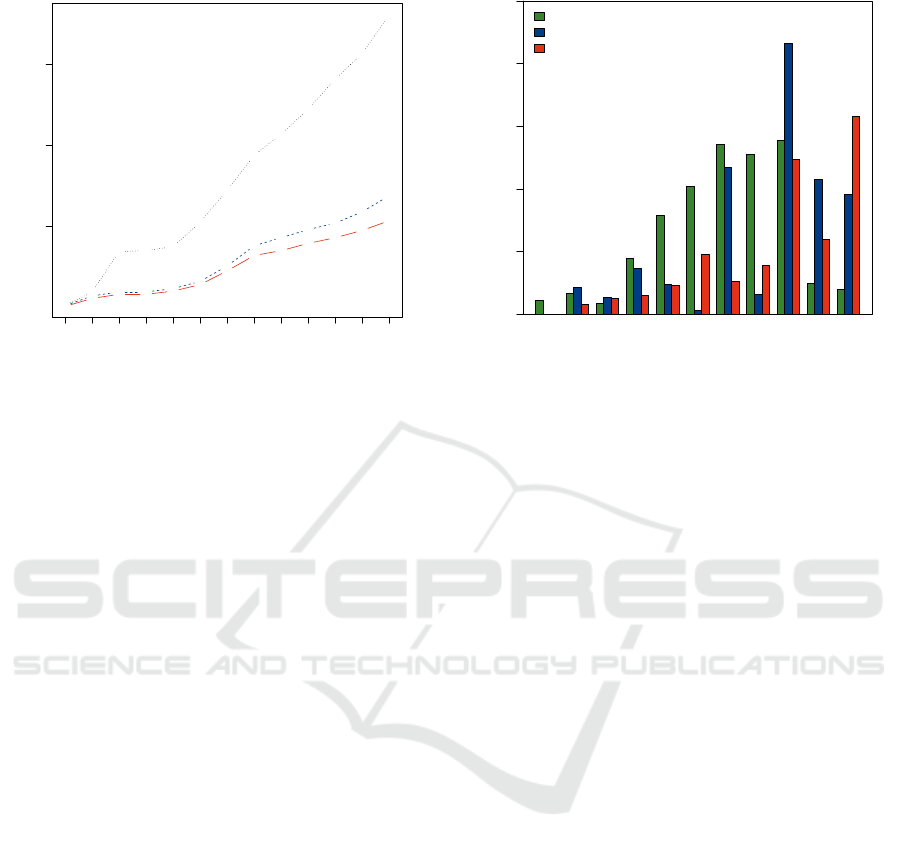
Since its beginning in 2015, Levumi has seen a con-
stant increase in teacher users. Up until October 1st
of 2018, there are 361 teachers registered on the plat-
form of which 254 have logged in at least once. The
progression of teacher accounts over time can be seen
in Fig. 3.
Of the 138 users who have created at least one
class, 108 have one or two classes, the remaining 30
have more than two with only 14 accounts having
more than four classes. On average, 19.2 students are
created per account with the first and third quartile of
this distribution being 9 and 23.
So, roughly 70% of registered users actually start
logging into the platform. Of these, about 50% have
created at least one class, but more than 80% of these
users then use the platform to collect data. On aver-
age, 28 days are passing between the registration and
the first data collection - so this is an indication of the
time teachers need to get to know the platform and
prepare their lessons in a way to use the platform in
their classes.
As Levumi was launched after the school year of
2015 had already started and the current school year
of 2018 is not yet finished, 2016 and 2017 are the
Progress Monitoring in Primary Education using Levumi: A Case Study
139
●
●
●
●
●
●
●
●
●
●
●
●
●
User development
Quartals
Number of users
●
●
● ●
●
●
●
●
●
●
●
●
●
●
●
● ●
●
●
●
●
●
●
●
●
●
2015 Q3 2016 Q2 2017 Q1 2017 Q4 2018 Q3
100 200 300
Figure 3: Development of the user accounts since the
start of the platform in 2015, aggregated for each quarter
year. Black (dotted) are registered teacher accounts, blue
(dashed) are accounts that have created at least one real
class in the platform and red (solid) are accounts that ad-
ditionally have used the platform at least once for actual
testing.
two remaining, complete school years in our data set.
For these years, there are 47 and 65 users respectively
who have collected data at least once over the school
year. Between these two groups there is an overlap of
22 users that have been active in both years while 25
users have become inactive from 2016 to 2017 and 43
users have begun using the platform actively in 2017
for the first time.
For both years, the usage follows more less the
same distribution. On average, 17.2 different mea-
surements (differing in either the test that was used or
the day that was used for testing) have been collected
from all active accounts in 2016 and 18.1 in 2017.
The first and third quartile of these distribution is 3.5
and 18.0 for 2016 and 3.0 and 18.0 for 2017 show-
ing a skewed distribution where about one fourth of
the users are highly active, as the maximum number
of measurements for 2016 and 2017 are 133 and 137
respectively.
When taking a closer look at one of the test fam-
ilies - reading fluency of syllables - we can see how
the progression over the school year looks like (Fig.
4). The six difficulty levels of the test are grouped
in sets of two for the diagram. Teachers begin with
the easier levels of the test and, as the school year
progresses, use also the more difficult levels. In gen-
eral, the bulk of testing is done in the second half-year
around May, except for the two levels grouped under
the label “difficult” which have the most testings in
Sep 2016 Dec 2016 Mar 2017 Jun 2017
Easy
Medium
Difficult
Usage of tests
Month
Test results
0 50 100 150 200 250
Figure 4: Usage of reading fluency tests (syllables) in each
month of the school year of 2016/2017 by all users, grouped
according to difficulty of the test.
July right before the end of the term.
5 TEST QUALITY
Aside from the easiest level all levels are designed as
speed tests. This means that each item should have
the same item difficulty and this should be rather high
(i.e. easy) as a person’s ability will not be judged by
the most difficult item that this person answers cor-
rectly but instead by the number of items that have
been answered correctly in a given amount of time.
The test has been constructed based on a theoretic
model of developing reading abilities and we are us-
ing the data collected with the platform in order to
empirically verify this assumption for the real-world
data that we are collecting.
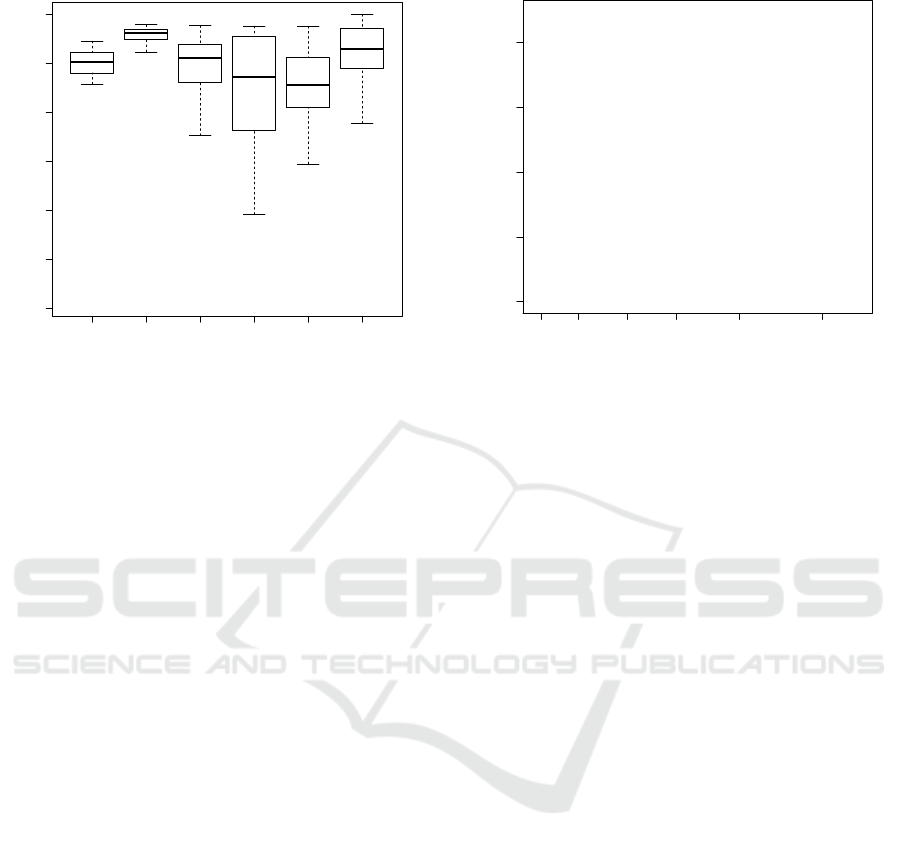
The item difficulty of the items of each difficulty
level is presented as a series of box-plots in Fig. 5. As
is visually apparent, the difficulty of the items is - for
most levels - rather similar and also rather close to 1.0.
Outlier detection yields ten items of interest for four
of the six difficulty levels. Most noteworthy of these
ten items are the three items with a difficulty below
0.6 in levels M1 and D1. These outliers are syllables
that are rather uncommon in every day German lan-
guage (e.g. “qu
¨
a” or “do”). It makes therefore sense
to assume that more children will struggle with read-
ing those unknown syllables compared to ones that
appear more often in their everyday reading exercises.
A future redesign of the tests based on the empirically
collected data may be useful, even though the theory
underlying the tests suggests otherwise.
CSEDU 2019 - 11th International Conference on Computer Supported Education
140
●
●
●
●
●
●
●
●
●
●
E1 E2 M1 M2 D1 D2
0.4 0.5 0.6 0.7 0.8 0.9 1.0
Item difficulty
Level
Difficulty
Figure 5: Box-plots of the item difficulty (relative fre-
quency of correctly answering the item / reading the syl-
lable) for each level.
Fig. 6 shows how often the items were presented
before the speed limit. Item drawing is random, how-
ever with the following restrictions:
1. An item must never start with the same character
as the previous item to discourage careless errors
of the students. The same goes for the character
pairs ’n’ and ’m’ and ’b’ and ’d’. This restriction
has been suggested by the original designer of the
items.
2. The first testing for each level and student has a
fixed item order. This has been requested by the
partners from educational sciences in order to en-
sure that at least for some items enough measuring
points are created to evaluate the statistics of the
test.
This second restriction can be observed in the
amount of measurement each item has: For most lev-
els there is a clearly visible slope following the fixed
item order for the first test. This is particularly obvi-
ous for Level D2. Outlier detection yields 18 items
for the hardest level and a total of eight items for the
three prior levels together. The outliers for the hardest
level are mostly detected based on the large itempool
where many items only have a small number of mea-
surements. Additionally, a new item had been added
prior to data analysis for which there are no measure-
ments so far. The other outliers can also be explained
by changes to the tests: As mentioned above, there
have been several iterations of adaptions since minor
errors in the itempool were detected. The data for
Fig. 6 is based on the maximally available data for
each item and therefore items that have been intro-
o
o
o
o
o
o
o
o
o
o
o
o
o
o
o
o
o
o
o
o
Item drawing
Items
Number of Results
o
o
o
o
o
o
o
o
o
o
o
o
o
oo
o
o
o
o
o
o
o
o
o
o
o
o
o
o
o
o
o
o
o
o
o
o
o
o
o
o
o
o
o
o
ooo
o
o
oo
o
o
o
o
o
o
oo
o
o
o
o
o
o
o
o
o
o
o
o
o
o
oo
o
o
o
oo
o
o
o
o
o
o
o
o
o
o
o
o
o
o
o
o
o
o
o
x
x
o
o
o
o
o
o
o
o
o
o
o
o
o
o
o
o
o
o
o
o
o
o
o
o
o
o
o
o
o
o
o
o
o
o
o
o
o
o
o
o
o
o
o
o
o
x
o
o
o
o
o
o
o
oo
o
x
x
o
o
o
o
o
o
o
o
o
o
o
o
o
o
o
o
o
o
o
o
o
o
o
o
o
o
o
o
o
oo
o
o
o
o
o
o
o
o
o
o
o
o
o
o
o
o
o
o
o
o
o
o
o
o
o
o
o
o
o
o
o
o
o
o
o
o
o
o
o
o
o
o
o
o
o
o
o
o
o
o
o
o
o
o
o
x
o
o
o
o
o
o
o
o
o
o
o
o
o
o
o
o
x
o
o
o
o
o
o
o
o
o
o
o
o
x
x
x
x
x
x
x
x
o
x
o
x
x
o
x
x
x
x
o
o
o
o
o
o
o
o
o
o
o
o
o
o
o
o
o
o
o
o
o
o
o
o
o
o
o
o
oo
o
o
o
o
o
oo
o
o
o
o
o
o
o
o
o
o
o
o
o
o
o
o
o
o
o
o
o
o
o
o
o
o
o
o
o
o
o
o
o
oo
o
o
o
oo
o
o
o
o
o
o
o
o
o
o
o
o
o
o
o
o
o
o
o
o
oo
o
o
o
x
o
o
o
o
o
o
o
o
o
o
o
o
o
E1 E2 M1 M2 D1 D2
0 100 200 300 400
Figure 6: Number of measurements for each item of each
difficulty level. Outliers are marked as red “x” and are de-
tected based on box-plot statistics.
duced after the first iteration or have been moved from
one level to another will not fit with the distribution
of other items that have been a part of the respective
itempool for longer.
The first restriction can also be observed at least
for level D1 - for this level, almost half of the items
in the pool start with the same prefix (“sch”) and can
therefore not be drawn truly randomly as on average
every second word must not start with an “s”. There-
fore the distribution for this level visibly differs from
the other levels.
5.1 Comparison between Validation
Data and Real-world Data
The data collected in actual teaching scenarios has a
high ecological validity, however a higher noise level
may be expected due to less controlled settings during
data collection. To assess whether or not it is never-
theless usable as data for validation studies, we col-
lected data for one of the levels of the reading tests
in a more controlled setting and compared the IRT-
models derived from this data when compared to the
dataset collected by the teachers in their classes.
We chose the level “Easy 2” as it is widely used
by the teachers and also shows the best performance
regarding item difficulties. The contrasting dataset
was collected by a single researcher in 10 first grade
classes of 10 different primary schools. The re-
searcher has been present for every data collection
and supervised the setting. Overall, there are 371
observations in this data set, compared to 842 in the
real-world dataset, the itempool of this level consists
Progress Monitoring in Primary Education using Levumi: A Case Study
141

of 60 items. The tests are designed as one dimen-
sional speed tests. While not completely compatible
to its prerequisites, the Rasch model is a good choice
among the different IRT-models to fit the data (An-
derson et al., 2017). As a comparison, we also fit-
ted the one-dimensional two-parameter model (“Birn-
baum model”) for each dataset and compared model
fit. We tested both the complete itempool and only
the first half of it - based on the fixed ordering for the
first measurement - in order to reduce the number of
missing values and increase the ration of observations
to items which is crucial for most IRT-models.
The results are shown in Tab. 1. As can be seen,
the general goodness-of-fit test based on Pearson’s
χ
2
statistics indicates a valid model fit for the Rasch
model in all cases. Also, in all cases, the simple model
is preferable according to BIC. When taking a look at
the items themselves for the smaller itempool of 30
items and both data sets none of the infit and outfit
MSQ values are below 0.5 or above 1.5 which serves
as an indication for a usable model. Even the stricter
suggested boundaries of 0.8 and 1.2 for high-stakes
testing are met in more than half of the occasions.
6 STUDENT PERFORMANCE
In total, the teachers who are actively using the plat-
form have registered a 2402 students. One fourth of
the students is older than 10 years, half of the students
are at most 9 years and one fourth is at most 6 years of
age, currently. The distribution of gender reveals that
60.5% of students are male. 37.3% of students have
migrated to Germany and 44.3% of the students have
some form of special need. The distribution is shown
in Tab. 2.
For student performance we are again looking at
the school years of 2016 and 2017 and the tests on
reading fluency of syllables. There are a total of 3624
measurements identified by a combination of a par-
ticular student and a particular date. None of these
measurements are completely empty and in only 350
cases have all items of a test been presented in the
course of the one-minute time limit. On average over
all students and all difficulty levels, 32 words have
been presented/read and - on average - 51.8% of these
were assessed as correct. To judge reading perfor-
mance, both speed and accuracy are important. The
speed remains more or less constant over the various
difficulty levels, however the accuracy decreases con-
stantly (Tab. 3). This is reflected by the item diffi-
culty of the higher levels being lower, on average, as
presented in the last section.
6.1 Progress Monitoring
Levumi has been designed for re-testing children fre-
quently, for example every two weeks, in order to
monitor the learning gains or problem spots of a
child’s competencies. The maximum number of mea-
surements for the same child using reading fluency
tests is 18, and there is a group of three children be-
longing to the same class that have 15 measurement
each for the school year of 2018/2019.
Besides this group of three children, there is a also
a group of eight children that have 14 measurements
each and that also belong to the same group. We con-
ducted an interview with the teacher of this class in
order to find out how she uses the platform in their
daily routine.
She uses a regular interval of two weeks for testing
and deeply integrated the testing as part of her teach-
ing schedule. The testing is done in a time where chil-
dren are supposed to learn for themselves and a sec-
ond person is used to help organize the testing that
takes part in a different room from the rest of the
class. In her experience, the children were eager to
use the platform and were particularly motivated by
the instant feedback that they receive after each test.
She noticed that the children would often talk to each
other about their achieved results after testing. She
also feels that the results of the tests are an accurate
representation of each child’s ability. Just like the
graph presented above, drops and spikes in the graph
are also prevalent in her data set but she acknowledges
that they are due to day to day variations in, for exam-
ple, concentration.
She uses the graphical information on a class level
as a rough indicator of each child’s development. For
more detailed information, she relies on the additional
evaluation that is presented on an individual level for
each child. In particular, the items that have been as-
sessed as wrong frequently allow her to check for spe-
cific characters that may pose a problem to a partic-
ular child. This information is then used as the basis
for an intervention in her teaching. She also uses the
graphs in meetings with the parents and in discussions
with other teachers and states the helpfulness of the
visualization for these occasions.
7 DISCUSSION
Based on the SAMR model, digital technology can
substitute, augment, modify or redefine “analog”
tasks (Hamilton et al., 2016). It serves as a rough indi-
cator of the potential of adopting a new technology in
the classroom. In the case of Levumi, all stages can be
CSEDU 2019 - 11th International Conference on Computer Supported Education
142

Table 1: Results of fitting two IRT models two the real-world (RW) and validation (V) data sets for reading test “Easy 2”.
RW Full RW First half V Full V First Half
GoF Test Rasch pass pass pass pass
BIC Rasch 9573.2 6115.0 2300.7 1779.6
BIC Birnbaum 9899.6 6279.4 2562.5 1857.0
Min Infit MSQ 0.88 0.92 0.44 0.87
Max Infit MSQ 1.12 1.5 1.64 1.14
Min Outfit MSQ 0.73 0.93 0.84 0.90
Max Outfit MSQ 1.15 1.1 1.19 1.13
Table 2: Number of students with some form of special
need.
Learning 874
Cognitive development 32
German language 90
Other 72
Table 3: Word read and percentage correct as measures for
reading speed and accuracy, for (grouped) levels of diffi-
culty.
Easy Medium Difficult
Words read 35.0 33.2 35.3
Percentage correct 58.3% 54.4% 28.6%
reached by various aspects of the platform. If teachers
have been using pen-and-paper CBMs, then having
the read aloud tests is merely a substitution on the first
glance. However, as items are drawn randomly from
an ever-improving item-bank, it is also an augmenta-
tion as this is usually not done manually by teachers.
Having instant feedback for the children, as well as
the visual display of their progression, which can also
be used to discuss a child’s progress with parents and
other teachers, offers a modification that is not eas-
ily achieved without digital technology. Finally, hav-
ing teaching interventions that are suggested by the
platform and evaluated in the course of the regular as-
sessments is a redefinition of teaching, as it allows for
a variety of teaching material to be implemented in
actual teaching - accompanied by diagnostic informa-
tion and evaluation of its success.
The possibilities of an online platform allow for
many improvements of pen-and-paper based progress
monitoring. Results can be evaluated and visualized
in real-time, offering immediate feedback to the chil-
dren. Also, instead of having only a small number
of parallel tests, the random drawing of items from
an empirically evaluated pool allows for a very large
number of potential parallel tests without the teachers
having to pay attention to anything in the process.
On the other hand, for some of the tests, mode
effects may be introduced, e.g. due to the children
having to use a keyboard or mouse. This will have to
be evaluated more closely in the next years. At least
for the reading tests, mode effects are rather unlikely.
If at all, the increase in adaptability (e.g. by adjusting
font-size) may positively influence the test results in
this case.
The growth of users currently is modest, with a
large amount not actually starting to use the platform
at all. One reason may be that teachers lack the re-
quired abilities or confidence. Following the Will-
Skill-Tool model (Knezek and Christensen, 2015),
Levumi provides teachers with the tool for progress
monitoring, but teachers still need to possess the skill
and the will to actually use it. While we only re-
quire the that teachers are familiar with navigating
typical web pages, they still also need the knowledge
of how to integrate the usage into their teaching and
the knowledge of how to assess the results with re-
gard to e.g. reading abilities and how to adapt their
teaching accordingly.
While the system requirements of the platform are
modest, a stable internet connection currently may
pose a problem for many German primary schools.
Regarding training, teachers currently can download a
user manual for the platform or learn with video tuto-
rials. Personal training has been offered occasionally
but we have not yet evaluated its impact. Based on
literature reports (Kopcha, 2012), we are developing
on a situated professional development training that
focuses not only the usage of the platform itself, but
also on manageable and useful scenarios of how to
adapt the teaching in a way that allows frequent mea-
surements to be integrated is needed.
The comparison between the data sets of the
teachers and the validation study show - exemplary
- that the data that is collected with Levumi on a daily
basis in real-world settings does show similar statisti-
cal properties than data collected in a much more ex-
pensive and controlled study-setting. For mathemat-
ics, the results seem to be similar (Jungjohann et al.,
2018). Therefore, it seems plausible to assume that
future validation studies of test iterations can be done
Progress Monitoring in Primary Education using Levumi: A Case Study
143

with the data collected over time. At least for the test
settings that are envisioned, which are low-stakes, the
quality of tests achievable in this way seems to be
good enough.
8 FUTURE WORK AND
CONCLUSION
The case study has shown that Levumi can be usefully
implemented in primary school classrooms to enable
teachers to monitor learning progressions of children.
The data collected - anonymously - can be used to
evaluate and improve tests and therefore are of value
for educational researchers of various domains (e.g.
for special educational needs or discipline-based).
The data collected in this way is cheap and - as the
the results indicate - usable with the additional bene-
fit of its high ecological validity.
There are several directions in which Levumi will
be improved from its current state. First, we are con-
ducting analyses of teachers’ abilities to interpret the
graphical information that we offer.
Also, as we are introducing additional material for
teaching interventions into the platform we are also
are planning to use recommender-systems that sug-
gest material based on test results. By collecting feed-
back from the teachers, we hope to gather information
about the usefulness of the material and to automati-
cally improve the recommendations.
For the reading tests in particular that have been
the focus of this article, we are working on a sys-
tem that allows teacher and students to use different
devices simultaneously to better support tablet com-
puters - or smart-phones in “bring your own device”
settings - and to prevent the children from being dis-
tracted by the teacher using the same device.
REFERENCES
Report of the national reading panel: Teaching children to
read: Reports of the subgroups.
Anderson, D., Kahn, J. D., and Tindal, G. (2017). Explor-
ing the robustness of a unidimensional item response
theory model with empirically multidimensional data.
Applied Measurement in Education, 30(3):163–177.
Ardoin, S. P., Christ, T. J., Morena, L. S., Cormier, D. C.,
and Klingbeil, D. A. (2013). A systematic review
and summarization of the recommendations and re-
search surrounding curriculum-based measurement of
oral reading fluency (cbm-r) decision rules. Journal
of school psychology, 51(1):1–18.
Deno, S. L. (2003). Developments in curriculum-based
measurement. The Journal of Special Education,
37(3):184–192.
Diehl, K. and Hartke, B. (2011). Zur reliabilit
¨
at und va-
lidit
¨
at des formativen bewertungssystems iel-1. inven-
tar zur erfassung des lesekompetenz von erstkl
¨
asslern.
Empirische Sonderp
¨
adagogik, 3(1):121–146.
Fuchs, L. S. (2017). Curriculum-based measurement as the
emerging alternative: Three decades later. Learning
Disabilities Research & Practice, 32(1):5–7.
Gebhardt, M., S
¨
alzer, C., Mang, J., M
¨
uller, K., and Prenzel,
M. (2015). Performance of students with special edu-
cational needs in germany: Findings from programme
for international student assessment 2012. Journal of
Cognitive Education and Psychology, 14(3):343–356.
Hamilton, E. R., Rosenberg, J. M., and Akcaoglu, M.
(2016). The substitution augmentation modification
redefinition (samr) model: A critical review and sug-
gestions for its use. TechTrends, 60(5):433–441.
Jungjohann, J., DeVries, J. M., Gebhardt, M., and M
¨
uhling,
A. (2018). Levumi: A web-based curriculum-based
measurement to monitor learning progress in inclu-
sive classrooms. In Miesenberger, K. and Kouroupet-
roglou, G., editors, Computers Helping People with
Special Needs, pages 369–378, Cham. Springer Inter-
national Publishing.
Knezek, G. and Christensen, R. (2015). The will, skill, tool
model of technology integration: Adding pedagogy as
a new model construct. In Sampson, D. G., Spector,
J. M., Ifenthaler, D., and Isa
´
ıas, P., editors, Proceed-
ings of the IADIS International Conference Cognition
and Exploratory Learning in Digital Age. Maynooth,
Greater Dublin, Ireland 24 - 26 October 2015, pages
84–91. IADIS Press.
Kopcha, T. J. (2012). Teachers’ perceptions of the barriers
to technology integration and practices with technol-
ogy under situated professional development. Com-
puters & Education, 59(4):1109–1121.
Lindsay, G. (2007). Educational psychology and the ef-
fectiveness of inclusive education/mainstreaming. The
British journal of educational psychology, 77(Pt 1):1–
24.
Maier, U., Wolf, N., and Randler, C. (2016). Effects of a
computer-assisted formative assessment intervention
based on multiple-tier diagnostic items and different
feedback types. Computers & Education, 95:85–98.
Nation, K. (2011). Childrens’s reading comprehension dif-
ficulties. In Snowling, M. and Hulme, C., editors, The
science of reading, Blackwell handbooks of develop-
mental psychology, pages 248–265. Blackwell Publ,
Malden, Mass.
CSEDU 2019 - 11th International Conference on Computer Supported Education
144
