
“I Want to ... Change”: Micro-moment based Recommendations can
Change Users’ Energy Habits
Christos Sardianos
1
, Iraklis Varlamis
1
, George Dimitrakopoulos
1
, Dimosthenis Anagnostopoulos
1
,
Abdullah Alsalemi
2
, Faycal Bensaali
2
and Abbes Amira
3
1
Department of Informatics and Telematics, Harokopio University of Athens, Athens, Greece
2
Department of Electrical Engineering, Qatar University, Doha, Qatar
3
Department of Computer Science and Engineering, Qatar University, Doha, Qatar
Keywords: Recommender Systems, Energy Saving Recommendations, Micro-moments, Energy Habits.
Abstract:
Since electricity consumption of households in developing countries is dramatically increasing every year, it
is now more prudent than ever to utilize technology-based solutions that assist energy end-users to improve
energy efficiency without affecting quality of life. User behavior is the most important factor that influences
household energy consumption and recommender systems can be the technology enabler for shaping the users’
behavior towards energy efficiency. The current literature mostly focuses on energy usage monitoring and
home automation and fails to engage and motivate users, who are not as committed and self-motivated. In
this work, we present a context-aware recommender system that analyses user activities and understands their
habits. Based on the output of this analysis, the system synchronizes with the user activities and presents
personalized energy efficiency recommendations at the right moment and place. The recommendation al-
gorithm considers user preferences, energy goals, and availability in order to maximize the acceptance of a
recommended action and increase the efficiency of the recommender system. The results from the evaluation
on a publicly available dataset comprising energy consumption data from multiple devices shows that micro-
moments repeatedly occur within user’s timeline (covering more than 35% of user future activities) and can
be learned from user logs.
1 INTRODUCTION
The rise in the living standards in modern society
over the last years has led to a surge in the daily
use of technology devices and appliances (Hu et al.,
2017), which led to an increase in the consumption
of energy resources and gave rise to new environmen-
tal and socio-economic problems. As a counterpart,
technology plays an assisting role in helping users im-
proving their energy efficiency levels. However, most
of smart-home and energy related automation sys-
tems focus on increasing user’s ease of access in con-
trolling or monitoring household appliances (Jensen
et al., 2018; Darby, 2018), but still, the choice of man-
aging the use of these appliances solely relies on the
environmental and economical awareness of the user.
Despite the fact that technology provides means
for efficient energy consumption, it is the user be-
havior that plays the most important role in form-
ing the household’s energy footprint (Gram-Hanssen,
2013). Hence, it is important to motivate users—
who are not committed and self-motivated—and to
increase the awareness about contemporary energy is-
sues and its dramatic repercussions. This is a key
factor for increasing individual energy efficiency and
consequently reducing the energy footprint of a com-
munity.
Considering the impact of motivating the user to
change their everyday energy consumption, we iden-
tify the need for information technology solutions
that address the problem of engaging users in adopt-
ing more sustainable energy usage tactics (Coutaz
et al., 2018). Everyday energy-related behavior is def-
initely driven by the user needs and desires. How-
ever the behavior is synthesized by many small ac-
tions, which are influenced by external factors, such
as outdoor temperature and humidity (e.g. turning air-
conditioning on when it is hot) and by the user’s com-
mon habits (e.g. switching the water heater on after
arriving home to take a bath). In tandem, user needs,
user conditions and user habits shape the user’s en-
ergy consumption profile.
30
Sardianos, C., Varlamis, I., Dimitrakopoulos, G., Anagnostopoulos, D., Alsalemi, A., Bensaali, F. and Amira, A.
“I Want to ... Change”: Micro-moment based Recommendations can Change Users’ Energy Habits.
DOI: 10.5220/0007673600300039
In Proceedings of the 8th International Conference on Smart Cities and Green ICT Systems (SMARTGREENS 2019), pages 30-39
ISBN: 978-989-758-373-5
Copyright
c
2019 by SCITEPRESS – Science and Technology Publications, Lda. All rights reserved

Recommender systems aim at providing data-
driven recommendations to users. In the case of
raising energy awareness and changing users’ en-
ergy habits, these systems can be used to recommend
energy-related actions to the users that could poten-
tially affect their consumption footprint. But first,
they must be able to identify users’ behavior (Zhou
and Yang, 2016) in order to provide recommendations
that match user profile and have a high potential of
being accepted. Such personalized recommendations
are also most likely to be adopted by the user in the
long term and gradually transform user behavior to-
wards energy efficiency.
As mentioned earlier, actions that relate to energy
consumption may differ among users depending on
their habits, but also can be affected by external con-
ditions (e.g. weather and season changes) or individ-
ual user needs, which both may change over time.
Considering the repetitive nature of user habits and
the temporal change in user needs and external con-
ditions, it is necessary that any predictions or rec-
ommendations about user near-future actions must
combine both types of information in order to im-
prove efficiency. In this direction, we examine user’s
daily activities in segments, which are called user
“micro-moments”, in adoption of the term introduced
by Google (Ramaswamy, 2015) for capturing the tem-
poral nature of smartphone usage for covering infor-
mation needs.
The proven success of micro-moments in infor-
mation search and retrieval (Snegirjova and Tuomisto,
2017) can be adopted by personalized assistants that
analyze contextual information from various sources
(e.g. GPS data, environmental information, user sta-
tus and mood, etc.), predict user needs and pro-
actively recommend pieces of information or activ-
ities to the user that maybe useful at that specific
moment (Campos et al., 2014) or place (Bao et al.,
2012). Based on this idea, this paper introduces the
concept of a recommender system that is based on
users’ micro-moments to provide action recommen-
dations that would help users eventually reshape their
habits towards a more energy efficient profile.
In section 2, we summarize the most important
works on micro-moments and micro-moment based
recommendations. In section 3 we begin with a mo-
tivating example and then provide an overview of the
proposed methodology. In section 4 we give the de-
tails of our proposed system architecture. Finally, sec-
tion 5 summarizes our progress so far and the next
steps of this work that are expected to lead to a rec-
ommender system that delivers the right recommen-
dation at the right moment.
2 RELATED WORK
The concept of mining useful knowledge from usage
logs has been discussed several times in the related
literature. Although the initial focus back in 2000
was in web browsing and web usage logs (Srivas-
tava et al., 2000), there are several recent works that
mine user activity logs, outside of the web browsing
environment, including geo-location logs (Sardianos
et al., 2018), app usage logs (Cao and Lin, 2017), bio-
signal logs (Alhamid et al., 2013), etc. The aim of
geo-location log mining works is to discover hidden
patterns in the user’s daily behavior and either high-
light interesting locations and travel sequences (Cao
et al., 2010) or create recommendations for Location-
Based Social Networks (Bao et al., 2015). Overall
log mining approaches, analyze the activity logs of
many users in order to detect the common context
in which certain activities are preferred among users.
Consequently, these patterns and the user’s personal
context-aware preferences are utilized in order to cre-
ate personalized and context-aware recommendations
(Yu et al., 2012).
The term “micro-moments” has been introduced
in the literature with the ‘Janus Factor’ theory for
determining marketing behavior (Stokes and Harris,
2012) and describe the moments where people are
positively positioned towards buying something pro-
moted by a campaign and moments where people are
skeptical and difficult to persuade. Google coined the
concept of micro-moments to the spontaneous inter-
action with smartphones in order to learn, discover,
carry out an activity, or buy a product online (Ra-
maswamy, 2015), but it soon has been expanded to
more fields, introducing new types of micro-moments
that span daily life and can be appropriate for the
tourism industry (e.g. I want to show (Jørgensen,
2017), I want to remember (Wang et al., 2012; Bilo
ˇ
s
et al., 2016)).
In order to transform users’ energy habits, it is im-
portant first to detect them by processing their activity
logs and then to provide the appropriate motivations
that will help them change. According to the “habit
loop” theory (Duhigg, 2013) a typical habitual behav-
ior goes through three stages: i) the cue, a trigger that
puts the brain to auto-pilot, ii) the routine that refers
to the actual action performed by the individual fol-
lowing the cue and iii) the reward, which is the sat-
isfaction induced from completing the routine and an
indicator to the potential to repeat the behavior. Re-
constructing a bad habit loop into a better one requires
detecting the cue, modifying the routine and demon-
strating the reward in order to strengthen the desired
habitual behavior.
“I Want to ... Change”: Micro-moment based Recommendations can Change Users’ Energy Habits
31

In this work, we define a new type of micro-
moment related to the behavioral change of users to-
wards energy efficiency, which we call the “I want
to change” moment. Such moments are used to de-
liver the correct recommendation to the user to as-
sist him/her to adopt a better behavior. In order
to gradually achieve this habitual behavior change
towards energy-efficiency, we must first detect the
micro-moments by analyzing user contextual logs, as-
sociate micro-moments with specific user activities
and recommend actions that can assist the user to re-
duce his/her energy footprint. In the following section
we give a motivating example and then describe the
proposed methodology.
3 METHODOLOGY
The motivation of this work is to define a framework
that seamlessly provides users with the means to im-
prove their energy consumption profile by exploiting
different types of real-time information (e.g. user’s
consumption, environmental conditions, etc.).
This could be better explained considering the fol-
lowing use case as an example described in Figure 1:
“John, our target end-user, usually switches on the
air-conditioning and the water heater to take a bath,
as soon as he gets back home after work. This hap-
pens around 6 o’clock in the afternoon, but the actual
start and the duration of this action varies, depending
on the traffic that he founds while returning home and
also the environmental conditions”.
The proposed recommendation framework ana-
lyzes historical information about the user’s daily
consumption and correspondingly extracts consump-
tion habits. The habits result from a generalization of
user activities in time and external conditions. In our
example, the user habit concerning water heater will
be as follows: “the water heater is switched on be-
tween 4 and 7 o’clock in the afternoon during week-
days, for 15 minutes during hot periods and for 30
minutes during cold seasons. However, in some cases,
John forgets to switch them off in time, resulting in
large cumulative expenses over the year”.
In the example above, the definition of hot and
cold seasons is user-dependent but definitely links to
the actual weather conditions. The same holds for the
exact time when the on and off activities happen (i.e.
if it is at 6:00 pm or at 6:05 pm, if it is after 15 or
20 minutes, etc.). Based on the actual weather con-
ditions, the actual user status (e.g. user is already at
home, or user is still driving back home, or user is
away from home) a recommendation for a repetitive
action that has been properly positioned within the
John
Air conditioning ON !
around 6 pm
Water heater ON at !
between 4-7 pm
When back home from work
Depending on weather conditions
Issue: forgets to switch off
appliances
Figure 1: John’s Use Case.
user daily schedule and has been smartly shifted a few
minutes earlier or later in order to save energy, will be
more than welcome for the user. Such a recommen-
dation will increase the user trust to the recommender
system and will assist him to not only to benefit in
cost of consumption but also to boost the household’s
sustainability footprint.
As described in the previous example and moti-
vated by behavior change literature (Duhigg, 2013),
the aim of the proposed framework is not to com-
pletely and abruptly alter users’ energy consump-
tion behavior, but rather to incorporate small, gradual
changes into users’ daily time-lines and assist them to
perform minor but influencing actions towards energy
efficiency.
The proposed methodology for creating energy ef-
ficient recommendations is based on a three-step ap-
proach as depicted in Figure 2. The first step of the
process refers to the consumption data acquisition and
analysis. Based on the analysis of the user’s consump-
tion data along with environmental conditions we per-
form an initial step of analysis to extract meaning-
ful insights. So we process the Consumption Logs
and Weather Logs to highlight the user’s consump-
tion actions in terms of micro-moments and extract
the context of user activities (i.e. when the user tends
to switch on and off a specific device). Being able
to identify user’s energy demands on the spot, in the
third step of our approach we can predict user’s next
energy consumption activities (i.e. in 10 minutes the
user will switch on the air-conditioning), which en-
ables our recommender system to recommend energy-
related actions to the user beforehand, so as to lead
his energy profile in higher levels of efficiency. In the
sections that follow we expound each step of the pro-
cess.
3.1 Data Acquisition and Analysis
In order to collect the user’s consumption data we rely
on WiFi-enabled smart plugs/outlets equipped in the
SMARTGREENS 2019 - 8th International Conference on Smart Cities and Green ICT Systems
32
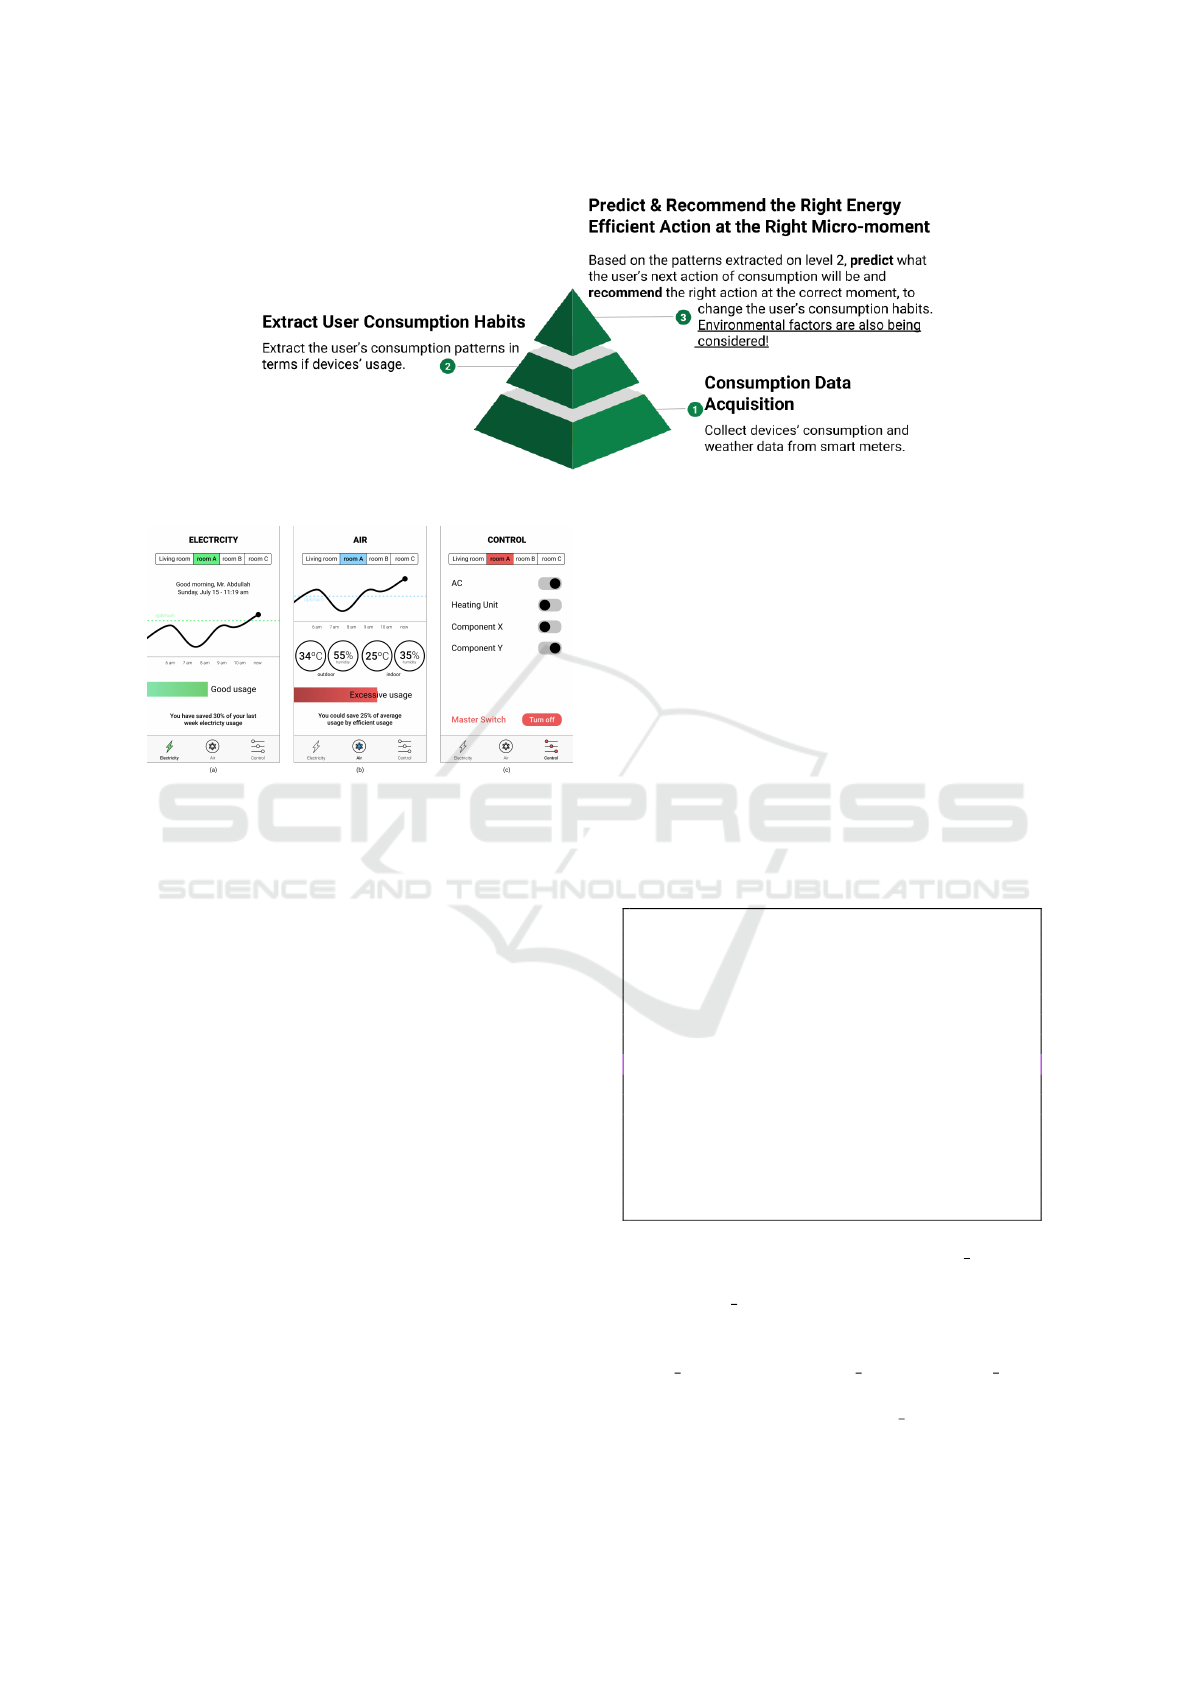
Figure 2: Steps for data analysis and creating energy consumption-related recommendations.
Figure 3: (EM)
3
Energy Tracking Application.
most frequently used appliances (e.g. Sonoff Pow R2)
(ITEAD Intelligent Systems, 2016). These smart out-
lets provide information about the energy consump-
tion of each device, which we collect in a minute win-
dow. More specifically, all user’s devices that con-
sume big loads of energy are plugged in a smart plug
that measures the consumption in KWh in real time.
These measurements are logged in a JavaScript Ob-
ject Notation (JSON) formatted file (hereafter called
Consumption Logs for convenience) and stored in
a CouchDB no-SQL database (hereafter referred to
as the backend)(The Apache Software Foundation,
2018).
In addition, a variety of sensing modules are also
installed in the user’s household to record contextual
information (e.g. temperature, humidity, and occu-
pancy). Hence, a second JSON file (hereafter called
Weather Logs) that contains the environmental con-
ditions inside and outside the house is recorded on
hourly basis. These two files form the starting input
data of the processing pipeline.
This way the system collects and analyses user’s
consumption data and weather parameters and pro-
vide useful analytics to the user. Information is pre-
sented to the user in the EM
3
Energy Tracking Ap-
plication which we have developed and is shown in
Figure 3.
Sensor and smart-plug data are sent to the backend
of our framework and stored in the respective log files.
The backend also stores user metadata, concerning
general information about the user such as full-name
and address along with the GPS coordinates, the state
and the category of each appliance (e.g. computer,
charger, general), like shown in Listing 1.
The user metadata section in the consumption log
file, is followed by a section denoted as “rooms”. As
depicted in Listing 2, this section aggregates the con-
sumption observations made from the pre-installed
smart plugs of the household. This block in partic-
ular contains the actual consumption measurements
recorded from the smart-plugs installed in each room.
Listing 1: Meta-data block in the Consumption Logs file.
// Consumption-Logs.json
{ "_id": "data_user_alpha",
"meta": { "date":"31/10/2018",
"timezone":"GMT+3",
"user_info": { "id": "data_user1",
"name": "James Borg",
"Address": "Coliseum Way,
Oakland"
}, "appliance_info": {
"app_1": { "longitude": 24.3534,
"latitude": 23.22222,
"state": true,
"category": "computer"
}, ... } } ...
}
Each room is identified in the “room info” tag
with an ID and a description (referred as name) and a
block “energy data” that contains the total consump-
tion of the house in a minute frame for each day.
Following, there are two main block tags referred to
as “air
data” and “appliance data”. The “air data”
block contains the consumption values for heating
and cooling, while the “appliance data” block con-
tains the consumption measured for each appliance
“I Want to ... Change”: Micro-moment based Recommendations can Change Users’ Energy Habits
33
(“app 1”, etc.), all reported in a minute window.
Listing 2: Consumption data block for each room and ap-
pliance in the Consumption Logs file.
// Consumption-Logs.json
{ ... "rooms": {
"room1": {
"room_info": { "id": "room1",
"name": "Adam’s bedroom"},
"energy_data": { ...},
"air_data": { "heating": {...},
"cooling": {...} },
"appliance_data": {
"app_1":{...}, ... }
}...
} ...
}
The Weather Log file contains information regard-
ing the weather conditions that are gathered by the
various sensors installed inside and outside the house.
In particular, the file is organized into two different
block tags, one for the “outdoor air quality” and one
for the “rooms” as shown in Listing 3. These two
blocks contain respectively the measurements con-
cerning both the outdoor temperature and humidity as
well as the indoor temperature and humidity per room
per minute.
Listing 3: Format of the Weather Logs file.
//Weather-Logs.json
{ "outdoor_air_quality": {
"outdoor_temperature":{ "00:00": 34,
"00:10": 34.1, ...},
"outdoor_humidity":{ "00:00": 0.4,
"00:10": 0.401, ...}
},
"rooms": {
"room1": {
"indoor_temperature":{ "00:00":
34,
"00:10": 34.1, ...},
"indoor_humidity":{ "00:00": 0.4,
"00:10": 0.401, ...}
}
}
}
3.2 Data Transformation
Data collection is the first step of the process, but in
order to exploit the above types of information we
need to perform an initial step of analysis that will
produce meaningful insights to be used in the next
steps of our pipeline. So, we process the Consump-
tion Logs and perform a first level of abstraction that
will highlight the user’s consumption actions in terms
of micro-moments. Then we process the Weather
Logs in order to extract the context of user activities.
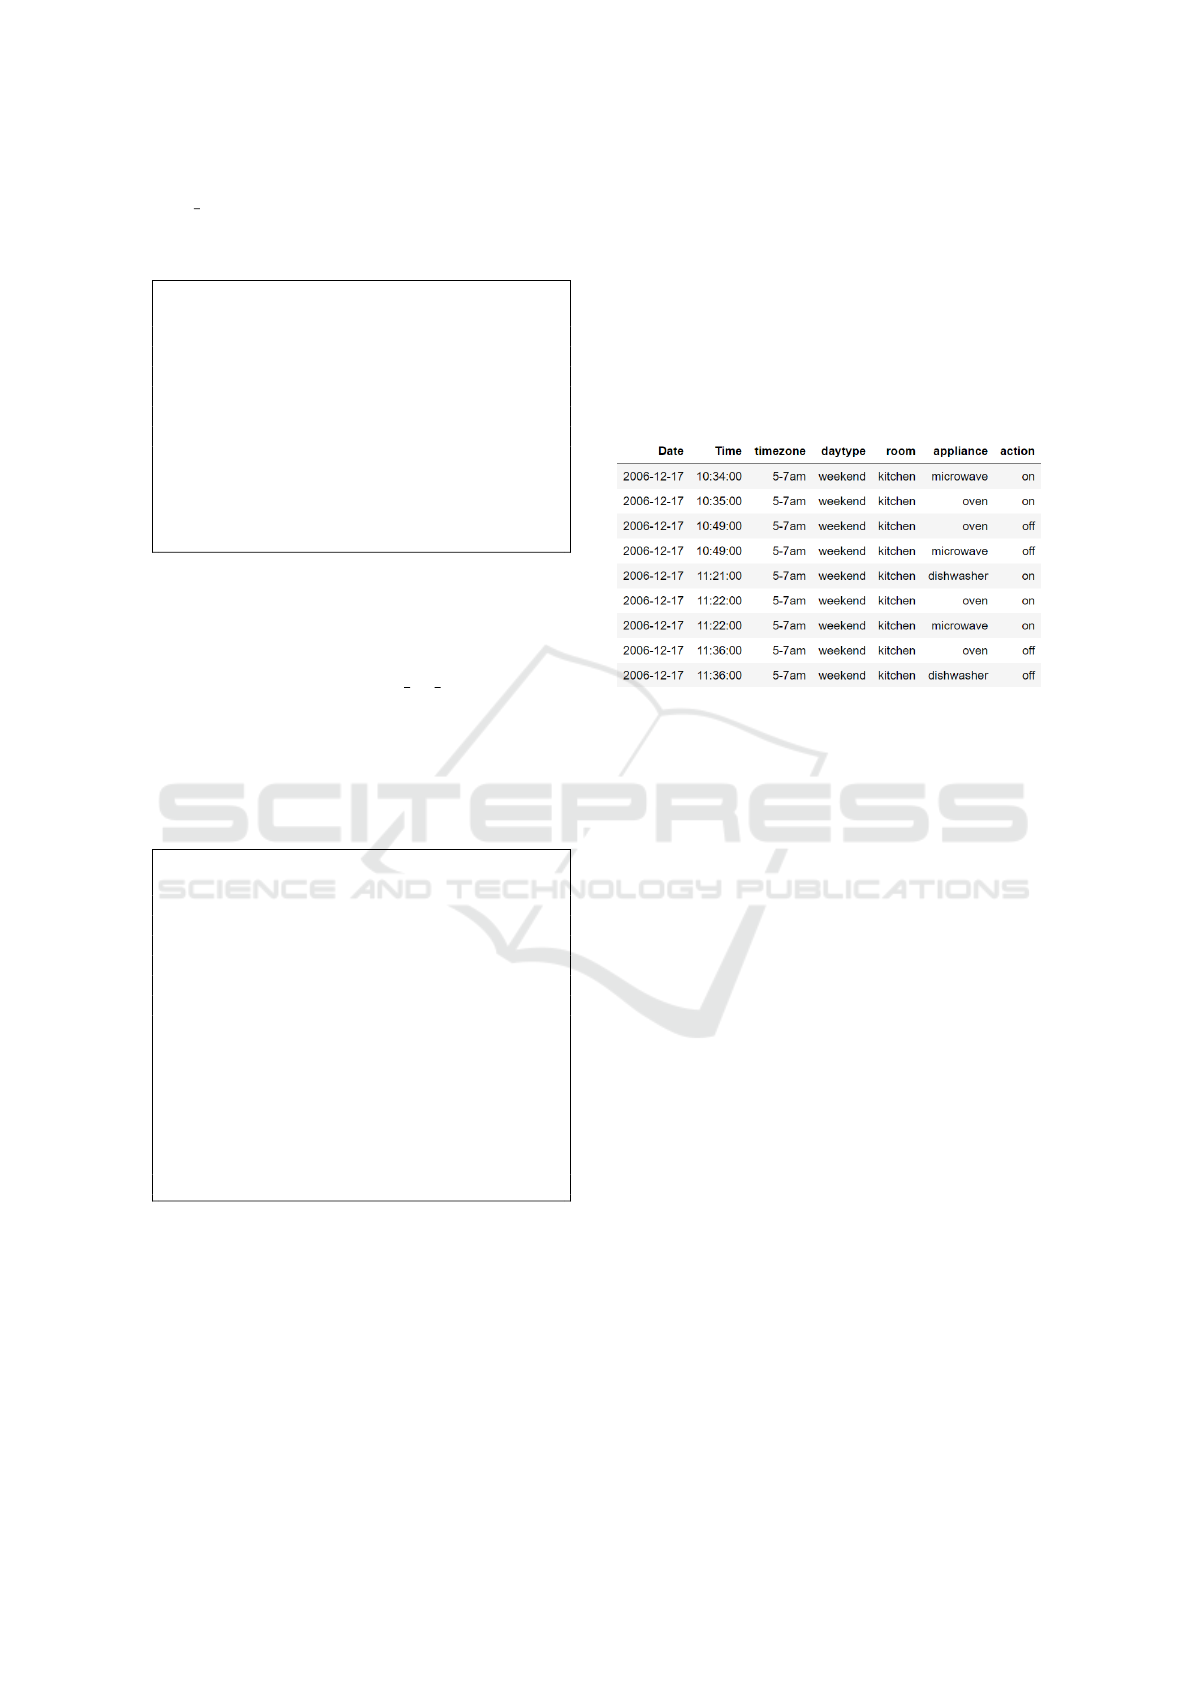
The processing of the consumption log file will
determine whether and when a device is turned on or
off with ample accuracy. Subsequently it allows the
extraction of the user’s actions along with the moment
that they took place in terms of micro-moments (e.g.
at 10:34:00 AM (GMT) user turned on the microwave
and at 11:21:00 AM (GMT) turned on the dishwasher)
as shown in Figure 4.
Figure 4: Micro-moments extracted after the analysis and
abstraction of a Consumption Log file.
Micro-moments, as shown in Figure 4, are de-
rived from the Consumption Logs file as a combina-
tion of a specific action at a specific moment. This
is abstracted after combining and analyzing user’s
consumption and sensor data and classifying these
records per device into actions such as “turn-on-
light”, “turn-off-ac”, etc. that correspond to the user’s
energy related micro-moments. We can either assume
that the user action information is directly recorded by
a smart-plug system, or we can follow an action de-
tection methodology from the time-series data, which
will be briefly explained in the experiments section of
this work (see subsection 4.2).
The transition from the measurements collected
for each sensor every minute to abstracted activities
and conditions involves the process of transforming
data from one type to another or creating new data
from the existing ones. For example, the values for
the temperature or humidity had to be transformed
from numerical data to categorical (i.e. high, low,
medium), whereas based on the temperature differ-
ence between two consecutive time-stamps we could
create a label for the temperature change such as
“temperature has dropped/increased quickly/slowly”
to characterize the temperature changes for differ-
ent time intervals. Furthermore, comparing the tem-
perature recorded at each time interval from the in-
door and outdoor sensors we can abstract informa-
tion whether the indoor/outdoor temperature/humid-
ity difference is big/small, or even in a higher time
SMARTGREENS 2019 - 8th International Conference on Smart Cities and Green ICT Systems
34
abstraction level identify the difference of tempera-
ture/humidity in the morning/afternoon or even week-
days/weekends. The output of this process is the basis
for extracting contextual information behind user ac-
tions.
3.3 Extract Context-related
Consumption Habits
The result of the Weather Logs processing will be
used to identify weather changes, or weather condi-
tions, which can then be associated with the users’
choice for energy consumption. Examples are sharp
increase/decrease of the temperature, sudden rains,
significant rise of humidity levels, etc. that are fre-
quently associated with the user’s action of switching
on the air-conditioning.
The analysis of the user’s energy consumption
data and weather conditions’ contextual data as well
as the association of user´s actions with abstractions
of contextual conditions is followed by the extraction
of user’s “consumption habits”. This task refers to the
process of identifying frequent consumption patterns
(or device usage patterns) in the consumption micro-
moments and associating them with weather condi-
tions and other temporal parameters (e.g. time of day,
day of the week etc.).
In this step an Association Rule Mining algorithm
is employed in order to jointly process user’s micro-
moments data (consumption and weather conditions)
and find frequent itemsets (condition sets) that are as-
sociated with an action in the micro-moments file.
3.4 Recommend User Actions based on
Micro-moments
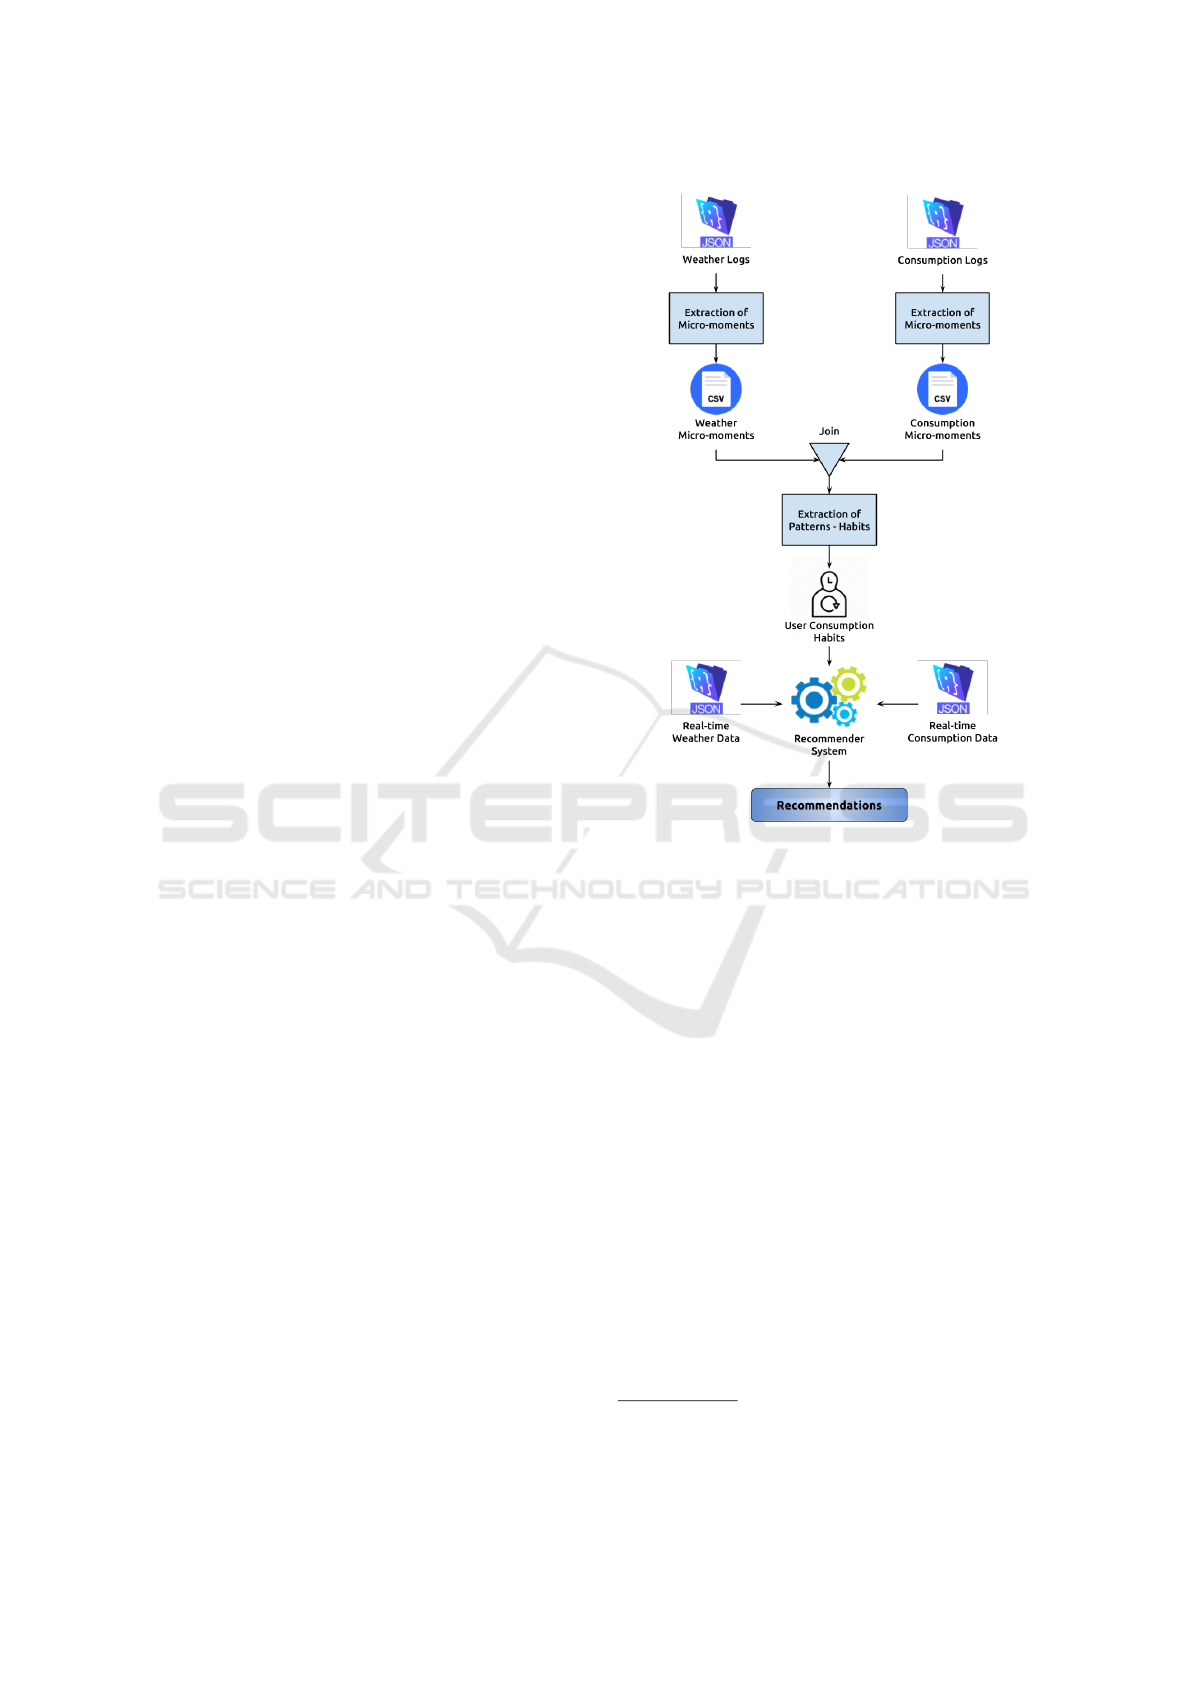
In the final step of the process, which is summarized
in Figure 5, real-time data and current environmental
conditions are evaluated against frequent associations
found in the previous step.
A rule evaluation process is used to detect whether
the current context matches any of the frequently oc-
curring energy consumption activities for the user
(e.g. the user is back home after work and the in-
door temperature is low). Then the recommendation
algorithm suggests to the user to perform the action
that is associated with this context (e.g. to turn on
the heater). However, in order to change the user rou-
tine, the system also recommends an energy saving
modification to the user, which fits in the current con-
text (e.g. to switch off the heater the earliest possible,
based on user’s previously recorded habits).
Figure 5: Process of analyzing consumption files and
weather data to create energy action recommendations.
Since the task of extracting frequent occurring
energy consumption actions is of great importance
for the analysis process, it is appropriate to provide
some basic information on the algorithm that was
used for the association rule mining. The Apriori
association rule extraction algorithm (Agrawal et al.,
1994) is used to uncover how items are associated to
each other by locating frequently co-occurring items
among the users’ transactions.
The typical example for describing association
rule discovery algorithms is with the analysis of user
shopping carts in an online shop. Let I = {i
1
, i
2
, ..., i
n
}
be all the possible itmes that can be found in a cart and
D = {t
1
, t
2
, ..., t
n
} be the set of all transactions (shop-
ping carts) in the shop’s database. Each transaction in
D contains a subset of the items in I. If X, ϒ ⊆ I and
∩ =
/
0, then the rule X → ϒ implies the co-occurrence
of X and ϒ, meaning that if item X is bought, then
item ϒ will also be bought together. By definition
1
“the sets of items (for short itemsets) X and Y are
called antecedent (left-hand-side or LHS) and con-
1
http://software.ucv.ro/
∼
cmihaescu/ro/teaching/AIR/
docs/Lab8-Apriori.pdf
“I Want to ... Change”: Micro-moment based Recommendations can Change Users’ Energy Habits
35
sequent (right-hand-side or RHS) of the rule respec-
tively.”
In the energy recommendations scenario the ap-
pliance, the space, time and other conditions are the
items, that can be found in the LHS part of an associ-
ation rule and user actions (i.e. switch the appliance
on or off) are the consequent (RHS of the rule.).
4 EXPERIMENTAL EVALUATION
4.1 Dataset
It is fundamental for the experimental evaluation of
the proposed framework to check whether the trans-
formation and analysis of the consumption data is ap-
propriate for extracting the user’s consumption habits,
which are consequently fed to the recommender sys-
tem for creating recommendations based on actual
user conditions. For this, we decided to use an online
dataset provided by the University of California Irvine
through its machine learning dataset repository. The
dataset
2
concerns the monitoring of individual house-
hold electric power consumption. It is a multivari-
ate time-series dataset with 2,075,259 measurements
gathered in a house located in Sceaux (7km of Paris,
France) between December 2006 and November 2010
(a time period of 47 months). The dataset con-
tains information about the household global minute-
averaged active power (in kilowatt), household global
minute-averaged reactive power (in kilowatt) and
minute-averaged voltage (in volt). The measurements
concern the energy metering (in watt-hour of active
energy) of three rooms of the household, the kitchen
(which contains mainly a dishwasher, an oven and
a microwave), the laundry room (which contains a
washing-machine, a tumble-drier, a refrigerator and a
light) and a set of energy consuming devices which
correspond to an electric water-heater and an air-
conditioner.
4.2 Preprocessing
In order to abstract from the original measurements
data file to the user activity file as depicted in Figure
4, we followed a time-series analysis methodology
on the consumption information data of each room.
More specifically, from the actual energy consump-
tion recorded per minute, we computed the changes
between consecutive minutes and between consecu-
tive 5-minutes periods. The first feature allowed us
2
https://archive.ics.uci.edu/ml/datasets/individual+
household+electric+power+consumption
to isolate minutes where the power consumption in-
creased or decreased significantly due to powering
on or off one or more devices. By applying a k-
Means clustering on the different power change val-
ues recorded for a room, we obtained a number of
clusters of power change values that we mapped to
specific actions of operating multiple devices.
Algorithm 1: Characterize device operation action as on or
off.
Require: Series of consumption data of each room
recorded per minute.
CurrentMinute = 0
loop
Detect significant power consumption changes.
if CurrentMinute = 5 then
Detect significant power consumption
changes in 5minutes periods.
CurrentMinute = 0
end if
CurrentMinute ← CurrentMinute + 1
end loop
Apply k-means algo on the power change values.
Find clusters of power change values.
Find the limit values between power changes.
Map changes to actions of operating devices.
In order to map power changes to user actions we
assumed that each device has a typical consumption
specification. For this purpose, we adopted the values
provided by the ‘energy calculator’ website
3
as de-
picted in Table 1, which summarizes the devices mon-
itored in each room and an estimation of their power
consumption.
Table 1: An estimated consumption for the devices in the
dataset.
Room Device Power (in W)
kitchen oven 2400
kitchen dishwasher 1800
kitchen microwave 1200
laundry room clothes washer 500
laundry room clothes dryer 3000
laundry room refrigerator 180
laundry room light 60
central water-heater 4000
central air-conditioner 3500
Based on the consumption values of each device,
and the devices per room, we map power changes to
user actions. For example, the cluster with the largest
3
https://www.energyusecalculator.com/calculate
electrical usage.htm
SMARTGREENS 2019 - 8th International Conference on Smart Cities and Green ICT Systems
36
power consumption changes was mapped to the ac-
tivity of switching on all the appliances in the room,
the one with the second largest changes that switches
on all but one device (that with the lowest power),
and so on. Applying the same methodology to the 5-
minute changes allowed us to detect power-off actions
for devices that go to a low power consumption mode
before switching off (e.g. a dishwasher).
Since the energy consumption monitoring system
is not yet fully deployed and operating, it is not pos-
sible to validate the performance of the user action
detection method from the publicly available dataset.
However, in the full system deployment, smart plugs
and smart switches will be places on some rooms and
this will allow to validate the method with actual data.
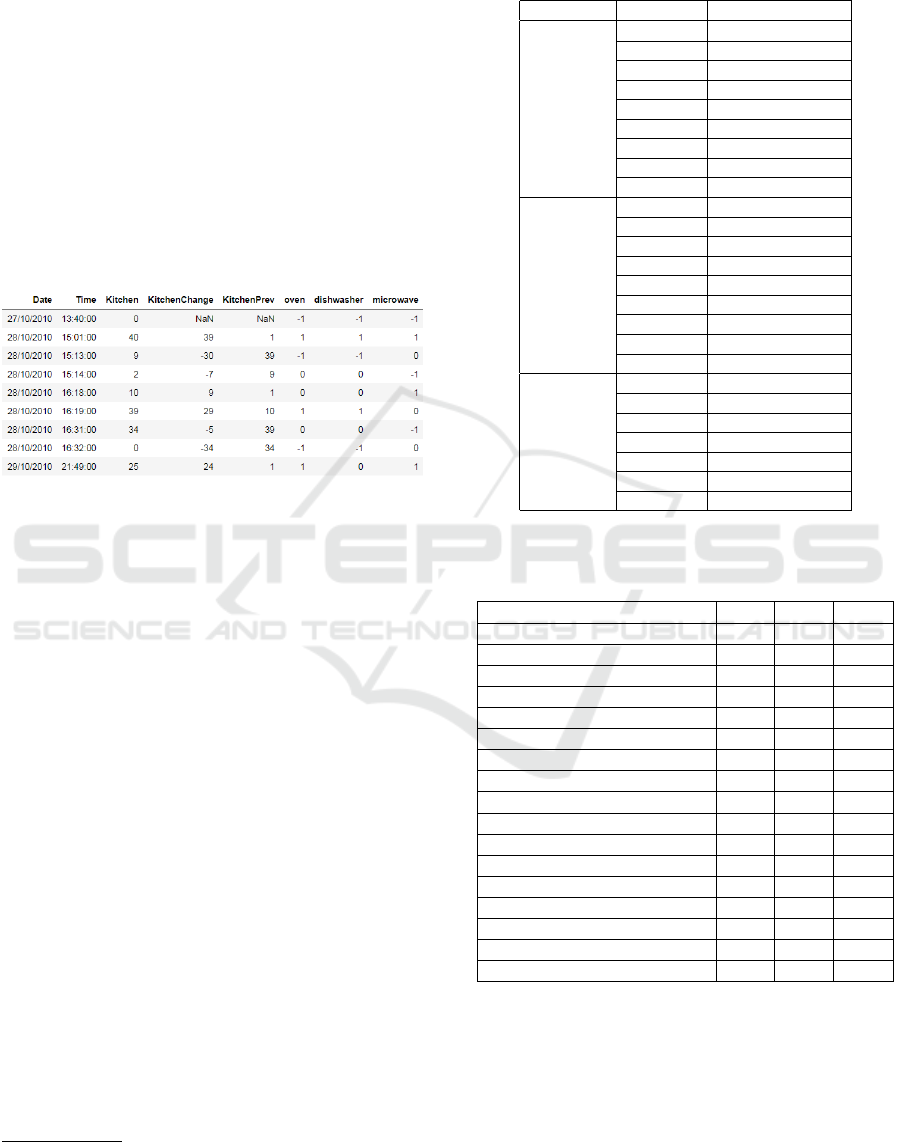
Figure 6: The output of the power consumption log file pro-
cessing for a single room.
This methodology resulted in series of switch on
and off actions for each device (see Figure 6). A sec-
ond processing of the resulting file was necessary to
correct any mistakes, such as detection of two or more
consecutive switch-on or switch-off activities. The
methodology, allowed us to detect user activities on
a group of devices, by simply monitoring the collec-
tive consumption of all devices. The complete evalu-
ation of this methodology is ahead of the scope of this
paper, since in our final setup, we assume that smart
plugs will log all user activities on the devices.
4.3 User Habit Extraction
The next step was to merge the user activity data for
all rooms and generate the abstracted user activity file,
which allows us to detect frequent user habits. In this
step, we process the user activity data file and ab-
stract the timezone and day of the week information
for each activity. More specifically, we map each ac-
tivity to the two-hours time-slot that it occurred (e.g.
1-3 am, 3-5 pm, etc.). The result of this abstraction
are similar to those depicted in Figure 4.
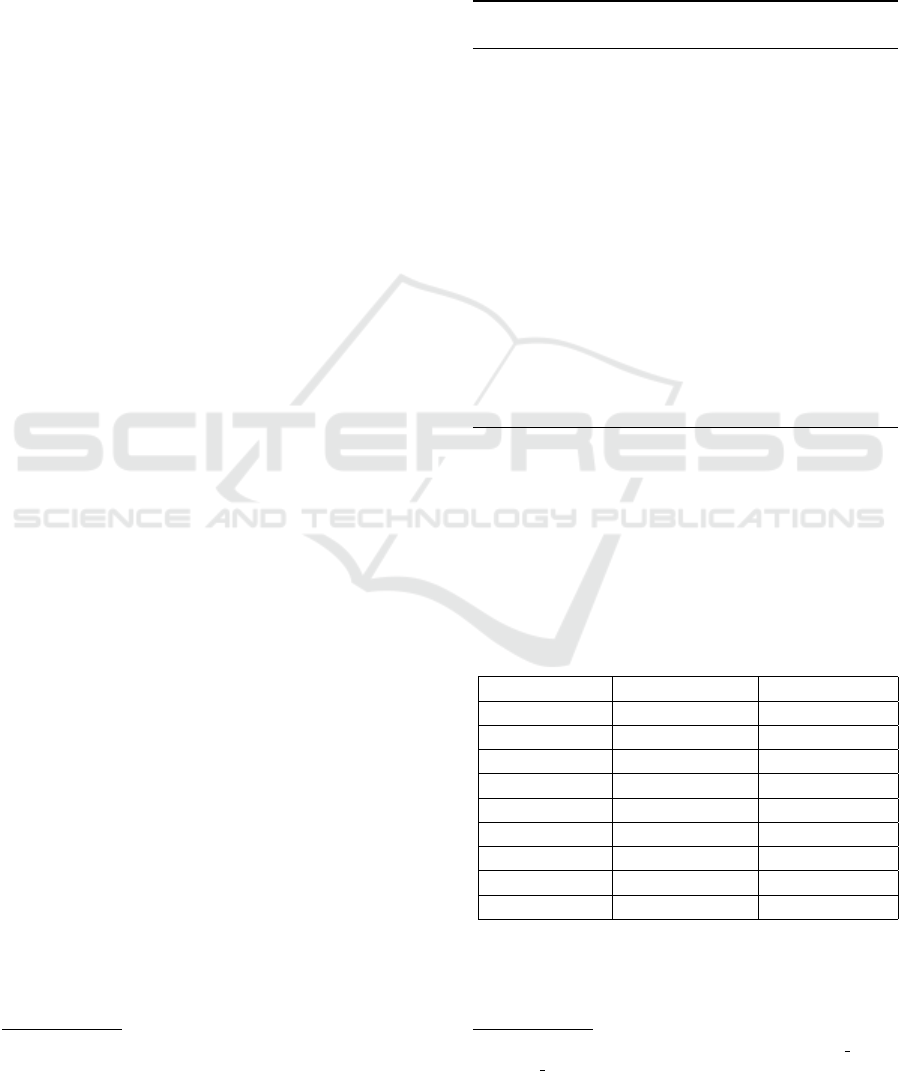
Table 2 provides information about the 29,255
on/off actions
4
that have been recorded in the 47
4
Each on action is followed by an off action, so values
in the table count pairs of on/off actions
Table 2: The distribution of user on/off actions (that occur
more than 4 times per month in average) to the 3 devices
located in the kitchen.
Appliance Timezone Times per month
oven
7-9 am 5.96
9-11 am 9.2
11-1 pm 16.84
1-3 pm 12.71
3-5 pm 10.83
5-7 pm 11.22
7-9 pm 32.21
9-11 pm 19.6
11-1 am 5.33
microwave
7-9 am 6.0
9-11 am 9.61
11-1 pm 17.79
1-3 pm 12.67
3-5 pm 10.81
5-7 pm 11.9
7-9 pm 33.13
9-11 pm 19.07
11-1 am 4.64
dishwasher
9-11 am 4.09
11-1 pm 8.62
1-3 pm 5.87
3-5 pm 4.99
5-7 pm 4.78
7-9 pm 14.15
9-11 pm 8.26
Table 3: The association rules extracted for the kitchen de-
vices that have a support bigger that 0.02 (happen more than
12 times per month).
LHS RHS Conf Supp
7-9 pm, microwave, weekday on 0.51 0.04
7-9 pm, oven, weekday on 0.51 0.03
7-9 pm, microwave, weekday off 0.49 0.03
7-9 pm, oven, weekday off 0.49 0.03
9-11 pm, oven, weekday off 0.51 0.02
9-11 pm, microwave, weekday off 0.51 0.02
9-11 pm, oven, weekday on 0.49 0.02
9-11 pm, microwave, weekday on 0.49 0.02
7-9 pm, microwave, weekend off 0.5 0.02
7-9 pm, microwave, weekend on 0.5 0.02
11-1 pm, microwave, weekend on 0.5 0.02
11-1 pm, microwave, weekend off 0.5 0.02
7-9 pm, oven, weekend off 0.5 0.02
7-9 pm, oven, weekend on 0.5 0.02
11-1 pm, oven, weekend on 0.5 0.02
11-1 pm, oven, weekend off 0.5 0.02
7-9 pm, dishwasher, weekday on 0.51 0.02
months period for the three devices of the kitchen
(i.e. oven, dishwasher and microwave) and the var-
ious time-zones they have occurred.
The above information is used as input to the Apri-
ori association rule extraction algorithm (Agrawal
et al., 1994). Table 3 presents the top rules extracted
from the dataset that have an ‘on’ or ‘off’ action at
the right hand side, an appliance and an associated
“I Want to ... Change”: Micro-moment based Recommendations can Change Users’ Energy Habits
37

day and timezone at the left hand side, listed in de-
creasing support order. The frequent actions of Table
2 and the association rules of 3 are used as decision
rules for generating recommendations. For example,
it is evident from the results of Table 2 that the user
utilizes the dishwasher during the day and mostly af-
ter dinner. A recommendation for this user would be
to postpone the operation of the dishwasher after mid-
night to take advantage of lower priced power. Sim-
ilarly, the fact that the user turns on and off the oven
on weekdays between 7 and 9 pm makes this time slot
ideal for generating micro-moment based recommen-
dations that will help the user to reduce the oven usage
or replace it with the microwave.
In addition to this, when the current user status
and the actual environmental conditions match a user
micro-moment, the exact details of the pattern can be
extracted from the usage logs and used to provide bet-
ter recommendations. For example, when the user
turns on the A/C and the action matches a user micro-
moment, the system will recommend to the user to
switch it off earlier than usual, or put it on power sav-
ing mode, in order to reduce energy consumption.
4.4 Micro-moments Recommendation
Evaluation
Using the activity data file as input and a frequent pat-
tern extraction algorithm it is possible to extract user
micro-moments and consequently to use these micro-
moments to address recommendations to users. In or-
der to evaluate the coverage of the generated micro-
moment recommendations, we split the activity data
set and use the first 80% of the monitoring period for
learning user habits and the remaining 20% of the data
(last 9.5 months) for evaluating whether a user action
matches a user micro-moment.
More than 23,000 user actions on the kitchen
appliances have been used for learning user micro-
moments, which resulted in 17 micro-moments, all
in the evening zone (7 pm - 1 am). These micro-
moments match 36.3% of the remaining 5,851 user
actions used for validation and partially matches
5
46.3% of the actions.
5
This means that the left hand side of the rule matches
the time zone and the appliance and does not match week-
day or weekend condition.
5 CONCLUSIONS AND NEXT
STEPS
Addressing the problem of engaging users in adopt-
ing more sustainable energy usage tactics, we iden-
tify that the users’ everyday energy-related behavior
is driven by their needs and desires. However their
behavior depends on repetitive small actions that are
called micro-moments and are influenced by factors,
such as outdoor weather conditions and the user’s
common energy consumption habits.
Current results show that these micro-moments
can be useful for transforming users’ energy pro-
file towards efficiency. This article proposed a
framework for analyzing user consumption data to
identify user consumption habits, extract the micro-
moments that are related to power consumption and
use these micro-moments to provide recommenda-
tions that could help the user on improving his energy
consumption footprint.
We are currently in the process of deploying an
architecture with smart-plugs and switches, aiming to
solve many of the issues of this study (e.g. the detec-
tion of user activities from aggregated consumption
data) and the main goal of our future work focuses on
prototyping the recommendation system and its eval-
uation in a actual case study, which will verify the
usability of the proposed framework.
ACKNOWLEDGEMENTS
This paper was made possible by National Priori-
ties Research Program (NPRP) grant No. 10-0130-
170288 from the Qatar National Research Fund (a
member of Qatar Foundation). The statements made
herein are solely the responsibility of the authors.
REFERENCES
Agrawal, R., Srikant, R., et al. (1994). Fast algorithms for
mining association rules. In Proc. 20th int. conf. very
large data bases, VLDB, volume 1215, pages 487–
499.
Alhamid, M. F., Rawashdeh, M., Al Osman, H., and El Sad-
dik, A. (2013). Leveraging biosignal and collabora-
tive filtering for context-aware recommendation. In
Proceedings of the 1st ACM international workshop
on Multimedia indexing and information retrieval for
healthcare, pages 41–48. ACM.
Bao, J., Zheng, Y., and Mokbel, M. F. (2012). Location-
based and preference-aware recommendation using
sparse geo-social networking data. In Proceedings of
SMARTGREENS 2019 - 8th International Conference on Smart Cities and Green ICT Systems
38

the 20th international conference on advances in geo-
graphic information systems, pages 199–208. ACM.
Bao, J., Zheng, Y., Wilkie, D., and Mokbel, M. (2015).
Recommendations in location-based social networks:
a survey. Geoinformatica, 19(3):525–565.
Bilo
ˇ
s, A., Turkalj, D., and Keli
´
c, I. (2016). Micro-moments
of user experience: An approach to understanding on-
line user intentions and begavior. Challenges of big
data technology, page 67.
Campos, P. G., D
´
ıez, F., and Cantador, I. (2014). Time-
aware recommender systems: a comprehensive survey
and analysis of existing evaluation protocols. User
Modeling and User-Adapted Interaction, 24(1-2):67–
119.
Cao, H. and Lin, M. (2017). Mining smartphone data for
app usage prediction and recommendations: A survey.
Pervasive and Mobile Computing, 37:1–22.
Cao, X., Cong, G., and Jensen, C. S. (2010). Mining signif-
icant semantic locations from gps data. Proceedings
of the VLDB Endowment, 3(1-2):1009–1020.
Coutaz, J., Carlesso, A., Bonnefond, N., Balzarini, R., Lau-
rillau, Y., Mandran, N., and Crowley, J. L. (2018).
“will the last one out, please turn off the lights”:
Promoting energy awareness in public areas of office
buildings. In European Conference on Ambient Intel-
ligence, pages 20–36. Springer.
Darby, S. J. (2018). Smart technology in the home: time
for more clarity. Building Research & Information,
46(1):140–147.
Duhigg, C. (2013). The Power of Habit: Why we do what
we do and how to change. Random House.
Gram-Hanssen, K. (2013). Efficient technologies or user
behaviour, which is the more important when reducing
households’ energy consumption? Energy Efficiency,
6(3):447–457.
Hu, S., Yan, D., Guo, S., Cui, Y., and Dong, B. (2017). A
survey on energy consumption and energy usage be-
havior of households and residential building in urban
china. Energy and Buildings, 148:366–378.
ITEAD Intelligent Systems (2016). Sonoff Pow R2.
Jensen, R. H., Strengers, Y., Kjeldskov, J., Nicholls, L., and
Skov, M. B. (2018). Designing the desirable smart
home: A study of household experiences and energy
consumption impacts. In Proceedings of the 2018 CHI
Conference on Human Factors in Computing Systems,
page 4. ACM.
Jørgensen, L. (2017). I want to show-how user-centered
design methods can assist when preparing for micro
moments. Master’s thesis, NTNU.
Ramaswamy, S. (2015). How micro-moments are changing
the rules. Think with Google.
Sardianos, C., Varlamis, I., and Bouras, G. (2018). Extract-
ing user habits from google maps history logs. In 2018
IEEE/ACM International Conference on Advances in
Social Networks Analysis and Mining (ASONAM),
pages 690–697. IEEE.
Snegirjova, M. and Tuomisto, F. (2017). Micro-moments:
new context in information system success theory.
Master’s thesis.
Srivastava, J., Cooley, R., Deshpande, M., and Tan, P.-N.
(2000). Web usage mining: Discovery and applica-
tions of usage patterns from web data. Acm Sigkdd
Explorations Newsletter, 1(2):12–23.
Stokes, P. and Harris, P. (2012). Micro-moments,
choice and responsibility in sustainable organiza-
tional change and transformation: the Janus dialec-
tic. Journal of Organizational Change Management,
25(4):595–611.
The Apache Software Foundation (2018). Apache
CouchDB.
Wang, D., Park, S., and Fesenmaier, D. R. (2012). The role
of smartphones in mediating the touristic experience.
Journal of Travel Research, 51(4):371–387.
Yu, K., Zhang, B., Zhu, H., Cao, H., and Tian, J. (2012).
Towards personalized context-aware recommendation
by mining context logs through topic models. In
Pacific-Asia Conference on Knowledge Discovery and
Data Mining, pages 431–443. Springer.
Zhou, K. and Yang, S. (2016). Understanding household
energy consumption behavior: The contribution of en-
ergy big data analytics. Renewable and Sustainable
Energy Reviews, 56:810–819.
“I Want to ... Change”: Micro-moment based Recommendations can Change Users’ Energy Habits
39
