
No More Hiding! WALDO: Easily Locating with a Wi-Fi Opportunistic
Approach
Bol
´
ıvar Silva
1
, Jo
˜
ao Carlos Lima
1
, Celio Trois
1
, William Pereira
1
and Cristiano da Rocha
2
1
Universidade Federal de Santa Maria, Av. Roraima n
o
1000, Santa Maria, Rio Grande do Sul, Brazil
2
Penguin Formula, Lisbon, Portugal
Keywords:
Indoor Positioning, Opportunistic Wi-Fi Sensing, Object Detection, Pervasive Computing, Location based
Service.
Abstract:
The popularization of mobile devices and increasing the number of sensors and embedded resources boosted
a large amount of research in the area of context-aware. Among the most relevant contextual information
is the location. In outdoor environments, the GPS technology is already widespread and used. However, the
people tend to spend most of their time indoors, such as universities, hospitals, malls, and supermarkets, where
the GPS location is compromised. Several approaches using mainly radio frequency technologies have been
proposed to solve the problem of indoor location. So far, no widely accepted solution solves the problem of
location indoors. In this way, this work to use an opportunistic approach, making use of the Wi-Fi infras-
tructure available in the environment, to provide the location of mobile stations. Based on this objective, the
WALDO architecture was developed that unites the characteristics of different approaches of the works that
have been produced in recent years, taking into account the techniques that present better results at each stage,
in conjunction with a zone-based approach and ranking, on phase online of the fingerprint technique, which
makes ignoring RSS readings that present noises.
1 INTRODUCTION
Nowadays, it is quite common to find mobile devices
with several sensors, which collect information from
the environment in which the device is inserted, aim-
ing to offer greater convenience and improve the user
experience, presenting information and useful ser-
vices, such as showing the user the nearby restaurants
or suggest the best route to reach the desired destina-
tion. In this sense, location information is a funda-
mental parameter. A large part of these technologies
are targeted for indoor use, such as visitor orientation
at malls (Oosterlinck et al., 2017), airports (Ahmed
et al., 2016), real-time monitoring of patient location
in hospitals (Kanan and Elhassan, 2016), identifica-
tion of crowd concentration (Fukuzaki et al., 2015),
among others.
Although GPS (Global Positioning System) tech-
nology is quite widespread for outdoor environments
(Yang et al., 2013), due to signal interference, it often
does not provide satisfactory accuracy indoors (Paul
and Wan, 2009) (Rai et al., 2012). To mitigate this
demand is necessary to use a source of information
more suitable for this type of environment. In this
sense, several technologies have been used as a source
of information to perform the mapping of the environ-
ment. Mostly technologies that emit radio frequency
signals, such as Wi-Fi (Wireless Fidelity), Bluetooth
(Oosterlinck et al., 2017), RFID (Radio Frequency
Identification) (Ahmed et al., 2016) and NFC (Near
Field Communication). Due to the popularization and
enabling opportunistic approaches, the Wi-Fi technol-
ogy in IPS (Indoor Positioning System) implementa-
tions are among the most widely used technologies
(Rai et al., 2012). Among the approaches used are the
fingerprint technique and estimates using geometric
calculations (Yang and Shao, 2015). The fingerprint-
ing technique depends on a prior mapping of the en-
vironment, whereas geometric estimates use the dis-
tances between the object to be located and three or
more landmarks with a known location.
The popularization of Wi-Fi networks has made
more and more people stay connected through their
mobile devices (Ge and Qu, 2016), opening up oppor-
tunities for other ways to exploit this technology. In
recent years, several works have used Wi-Fi technolo-
gies to obtain the location of devices in environment
indoors. In addition to allowing the use of existing
Silva, B., Lima, J., Trois, C., Pereira, W. and da Rocha, C.
No More Hiding! WALDO: Easily Locating with a Wi-Fi Opportunistic Approach.
DOI: 10.5220/0007677505710578
In Proceedings of the 21st International Conference on Enterprise Information Systems (ICEIS 2019), pages 571-578
ISBN: 978-989-758-372-8
Copyright
c
2019 by SCITEPRESS – Science and Technology Publications, Lda. All rights reserved
571

and widespread infrastructure, another motivator lies
in the energy savings of mobile devices. The use of
other sensors or interfaces, such as the accelerometer,
gyroscope, Bluetooth and magnetometer, for the sole
purpose of providing device location, result in extra
energy expenses (Lane et al., 2013).
For systems that provide localization in indoor en-
vironments, there is a relationship between accuracy
in location, complexity, cost, and scalability estimates
for implementation in real environments (Mainetti
et al., 2014). Many papers in the literature(Yang and
Shao, 2015)(Lymberopoulos et al., 2015)(Chen et al.,
2014)(Rai et al., 2012)(Kannan et al., 2013) discuss
these points separately, or even address just a few of
these. This paper presents a low-cost, scalable, indoor
location approach that uses the Wi-Fi infrastructure
available to obtain the location of commercial smart-
phones.
Among the main contributions presented in the
present work is the use of an opportunistic approach.
Another contribution is the use of a zone scheme
and ranking in the location phase of the fingerprint
technique, which ignores some RSS (Received Signal
Strength) readings that present noise. For this to be
possible, during the location phase, the mapped area
is zoned, which has a set of sampling points with their
respective fingerprint signatures. Areas with the most
extended distances between online measurement and
sampling points are calculated and excluded. Since
only the two zones with the highest probability of the
device are left, a ranking scheme is performed, to pri-
oritize the readings with less noise.
The rest of the paper is organized as follows: Sec-
tion 2 presents the motivation and related works in the
literature. Section 3 explains WALDO architecture
and the methodology used, explaining the implemen-
tation of the modules that make up the architecture.
Section 4 describes the tests and results. Finally, con-
clusion and future work are given in Section 5.
2 MOTIVATION AND RELATED
WORK
The use of the fingerprint technique, coupled with
the use of mobile devices (such as smartphones and
tablets) with Wi-Fi technology, has presented promis-
ing results in the development of indoors positioning
systems. In this approach, the smartphone to be found
must have an active Wi-Fi interface. Among the chal-
lenges encountered in this approach are the inherent
limitations of mobile devices, such as low process-
ing power, limited memory, battery usage, and the di-
versity of distinct hardware found in mobile devices
(Kannan et al., 2013). Also, radio frequency sig-
nals suffer much interference from obstacles present
in closed environments, making the use of this pa-
rameter for the unambiguous characterization of the
environment, become a great challenge. In order to
better characterize each section of the mapped envi-
ronment, Chen et al. (Chen et al., 2014) proposes an
algorithm that relates not only the power of the re-
ceived signal (RSS) but also the proximity order of
the APs according to their power. The authors hope
that in this way, the fingerprint of each room in the en-
vironment will be better defined, making it easier to
locate even when the devices have different hardware
characteristics. Using a different approach, Rai et al.
(Rai et al., 2012) make use of some of the sensors
present in smartphones (accelerometer, compass, gy-
roscope, etc) together with data obtained from Wi-Fi
and a user-informed map containing the characteris-
tics of the environment, and barriers (walls and other
obstacles).
Another challenge for the use of fingerprint-based
approaches lies in the mapping of the environment,
which demands time and work. Since the finger-
print based on a particular feature of the environment,
such as radio frequency, magnetic field or background
sound is used, this information must be captured and
stored (training stage). Therefore, the time demanded
the offline step is related to the size of the area to be
mapped, as well as the precision that one wishes to
obtain. In order to reduce this time, without com-
promising accuracy, a series of tests with short and
long duration readings were carried out in the work
of Yang et al., and it was verified that the value that
most frequently appears in the measurement (a few
minutes) is the same as long-term measurements (a
few hours). Thus, there is no need for large amounts
of capture time per site. Also, the mean values of
the readings of each position were compared with the
most frequent value, and a significant difference be-
tween the two measurements was found.
The WALDO architecture presents an approach
that detects RSS noise-free readings during the on-
line stage, eliminating them from the localization es-
timation process and thus presenting better estimates.
Also, are used techniques that have already been ad-
dressed and tested in the literature separately.
3 WALDO ARCHITECTURE
WALDO uses the fingerprint technique to perform
mapping and location devices, which in turn uses
the Received Signal Strength (RSS) data of different
WLANs whose signal covers the area to be mapped.
ICEIS 2019 - 21st International Conference on Enterprise Information Systems
572
The fingerprinting technique is divided mainly into
two distinct stages: training phase (offline) and loca-
tion phase (online). In general, this technique consists
of comparing the set of RSS readings obtained during
the training phase and the location phase RSS read-
ings set.
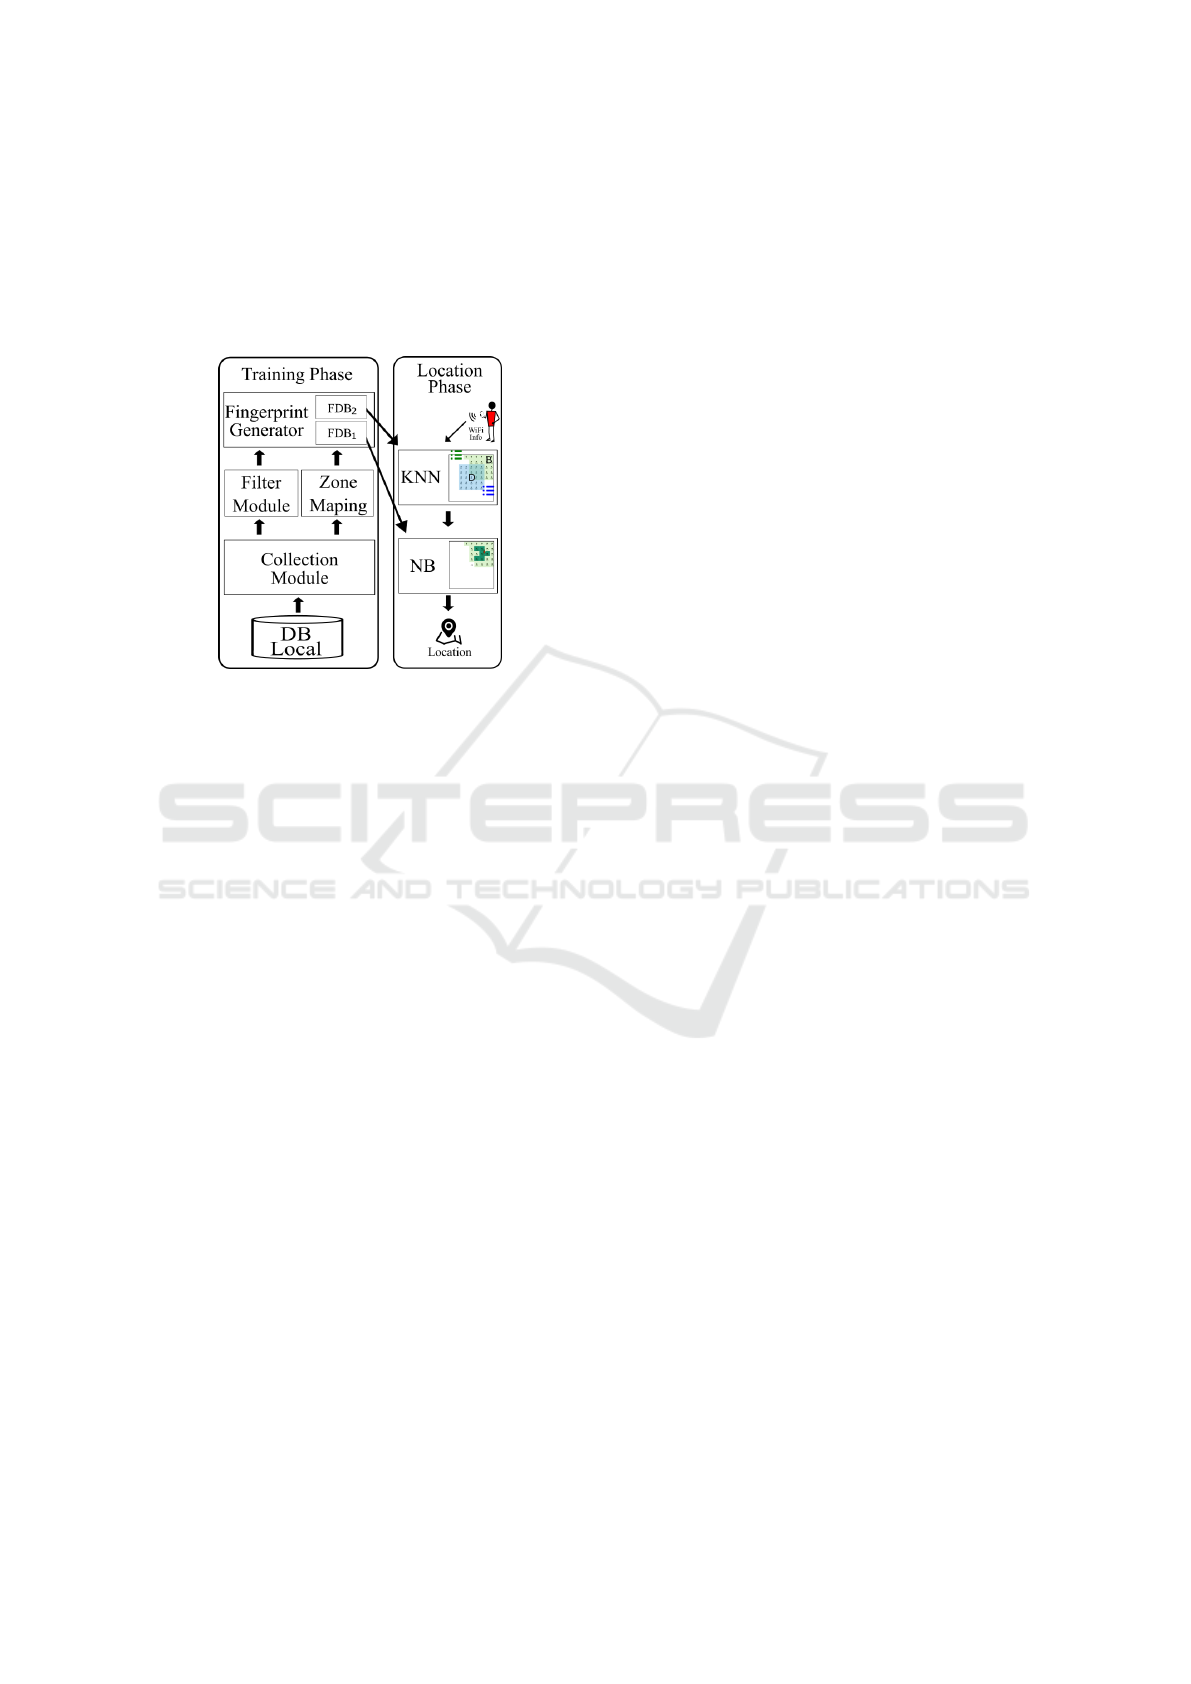
Figure 1: WALDO Architecture.
Figure 1 gives an overview of the WALDO archi-
tecture. As can be seen, the training phase and the
location phase have subdivisions which will be ex-
plained in the following sections.
3.1 Methodology
The expected result of WALDO consists of determin-
ing the location of a smartphone, within a previously
mapped area, using information from a set of nearby
Wi-Fi networks. Figure 2 presents an information
flow that describes the methods and procedures per-
formed in the process. As can be observed, analyzing
from the left, during the training phase the area and
it’s RPs (1a) are defined. In the next step (1b) the ra-
dio map is obtained, which is composed of the read-
ings performed in each of the RPs. The radio map in-
formation is used to generate FDB
1
and FDB
2
, used
for comparison purposes in the tracing process. The
location phase starts (2a) with the reading performed
by the smartphone, in the place where it should be lo-
cated. This step consists of calculating the sum of the
RP distances of each zone and the values read at the
time of the estimate of the location. The two zones
that have the sums of smaller distances will be used
in the next step. In the next step (2b), two classi-
fications are generated containing the RP list of the
two remaining zones. This RP list considers only RPs
that establish neighborhoods with the leading RP (the
nearest neighbors) of the ranking. Finally, the zone
with the highest probability of being the correct one
is identified and the Naive Bayes algorithm (NB) is
applied at the remaining points.
3.2 Collection Module
The process of the data capture consists of storing in
the database the RSS readings, associated with the
respective identifiers of the APs, performed by the
smartphone in each RP of the mapped area. To start
the capture is necessary to have the information about
the dimensions of the area to be mapped, as well as
the location of the RPs used.
During the data collection, were considered four
main characteristics. They are the number of readings
per RP, reading time, device orientation at the time of
reading and the number of RPs. The amount of RPs
and distance of spacing used in the scenario, take into
account information observed in the literature, which
indicates average distances of errors over one meter,
in an approach using Wi-Fi fingerprint. Also, the
variation of RSS readings in close RPs, presents sub-
tle differences, making the distinction between very
close RPs difficult. Once decided the number of RPs,
it is necessary to define the number of readings per-
formed by RP as well as the time of measurements
demanded. In the present work, the approach used
where the readings are performed pointing the de-
vice to four different directions, using the walls of the
room as references for each direction. In this case,
at least four different readings are taken, pointing in
each direction. Based on works cited in the literature,
such as the (Yang et al., 2013), it is known that, al-
though the oscillations demand a certain amount of
measurements per point, the values that appear with
more frequencies in short duration measurements will
be the same values that will appear more frequently in
long-duration measurements. Therefore, making the
most frequently measured value the best choice for
each RP fingerprint.
3.3 Filter Module
The variability in RSS measurement performed by a
Wi-Fi mobile device is a consequence of radio fre-
quency communication characteristics and interfer-
ence caused by indoor obstacles. Since RSS and the
identification of APs (MAC addresses and locations
in the mapped environment) are the main parame-
ters used in the estimation of positioning, the selec-
tion of the data to be labeled and used in the calcula-
tions will directly impact the quality of the position-
ing estimates. In this context, the filter module selects
the data that will be used as parameters in the loca-
tion phase. Firstly, we tried to disregard data that had
No More Hiding! WALDO: Easily Locating with a Wi-Fi Opportunistic Approach
573
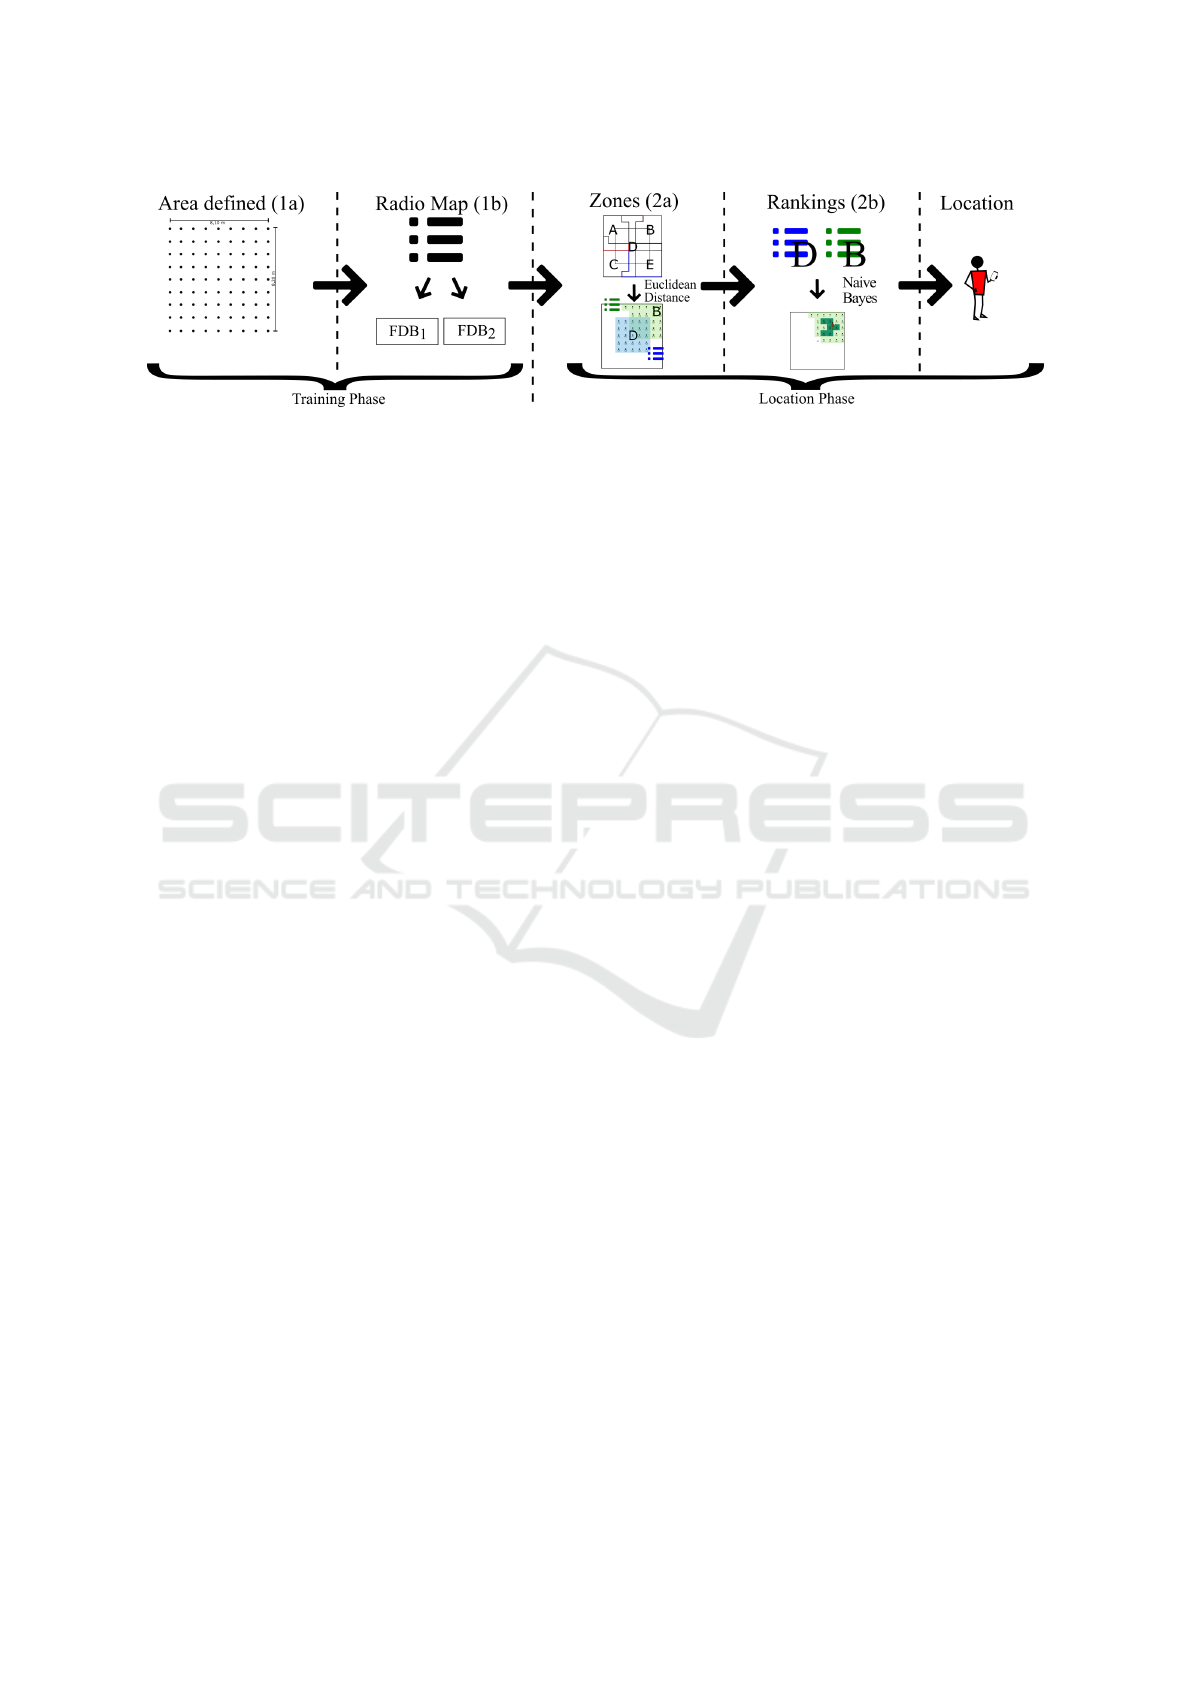
Figure 2: Information Flux.
characteristics that were inappropriate for the applica-
tion. In this sense, were identified (using interquartile
range) and excluded the outliers, generated by noise
and other phenomena such as multipath. In addition
to the outliers, data that did not appear in all RPs
was also removed. This is because the AP is distant
physically or has the signal obstructed by an obsta-
cle. In this way, some areas of the mapped environ-
ment are not covered by the signal, while others, get
fickle readings with low power. The second question
is related to the distance between the mapped loca-
tion and the device. If the long distance between the
AP and the mobile station has caused poor signal cov-
erage, and this signal is not available in all regions of
the mapped environment, the chances of obstacles oc-
curring between the transmitter and the receiver will
increase.
In approaches that use probabilistic calculations,
the larger the database, the better the results tend to
be. On the other hand, when the comparison is per-
formed with distance calculations (such as Euclidean
distance), it is more appropriate to use a less extensive
FDB, containing the measures that best characterize
each RP. In the present work, the two approaches were
used, in different stages. In this sense, two FDBs were
generated, where one presents all the readings (after
filtering) and the other presents only the RSS read-
ings that best characterize the RP (most constant RSS
values).
3.4 Fingerprint Generator
The fingerprint generator module is responsible for
obtaining the two (FDB
1
and FDB
2
) database corre-
sponding to the training phase. The first fingerprint
database (FDB
1
) is formed by all remaining data af-
ter the deletion of the outliers. The variation of the
signal, caused by the interference of the environment,
causes the intensity of the received signal of the same
AP in the same point is variable. Thus, it is known
that the higher the signal strength, the less interfer-
ence will be. In this sense, in order to prioritize the
data that suffered less interference, the records were
organized in order (decreasing) of signal power. The
reading that presents the highest RSS value for an AP
and a specific point is put first in the sequence of the
records. This organization is performed for each AP
of each point. Also, APs are also organized in de-
scending order of power. In addition to the organi-
zation and arrangement of data in an orderly manner,
the FDB
1
will be used to perform the comparison ap-
proach by probabilistic means.
FDB
1
is used to create FDB
2
. In the FDB
2
, each
RP will only have one RSS value per AP, that is,
only the RSS that most often appeared in each AP. In
this sense, the number of values present in the FDB
2
will depend on the amount of RPs, and the amount
of APs used. The two factors are self-explanatory.
The higher the number of RPs and APs, the greater
the data set associated with them. During the creation
stage of the FDB, were captured the data of all the
upcoming APs. Several APs can be observed in the
readings at each point, however, it is worth noting that
in the location phase some APs that were found dur-
ing the creation of FDB will not appear, as well as
some APs observed in the training phase will not ap-
pear in the location phase. Only values observed in
the two steps will be used.
3.5 Zone Module
The use of zones has the objective of improving the
location estimates, prioritizing the values measured in
the location phase with a lower incidence of noise.
For this, the mapped area is divided into a certain
amount of zones, as can be observed in Figure 3.
The division of the area into zones takes into ac-
count the characteristics of the mapped area as the
dimensions of the area and the total amount of RPs
(T RP). The scenario presented in Figure 3 was di-
vided into 5 zones (T z), identified by upper case let-
ters. The equation 1 give the number of RPs for
each zone. The division begins with the choice of
five strategic points on the map. From these points
each zone is segmented. In the example, the area of
each zone (Az) corresponds to 24 RPs plus the chosen
ICEIS 2019 - 21st International Conference on Enterprise Information Systems
574
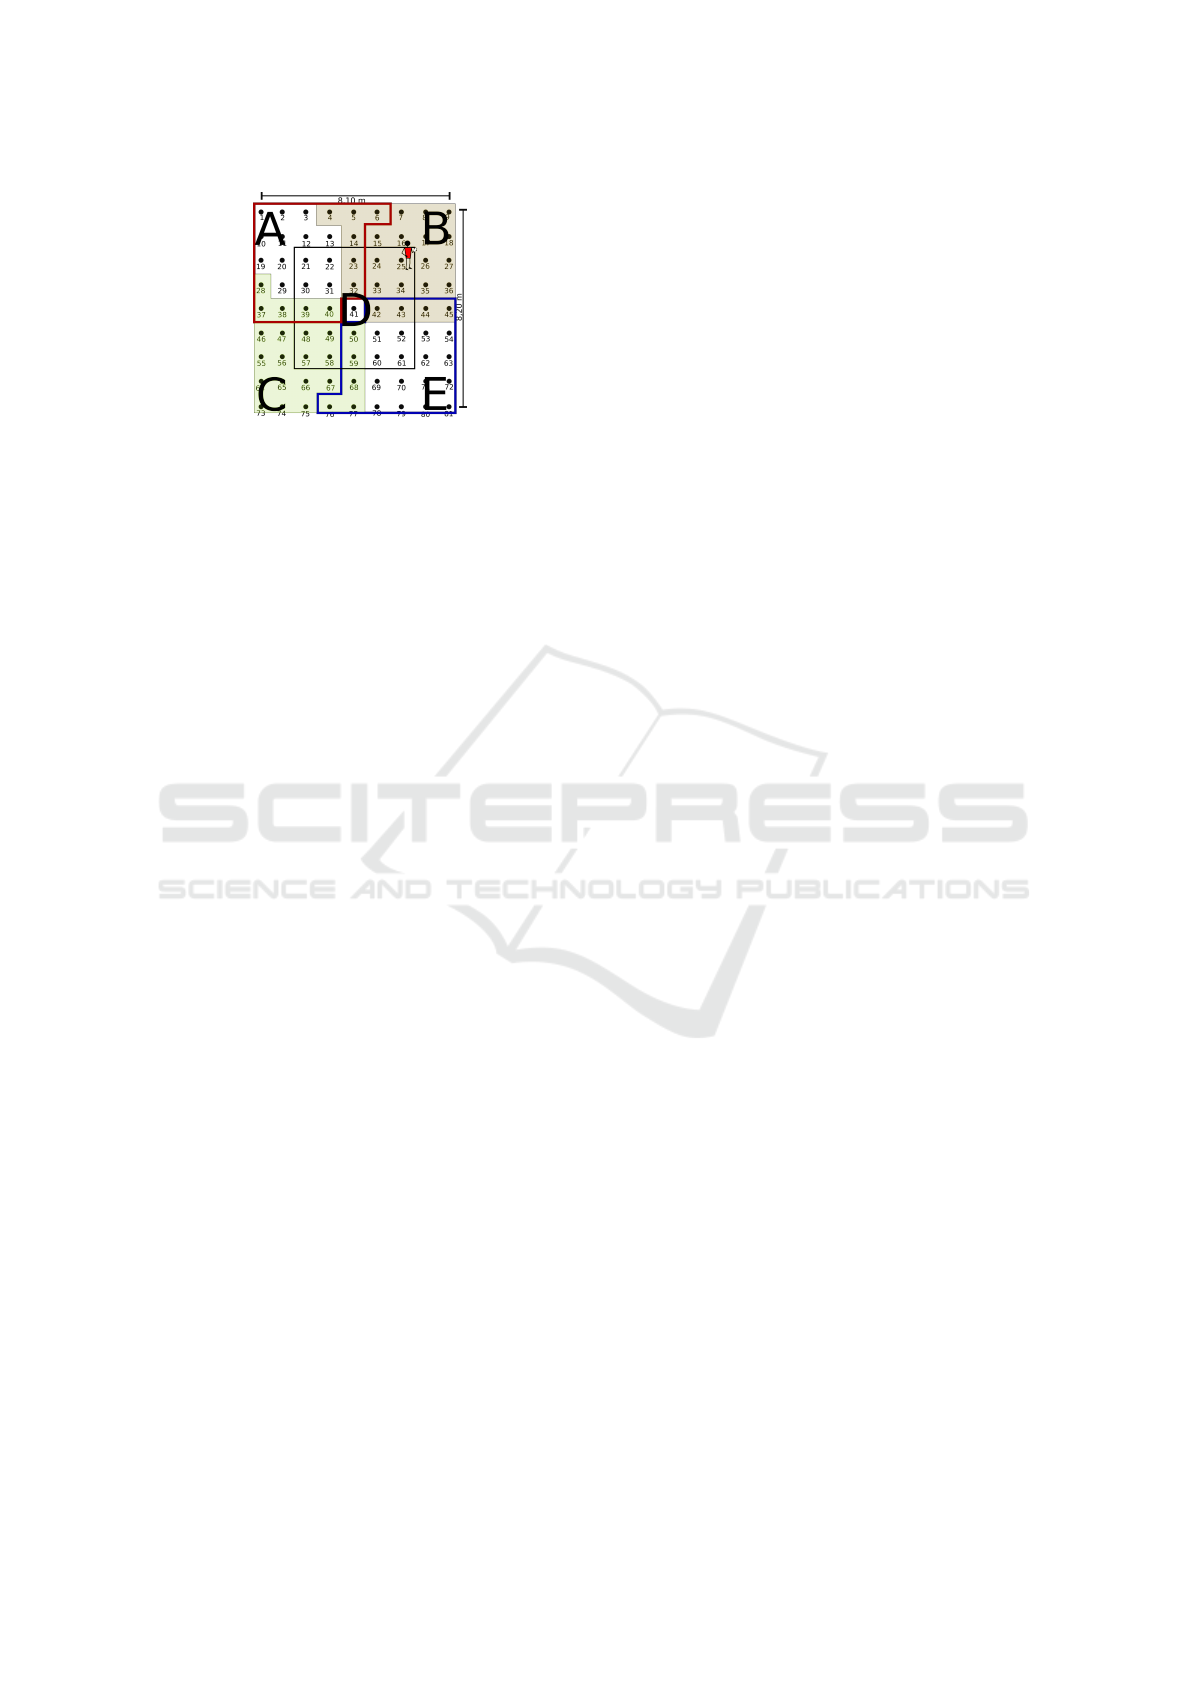
Figure 3: The total area of the computer lab divided into
five zones.
point, totaling 25 RPs per zone. In this scenario, the
four extreme RPs (1, 9, 73 and 81) besides the central
RP (41) were chosen as starting points of each zone.
Az = b(T RP/T z)c + [b(T RP/T z)/2c] (1)
3.6 Location Phase
Once the environment is mapped, the next step is the
location of the smartphone. The location of the de-
vice is performed by comparing the data obtained at
the time of screening (online step) and the present
data from the system database. The process of lo-
cation estimation starts when it is in the mapped en-
vironment, with the active Wi-Fi interface. Given the
characteristics of the Wi-Fi technology, described by
the IEEE 802.11 standard (Potort
`
ı et al., 2016)(Group
et al., 1999), in order to obtain the device data (MAC
address and RSS), it is not necessary that it be con-
nected to the Wi-Fi network. This information is
broadcast on the mobile device in order to find the
available APs within reach. This information can be
obtained at both ends of the communication, that is,
in both the mobile station and the AP. In the present
work, the validation tests and implementation of ar-
chitecture were created with the help of two applica-
tions. These are designed to obtain the data from all
APs close and send them to a server. Thus, in the im-
plementation, the RSS data obtained from the mobile
station were used. Therefore, there are no change re-
quirements in the existing network infrastructure.
3.6.1 k-NN Module
Upon receiving the data, the manager application,
running on a remote server, performs the necessary
procedures to obtain the approximate location of the
mobile station. First, it checks which APs read from
the database FDB
2
, and discarded the readings from
unknown APs. The first comparison uses the Eu-
clidean distance equation, where are comparing the
location parameters with each of the RPs. The closer
to zero is the value resulting from the comparisons,
the more similar the values are.
From the Euclidean distance calculation, it is pos-
sible to verify the locations with less probability of
the smartphone being. In this sense, an approach
based on the kNN (k-Nearest Neighbors) algorithm,
which uses a measure of similarity (or dissimilar-
ity) between neighboring points, was used to classify
datasets (Ge and Qu, 2016). In this approach, the
measure of similarity used is the Euclidean distance,
and the neighbors are the data of the RPs present in
the FDB
2
, whose Euclidean distance is the smallest.
When obtaining the similarity value for each RP, they
are added between each zone separately, in order to
obtain the sum of the distances of each zone. By iden-
tifying the two zones with the smallest sums of Eu-
clidean distances, we discard the zones whose calcu-
lations have indicated to be the least likely (farthest)
of the smartphone to be located.
With two zones remaining, the next action consists
of identifying and eliminating the zone with the least
probability of the device being, so that only one re-
mains to be analyzed. The next action taken takes into
account RSS variability characteristics. It is known
that within the set of parameters obtained, some of
them reflect the characteristics of the environment
where the device is, while others, due to interference
suffered at the time of reading, are with parameters
that do not characterize that point. From this infor-
mation, it is observed the need to identify which data
was read with interference and which suffered less
variation. In this sense, a ranking of results is gen-
erated for each remaining zone, in ascending order,
from the most similar to the least similar. From this
step, the comparison between the zones is no longer
made by the sum of all the results, and starts to be
done by comparing the positions of each ranking, pri-
oritizing the most similar values with those present in
the FDB
2
, and keeping the least similar (which have
undergone significant variations) for tiebreaking ends.
The table 1 presents an example of ranking, with
the most probable points of each zone. To reach these
points are taken into account two Euclidean distances.
The first is the distance between RSS values calcu-
lated in the first location phase. The second is the
physical distance between the RPs. This distance does
not take into account radio frequency information, but
rather the distance of all points of the zone, concern-
ing the leader point of the ranking. In other words,
it seeks to find the neighboring points of the leader
RP. With this information, the first 13 points closest
to the leader of each zone are selected, which in the
test scenario correspond to half the total number of
No More Hiding! WALDO: Easily Locating with a Wi-Fi Opportunistic Approach
575
points in the zone. Of the 13 selected points, 12 are
located within the zone. Of the remaining 12, only 6
are points near the first point of the ranking. These 6
points are those presented by the table 1.
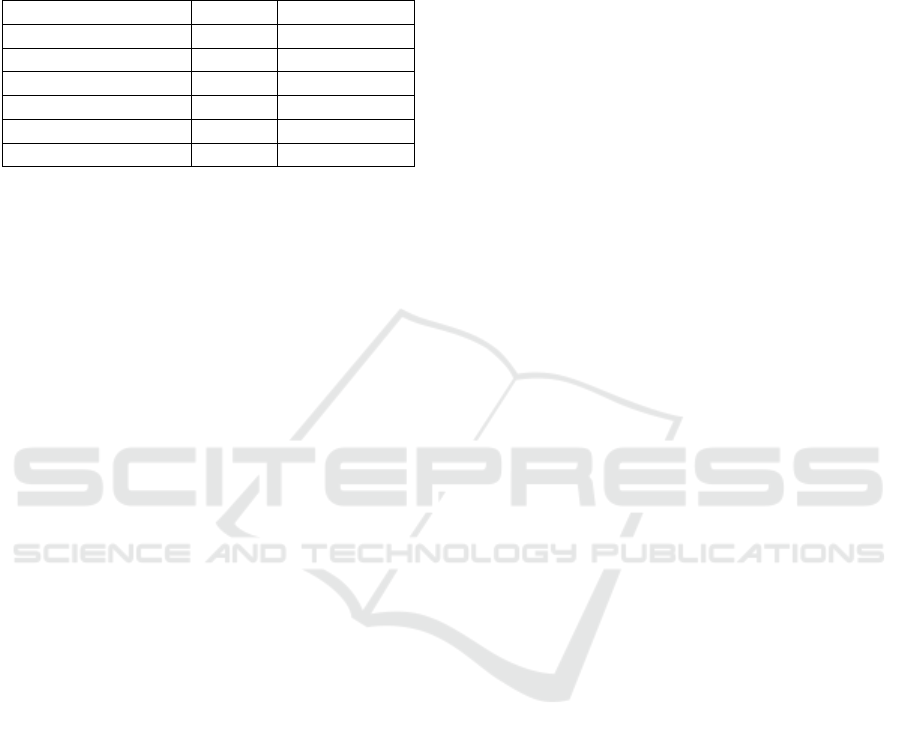
Table 1: Ranking table for zones B and D.
AP Zona B / Zona D PA B/D Dist
ˆ
ancia B/D
fe:d1:b8 / be:b4:ab 24 / 41 0 / 0
f7:8f:26 / f7:8f:26 27 / 20 0 / 1
8e:d0:a0 / be:b4:ab 33 / 31 0 / 2
be:b4:ab / 87:22:01 35 / 51 1 / 1
87:22:01 / fe:d1:b8 24 / 49 1 / 2
be:b4:06 / - 21 / - 2 / -
The comparison between the remaining zones, to
determine which zone is most likely, follows the fol-
lowing conditions:
• First (most common) case: the values of the ta-
ble 1, the distance from the leading point of zone
B will be compared with the distance of the lead-
ing point of zone D. When verifying that they are
equal, the second point of zone B will be com-
pared with the second point of zone D. At this
point, it is verified that the distance value of zone
B is smaller. Then the set of points in Zone B is
elected the most probable set;
• Second: when one of the two zones compared
presents all values of distance equal to zero, the
zone will be chosen as most probable;
• Third, because the two rankings have different
sizes, in some cases, during the comparison the
values of one of the rankings will be exhausted,
while the other will still have values to test. In
these situations, where the tie in the compar-
isons persisted, the zone identified with the high-
est probability during the comparison between the
five possible, will be the zone chosen.
With the set of RPs reduced, it is necessary to
identify which of the remaining RPs is most likely to
be the location of the device. For this applied Naive
Bayes classifier algorithm.
3.6.2 NB Module
When using Naive Bayes classifier algorithm, the
odds obtained through the measures for each of the
APs are independent of each other since the RSS mea-
sures read by the smartphone about each AP are also
independent. In the current scenario, with a reduced
set of RPs to be analyzed, the use of Naive Bayes be-
comes an interesting approach. In this sense, the data
stored in the training phase corresponds to the training
dataset, while the data received from the client station,
in the location phase, is the data to be classified. In or-
der to NB classifier present better results, in this step
is to use the FDB
2
, which has a more extensive data
set.
Continuing the example of the smartphone loca-
tion, six points remain. Starting with the RP number
15, the parameters to be passed to the Naive Bayes
are: the identifier of the RP, one of the APs sent by the
mobile station and its respective RSS measure. The
result returned is the probability that the AP and RSS
belong to the set of values of RP 15. This process
is repeated in RP 15 as there are distinct APs pro-
vided by online reading. If the mobile station sent a
set of five APs in the reading, the five APs and RSS
would be compared with the RP 15. The same pro-
cess carried out in RP 15 is done in the other RPs.
To conclude, the sets of probabilities are summed and
verified which RPs have the most significant sum.
4 TESTING AND RESULTS
Among the methods used to evaluate IPSs are the
precision, accuracy, scalability, robustness, cost and
complexity tests (Hossain and Soh, 2015). As noted
in the literature, short distance technologies usually
provide better accuracy than others because they suf-
fer less interference and ensure device position more
accurately. Thus, the tests used for the validation of a
tool, are dependent on the approach that was used. A
Wi-Fi-based IPS does not offer as good an accuracy
as an IPS that uses NFC TAGs, for example. On the
other hand, the need to install TAGs, besides requiring
the use of mobile devices compatible with technology,
make the NFC-based approach more expensive and
less scalable. In that sense, while a technique gains in
accuracy, it loses in scalability and cost.
Considering the characteristics of WALDO, the
tests carried out have the objective of evaluating the
precision and accuracy of the location estimates. The
precision is determined by some method of distance
measurement, such as Euclidean distance, accuracy is
obtained based on a set of precision test results. Due
to the amount of Wi-Fi available for use in most urban
areas, the challenge of scalability, as well as for the
complexity of the implementation, is related to map-
ping the area, which demands time. Because it is an
opportunistic approach that uses the existing infras-
tructure, the cost of implementation is reduced.
To validate the architecture, in addition to the
dataset used in the architecture development, we used
the KIOS Wi-Fi RSS dataset, more specifically the
database called Desire, made available by (Laoudias
et al., 2013). KIOS consists of a collection of RSS
ICEIS 2019 - 21st International Conference on Enterprise Information Systems
576
samples, a mobile device with Wi-Fi support. Data
were collected in a typical 560 square meter office
space consisting of a conference room, laboratories,
and corridors. Within this area, data were selected at
105 different sampling points.
Using the dataset obtained in the computer lab, a
test was performed in each RP, aiming to obtain a per-
ception of the results throughout the room area. In this
sense, 81 location estimates were made. The readings
were made from a smartphone and sent to a server
with the implementation of the WALDO architecture,
which performed the calculations.
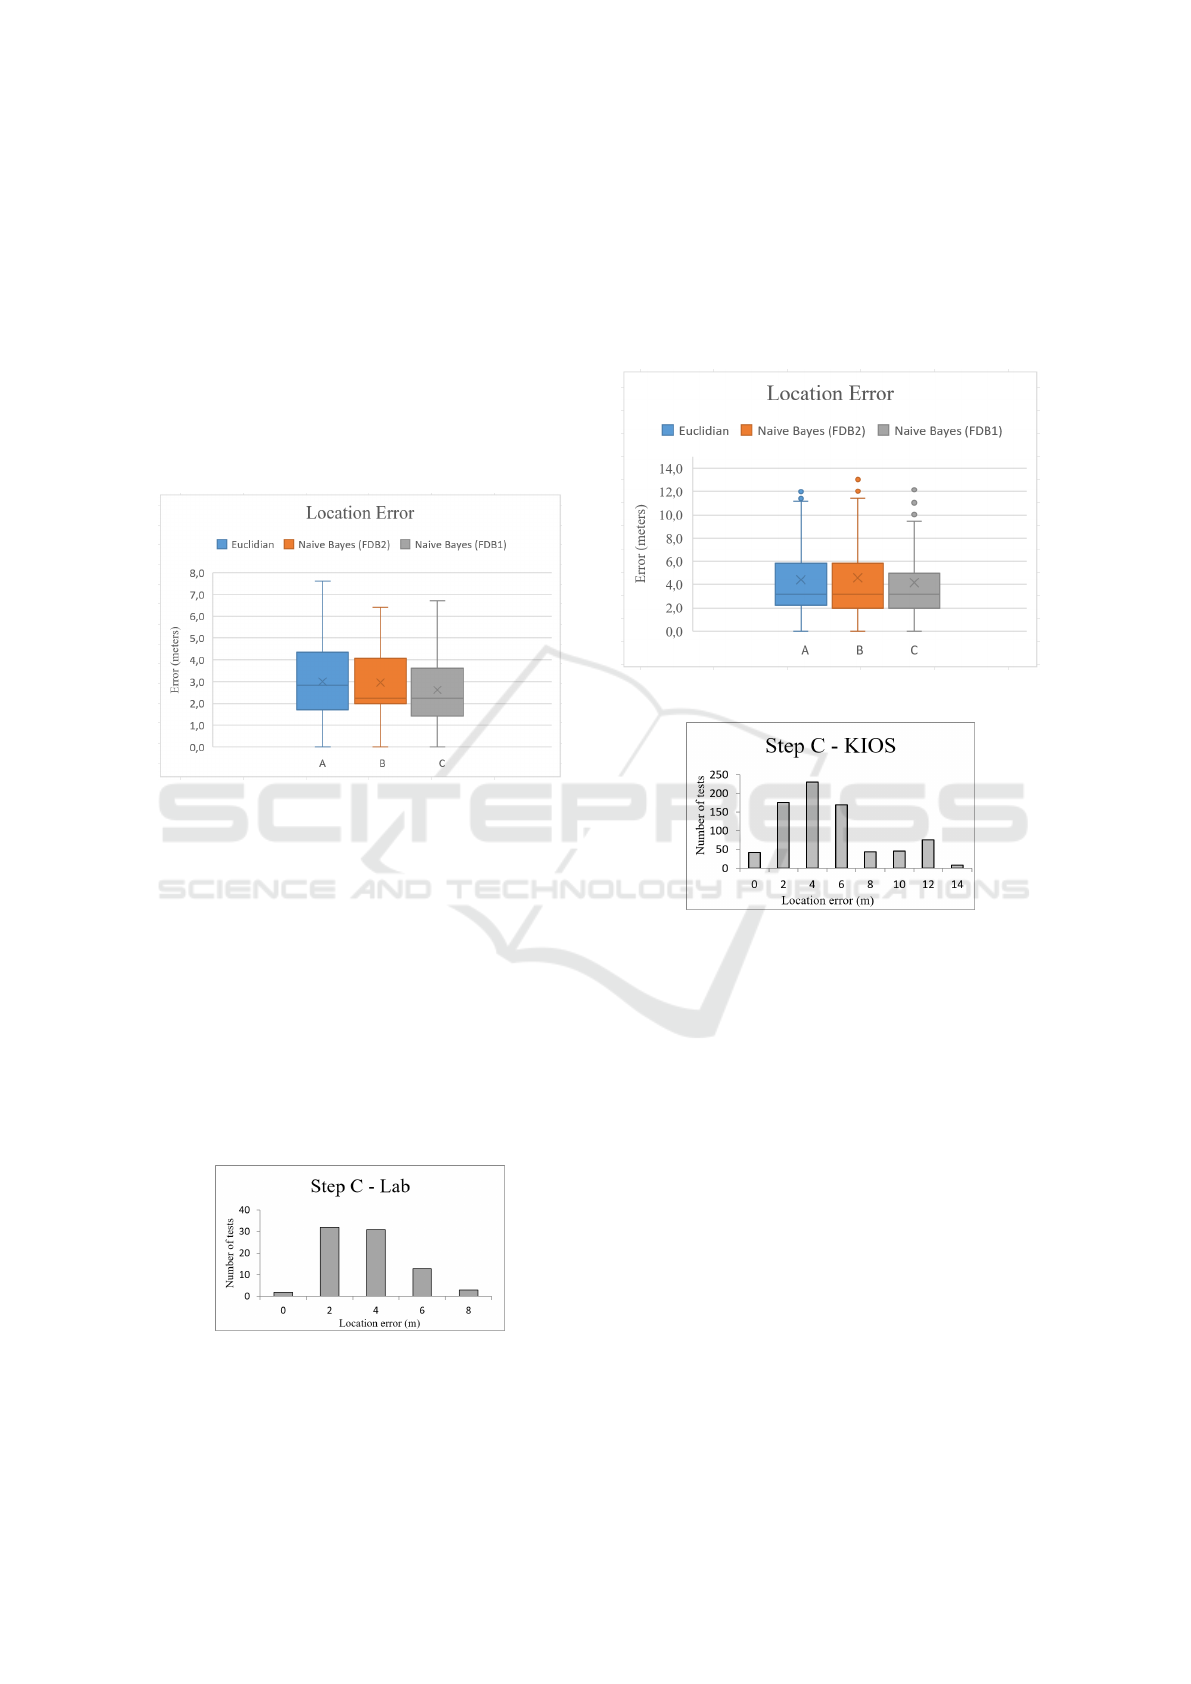
Figure 4: Location errors using the dataset of the computer
lab.
In the graph of Figure 4 the results of steps A, B
and C are presented respectively. Of all the points
tested, the location estimate with the greatest discrep-
ancy between the estimated location and the actual lo-
cation presented just under 8 meters away. Despite
this, most of the results shown in C (using WALDO),
present results with errors of little more than 2 me-
ters. In the histogram presented by Figure 5, the data
from step C are shown, evidencing the frequency with
which each estimate was made. Among the tests that
presented estimates with a precision of 0 to 4 meters,
most of these show estimates with a little more than 2
meters of error.
Figure 5: Histogram: location estimation errors using
WALDO architecture with the computer lab datase.
The same tests were performed by the KIOS
dataset and the results are presented in Figure 6. In
total, 792 tests were performed in several RPs of the
mapped environment. Observing the results of the es-
timates made through WALDO (step C), it can be ob-
served that most of the tests present results with errors
between 2 and 5 meters, with a median of approxi-
mately 3 meters. In addition, some outliers can be
observed, with errors over 10 meters.
Figure 6: Location errors using the KIOS dataset.
Figure 7: Histogram: location estimation errors using
WALDO architecture with the KIOS dataset.
5 CONCLUSION AND FUTURE
WORK
In the present work, an opportunistic system was pre-
sented that uses the available WLAN infrastructure to
provide the indoor location. Since there is no need to
install additional sensors, the costs for implementing
the WALDO architecture are greatly reduced. In addi-
tion, Wi-Fi technology is widely used by smartphone
users, so it is easy to access.
Because of the high variability of the strength of
the Wi-Fi signal, due to the interference and noise
common indoors, the estimation of positioning calcu-
lations can often suffer great influences. With the ap-
proach used in WALDO, by dividing the mapped en-
vironment into zones and using the rankings scheme,
it was possible to prioritize the readings (trace stage)
with less noise, causing outliers to receive less weight
or to be disregarded in the calculations.
No More Hiding! WALDO: Easily Locating with a Wi-Fi Opportunistic Approach
577

With the increasing growth of ubiquitous and per-
vasive technologies directed to internal environments,
it is evident the need of the applications to know the
location of the mobile devices to better adapt to sit-
uations, offering better services. Identifying that a
user is in a certain environment, because it is port-
ing a smartphone, creates several new possibilities
for applications. The WALDO provides parameters
to identify the location of mobile devices, with low
location errors, making it suitable for many types of
applications. The precision tests were performed us-
ing two distinct datasets, aiming to obtain non-biased
results. Although this is an opportunistic approach,
using variable signal technology, the test results were
satisfactory.
As future work, tests will be performed regard-
ing the influence caused by the use of heterogeneous
devices during the estimation of positioning. In addi-
tion, it is intended to implement a system that obtains
the RSS and MAC information through the APs, in
a passive tracking approach. In this way, it is possi-
ble to estimate the location of both sides of the com-
munication, seeking to improve the precision in the
estimates. In addition, the use of other information
sources along with Wi-Fi will be tested.
ACKNOWLEDGEMENTS
The authors would like to thank Penguim Formula
for partial supporting/funding of this research and
UFSM/FATEC through project number 041250 -
9.07.0025 (100548).
REFERENCES
Ahmed, T., Calders, T., and Pedersen, T. B. T. (2016). An-
alytics on indoor moving objects with applications in
airport baggage tracking.
Chen, L.-H., Wu, E. H.-K., Jin, M.-H., and Chen, G.-H.
(2014). Homogeneous features utilization to address
the device heterogeneity problem in fingerprint local-
ization. IEEE Sensors Journal, 14(4):998–1005.
Fukuzaki, Y., Mochizuki, M., Murao, K., and Nishio, N.
(2015). Statistical analysis of actual number of pedes-
trians for wi-fi packet-based pedestrian flow sensing.
In Adjunct Proceedings of the 2015 ACM Interna-
tional Joint Conference on Pervasive and Ubiquitous
Computing and Proceedings of the 2015 ACM Inter-
national Symposium on Wearable Computers, pages
1519–1526. ACM.
Ge, X. and Qu, Z. (2016). Optimization wifi indoor posi-
tioning knn algorithm location-based fingerprint. In
Software Engineering and Service Science (ICSESS),
2016 7th IEEE International Conference on, pages
135–137. IEEE.
Group, I. . W. et al. (1999). Part11: Wireless lan medium
access control (mac) and physical layer (phy) specifi-
cations. ANSI/IEEE Std. 802.11.
Hossain, A. M. and Soh, W.-S. (2015). A survey of
calibration-free indoor positioning systems. Com-
puter Communications, 66:1–13.
Kanan, R. and Elhassan, O. (2016). A combined batteryless
radio and wifi indoor positioning for hospital nursing.
Kannan, B., Meneguzzi, F., Dias, M. B., and Sycara, K.
(2013). Predictive indoor navigation using commer-
cial smart-phones. In Proceedings of the 28th Annual
ACM Symposium on Applied Computing, pages 519–
525. ACM.
Lane, N. D., Chon, Y., Zhou, L., Zhang, Y., Li, F., Kim,
D., Ding, G., Zhao, F., and Cha, H. (2013). Pig-
gyback crowdsensing (pcs): energy efficient crowd-
sourcing of mobile sensor data by exploiting smart-
phone app opportunities. In Proceedings of the 11th
ACM Conference on Embedded Networked Sensor
Systems, page 7. ACM.
Laoudias, C., Pich
´
e, R., and Panayiotou, C. (2013). De-
vice self-calibration in location systems using signal
strength histograms. 7:165–181.
Lymberopoulos, D., Liu, J., Yang, X., Choudhury, R. R.,
Handziski, V., and Sen, S. (2015). A realistic evalua-
tion and comparison of indoor location technologies:
Experiences and lessons learned. In Proceedings of
the 14th international conference on information pro-
cessing in sensor networks, pages 178–189. ACM.
Mainetti, L., Patrono, L., and Sergi, I. (2014). A survey on
indoor positioning systems. In Software, Telecommu-
nications and Computer Networks (SoftCOM), 2014
22nd International Conference on, pages 111–120.
IEEE.
Oosterlinck, D., Benoit, D. F., Baecke, P., and Van de
Weghe, N. (2017). Bluetooth tracking of humans in
an indoor environment: An application to shopping
mall visits. Applied Geography, 78:55–65.
Paul, A. S. and Wan, E. A. (2009). Rssi-based indoor
localization and tracking using sigma-point kalman
smoothers. IEEE Journal of Selected Topics in Sig-
nal Processing, 3(5):860–873.
Potort
`
ı, F., Crivello, A., Girolami, M., Traficante, E., and
Barsocchi, P. (2016). Wi-fi probes as digital crumbs
for crowd localisation. pages 1–8.
Rai, A., Chintalapudi, K. K., Padmanabhan, V. N., and Sen,
R. (2012). Zee: Zero-effort crowdsourcing for indoor
localization. In Proceedings of the 18th annual in-
ternational conference on Mobile computing and net-
working, pages 293–304. ACM.
Yang, C. and Shao, H.-R. (2015). Wifi-based indoor posi-
tioning. IEEE Communications Magazine, 53(3):150–
157.
Yang, S., Dessai, P., Verma, M., and Gerla, M. (2013). Free-
loc: Calibration-free crowdsourced indoor localiza-
tion. In INFOCOM, 2013 Proceedings IEEE, pages
2481–2489. IEEE.
ICEIS 2019 - 21st International Conference on Enterprise Information Systems
578
